Boosted Regression (Boosting): An introductory tutorial and a Stata ...
Boosted Regression (Boosting): An introductory tutorial and a Stata ...
Boosted Regression (Boosting): An introductory tutorial and a Stata ...

You also want an ePaper? Increase the reach of your titles
YUMPU automatically turns print PDFs into web optimized ePapers that Google loves.
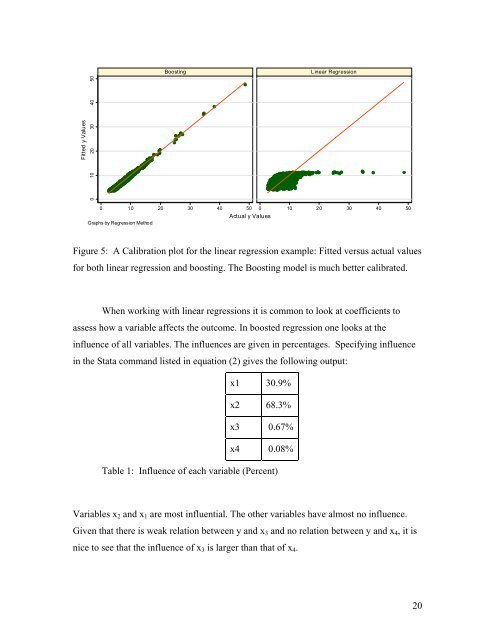
<strong>Boosting</strong>Linear <strong>Regression</strong>Fitted y Values0 10 20 30 40 500 10 20 30 40 50 0 10 20 30 40 50Actual y ValuesGraphs by <strong>Regression</strong> MethodFigure 5: A Calibration plot for the linear regression example: Fitted versus actual valuesfor both linear regression <strong>and</strong> boosting. The <strong>Boosting</strong> model is much better calibrated.When working with linear regressions it is common to look at coefficients toassess how a variable affects the outcome. In boosted regression one looks at theinfluence of all variables. The influences are given in percentages. Specifying influencein the <strong>Stata</strong> comm<strong>and</strong> listed in equation (2) gives the following output:x1 30.9%x2 68.3%x3 0.67%x4 0.08%Table 1: Influence of each variable (Percent)Variables x 2 <strong>and</strong> x 1 are most influential. The other variables have almost no influence.Given that there is weak relation between y <strong>and</strong> x 3 <strong>and</strong> no relation between y <strong>and</strong> x 4 , it isnice to see that the influence of x 3 is larger than that of x 4 .20