Boosted Regression (Boosting): An introductory tutorial and a Stata ...
Boosted Regression (Boosting): An introductory tutorial and a Stata ...
Boosted Regression (Boosting): An introductory tutorial and a Stata ...
You also want an ePaper? Increase the reach of your titles
YUMPU automatically turns print PDFs into web optimized ePapers that Google loves.
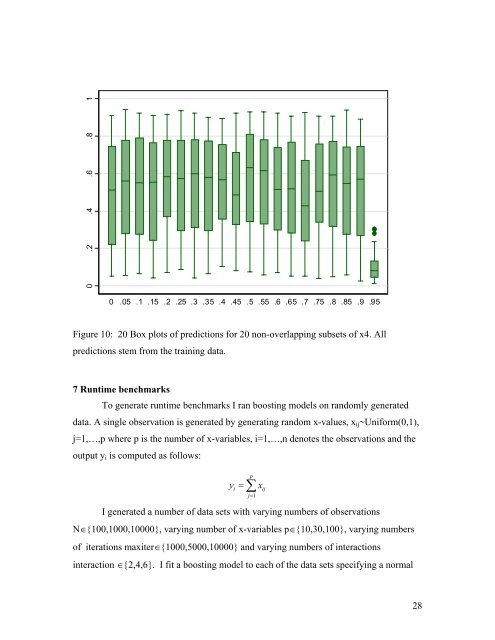
0 .2 .4 .6 .8 10 .05 .1 .15 .2 .25 .3 .35 .4 .45 .5 .55 .6 .65 .7 .75 .8 .85 .9 .95Figure 10: 20 Box plots of predictions for 20 non-overlapping subsets of x4. Allpredictions stem from the training data.7 Runtime benchmarksTo generate runtime benchmarks I ran boosting models on r<strong>and</strong>omly generateddata. A single observation is generated by generating r<strong>and</strong>om x-values, x ij ~Uniform(0,1),j=1,…,p where p is the number of x-variables, i=1,…,n denotes the observations <strong>and</strong> theoutput y i is computed as follows:yip= ∑ xj=1ijI generated a number of data sets with varying numbers of observationsN∈{100,1000,10000}, varying number of x-variables p∈{10,30,100}, varying numbersof iterations maxiter∈{1000,5000,10000} <strong>and</strong> varying numbers of interactionsinteraction ∈{2,4,6}. I fit a boosting model to each of the data sets specifying a normal28


