Boosted Regression (Boosting): An introductory tutorial and a Stata ...
Boosted Regression (Boosting): An introductory tutorial and a Stata ...
Boosted Regression (Boosting): An introductory tutorial and a Stata ...

You also want an ePaper? Increase the reach of your titles
YUMPU automatically turns print PDFs into web optimized ePapers that Google loves.
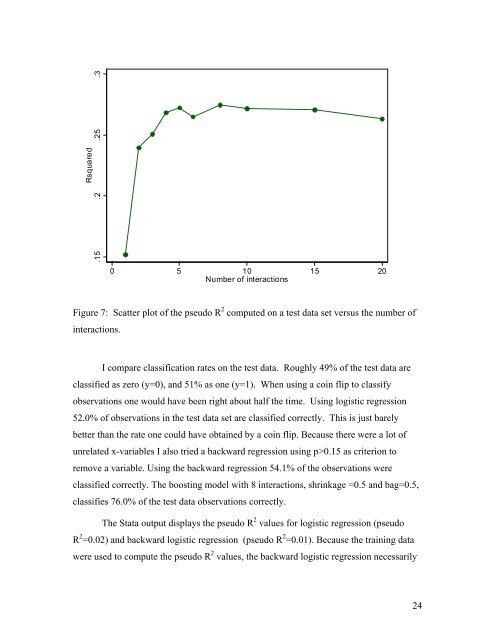
Rsquared.15 .2 .25 .30 5 10 15 20Number of interactionsFigure 7: Scatter plot of the pseudo R 2 computed on a test data set versus the number ofinteractions.I compare classification rates on the test data. Roughly 49% of the test data areclassified as zero (y=0), <strong>and</strong> 51% as one (y=1). When using a coin flip to classifyobservations one would have been right about half the time. Using logistic regression52.0% of observations in the test data set are classified correctly. This is just barelybetter than the rate one could have obtained by a coin flip. Because there were a lot ofunrelated x-variables I also tried a backward regression using p>0.15 as criterion toremove a variable. Using the backward regression 54.1% of the observations wereclassified correctly. The boosting model with 8 interactions, shrinkage =0.5 <strong>and</strong> bag=0.5,classifies 76.0% of the test data observations correctly.The <strong>Stata</strong> output displays the pseudo R 2 values for logistic regression (pseudoR 2 =0.02) <strong>and</strong> backward logistic regression (pseudo R 2 =0.01). Because the training datawere used to compute the pseudo R 2 values, the backward logistic regression necessarily24