

Webless Migratory Game Bird Program - U.S. Fish and Wildlife Service
Webless Migratory Game Bird Program - U.S. Fish and Wildlife Service
Webless Migratory Game Bird Program - U.S. Fish and Wildlife Service

You also want an ePaper? Increase the reach of your titles
YUMPU automatically turns print PDFs into web optimized ePapers that Google loves.
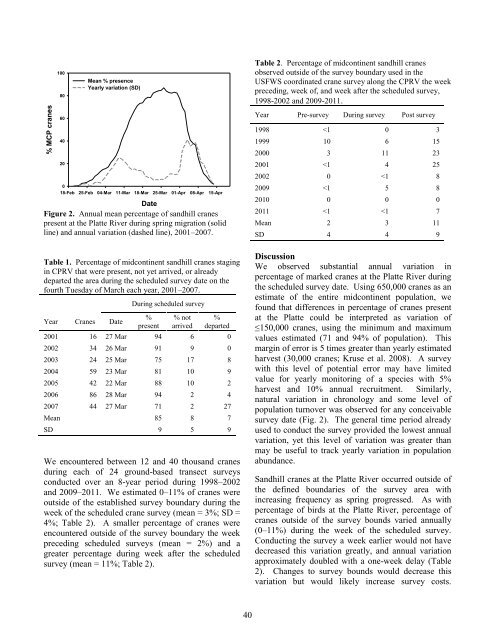
% MCP cranes<br />
100<br />
80<br />
60<br />
40<br />
20<br />
Mean % presence<br />
Yearly variation (SD)<br />
0<br />
18-Feb 25-Feb 04-Mar 11-Mar 18-Mar 25-Mar 01-Apr 08-Apr 15-Apr<br />
Date<br />
Figure 2. Annual mean percentage of s<strong>and</strong>hill cranes<br />
present at the Platte River during spring migration (solid<br />
line) <strong>and</strong> annual variation (dashed line), 2001–2007.<br />
Table 1. Percentage of midcontinent s<strong>and</strong>hill cranes staging<br />
in CPRV that were present, not yet arrived, or already<br />
departed the area during the scheduled survey date on the<br />
fourth Tuesday of March each year, 2001–2007.<br />
Year Cranes Date<br />
During scheduled survey<br />
%<br />
present<br />
% not<br />
arrived<br />
%<br />
departed<br />
2001 16 27 Mar 94 6 0<br />
2002 34 26 Mar 91 9 0<br />
2003 24 25 Mar 75 17 8<br />
2004 59 23 Mar 81 10 9<br />
2005 42 22 Mar 88 10 2<br />
2006 86 28 Mar 94 2 4<br />
2007 44 27 Mar 71 2 27<br />
Mean 85 8 7<br />
SD 9 5 9<br />
We encountered between 12 <strong>and</strong> 40 thous<strong>and</strong> cranes<br />
during each of 24 ground-based transect surveys<br />
conducted over an 8-year period during 1998–2002<br />
<strong>and</strong> 2009–2011. We estimated 0–11% of cranes were<br />
outside of the established survey boundary during the<br />
week of the scheduled crane survey (mean = 3%; SD =<br />
4%; Table 2). A smaller percentage of cranes were<br />
encountered outside of the survey boundary the week<br />
preceding scheduled surveys (mean = 2%) <strong>and</strong> a<br />
greater percentage during week after the scheduled<br />
survey (mean = 11%; Table 2).<br />
40<br />
Table 2. Percentage of midcontinent s<strong>and</strong>hill cranes<br />
observed outside of the survey boundary used in the<br />
USFWS coordinated crane survey along the CPRV the week<br />
preceding, week of, <strong>and</strong> week after the scheduled survey,<br />
1998-2002 <strong>and</strong> 2009-2011.<br />
Year Pre-survey During survey Post survey<br />
1998


