Global review of national ambient air quality standards for PM10 and ...
Global review of national ambient air quality standards for PM10 and ...
Global review of national ambient air quality standards for PM10 and ...

Create successful ePaper yourself
Turn your PDF publications into a flip-book with our unique Google optimized e-Paper software.
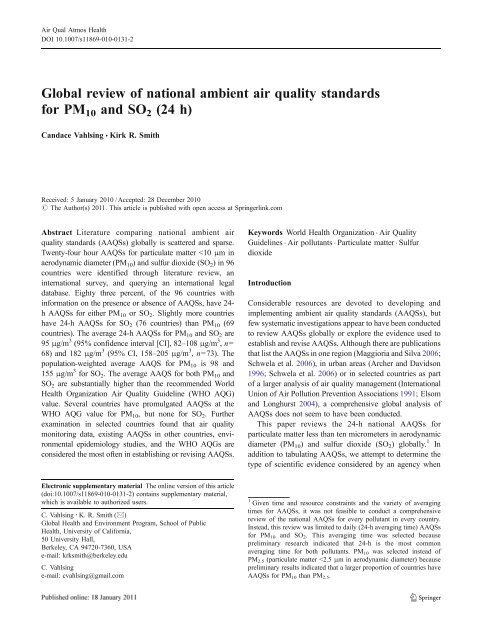
Air Qual Atmos HealthDOI 10.1007/s11869-010-0131-2<strong>Global</strong> <strong>review</strong> <strong>of</strong> <strong>national</strong> <strong>ambient</strong> <strong>air</strong> <strong>quality</strong> <strong>st<strong>and</strong>ards</strong><strong>for</strong> PM 10 <strong>and</strong> SO 2 (24 h)C<strong>and</strong>ace Vahlsing & Kirk R. SmithReceived: 5 January 2010 /Accepted: 28 December 2010# The Author(s) 2011. This article is published with open access at Springerlink.comAbstract Literature comparing <strong>national</strong> <strong>ambient</strong> <strong>air</strong><strong>quality</strong> <strong>st<strong>and</strong>ards</strong> (AAQSs) globally is scattered <strong>and</strong> sparse.Twenty-four hour AAQSs <strong>for</strong> particulate matter
Air Qual Atmos Healthestablishing or revising AAQSs, specifically the use <strong>of</strong> theWorld Health Organization Air Quality Guidelines.In 2006, the World Health Organization (WHO) publishedglobal <strong>air</strong> <strong>quality</strong> guidelines (AQGs) <strong>for</strong> PM 10 ,SO 2 ,NO 2 <strong>and</strong> ozone (WHO 2006; Krzyzanowski <strong>and</strong> Cohen2008). Thus far, there have been four versions (WHO 1987,2000a, b, 2006) <strong>of</strong> the World Health Organization AirQuality Guidelines (WHO AQGs). The guidelines whichprovide an inter<strong>national</strong> reference that countries, particularlythose without the resources to conduct their ownassessment, can use to develop AAQSs.The 2006 WHO AQGs are composed <strong>of</strong> a single guidelinevalue <strong>and</strong> interim targets (ITs). The interim targets provide astepwise approach to achieving the <strong>air</strong> <strong>quality</strong> guidelinevalue. The guideline values can be used by developedcountries, with the capacity to implement a strict AAQS,while developing countries, with higher levels <strong>of</strong> <strong>air</strong>pollution, could select an interim target level achievablebased on their own <strong>air</strong> <strong>quality</strong> management infrastructure,<strong>and</strong> progress towards the AQG value at their own pace.MethodsThis research focuses on both <strong>national</strong> AAQSs, which arelegally binding, <strong>and</strong> voluntary <strong>ambient</strong> <strong>air</strong> <strong>quality</strong> guidelines(AAQGs). Although AAQSs <strong>and</strong> AAQGs are substantiallydifferent, when examining how they are implemented <strong>and</strong>en<strong>for</strong>ced, these topics are not the focus <strong>of</strong> this <strong>review</strong>. As aresult, both AAQSs <strong>and</strong> AAQGs are referred to as AAQSsunless explicitly stated otherwise. When available the type <strong>of</strong>AAQS, i.e., guideline, st<strong>and</strong>ard or directive, is indicated in thesupplemental materials.Literature <strong>review</strong>The <strong>review</strong> was limited to countries recognized by theUnited Nations (UN). The AAQSs (<strong>st<strong>and</strong>ards</strong>) <strong>for</strong> 75countries were acquired, from internet searches, legaldatabases, <strong>and</strong> secondary sources; <strong>of</strong> which 57 were frominternet <strong>and</strong> legal database search engines. Web-basedsearches were limited to in<strong>for</strong>mation from governmentwebsites (e.g., The Ministry <strong>of</strong> Environment), peer<strong>review</strong>edjournals, or reports produced by a governmental,inter<strong>national</strong> or regional organization (e.g., the EuropeanUnion or Food <strong>and</strong> Agriculture Organization). AAQS in 18additional countries were acquired from secondary sources(Maggioria <strong>and</strong> Lopez-Silva 2006; Schwela et al. 2006).SurveyIn<strong>for</strong>mation on <strong>and</strong> the evidence used to establish AAQSsin 24 countries were gathered from respondents to surveyssent to the Ministry <strong>of</strong> Environment in 153 countries throughthe postal service <strong>and</strong> email in September <strong>and</strong> October 2007,<strong>and</strong> May 2008. The contact in<strong>for</strong>mation <strong>of</strong> each agency wasacquired from the Ministry <strong>of</strong> Environment or equivalentwebsite <strong>for</strong> each country, the Clean Air Initiative—AsiaCenter, The National Association <strong>of</strong> Clean Air Agencies, theUnited Nations Environmental Programme, <strong>and</strong> the <strong>Global</strong>Environmental Facility website. A pre-addressed, postagepaidinter<strong>national</strong> business reply envelope was included witheach paper survey. The surveys were sent to self-identifieddeveloping countries, defined here as members <strong>of</strong> the G77(group <strong>of</strong> 77) or G24 (group <strong>of</strong> 24) within the UN, <strong>and</strong>European countries that were not members <strong>of</strong> the EuropeanUnion (EU) in 2007. Although Iraq <strong>and</strong> Afghanistan fulfilledthe inclusion criteria; surveys were not sent to either.Each survey was sent with a cover letter requesting thatthe survey be completed by a representative who wasresponsible <strong>for</strong> drafting or revising their <strong>national</strong> <strong>ambient</strong><strong>air</strong> <strong>quality</strong> <strong>st<strong>and</strong>ards</strong> (see supplemental materials <strong>for</strong> a copy<strong>of</strong> the survey). The exact role <strong>of</strong> the survey respondent inthe AAQS revision process was not confirmed.The 31 question survey covered three broad topics:background in<strong>for</strong>mation on AAQSs; awareness <strong>of</strong> the WHOAQGs <strong>and</strong> their role in determining AAQSs; <strong>and</strong> the <strong>st<strong>and</strong>ards</strong>etting process, specifically the evidence-base used toestablish or revise AAQSs. In some circumstances, agencieswere asked to answer questions based on in<strong>for</strong>mationprojected into the future. For example, if an agency did nothave AAQSs <strong>for</strong> PM, but they were in the process or had plansto establish them, then they were asked to answer a questionsuch as “Who are the participants involved in setting theAAQSs?” based on the type <strong>of</strong> participants that theyexpected to be involved in future st<strong>and</strong>ard setting.ResultsAAQSIn<strong>for</strong>mation regarding the presence or absence <strong>of</strong> <strong>national</strong>daily AAQSs <strong>for</strong> PM 10 <strong>and</strong> SO 2 was found <strong>for</strong> 96 out <strong>of</strong>192 UN member countries (50%). These countries contain5.6 billion people, or 84% <strong>of</strong> the world population. Eighty(83%) <strong>of</strong> the 96, have a 24-h AAQS <strong>for</strong> either PM 10 orSO 2 . Slightly more countries have a 24-h AAQS <strong>for</strong> SO 2(n=76; 79%) than <strong>for</strong> PM 10 (n=69; 72%).The average 24-h AAQS <strong>for</strong> PM 10 <strong>and</strong> SO 2 is 95 μg/m 3(95% confidence interval [CI], 82–108 μg/m 3 , n=68) <strong>and</strong>182 μg/m 3 (95% CI, 158–205 μg/m 3 , n=73). The populationweightedaverage AAQS <strong>for</strong> PM 10 is 98 <strong>and</strong> 155 μg/m 3 <strong>for</strong>SO 2 , respectively. The average 24-h AAQS was establishedor last revised <strong>for</strong> PM 10 in 2004 (95% CI 2003–2005,n=65) <strong>and</strong> SO 2 in 2004 (95% CI 2002–2005, n=64).
Air Qual Atmos HealthTable 1 Individual association between various demographics <strong>and</strong> PM 10 AAQSDemographic a β Confidence interval R 2Energy use per capita (kg <strong>of</strong> oil equivalent, 2007) −35.61** −46.47 to −24.76 0.40Government expenditure (% <strong>of</strong> GDP, 2008) −5.93** −7.88 to −3.97 0.39Health expenditure per capita ($US, 2007) −16.86** −23.19 to −10.53 0.30PM 10 (country level, ug/m, 3 2006) 44.55** 25.44 to 63.66 0.25Population (2008) 7.68* 0.43 to 14.94 0.06a The natural logarithm <strong>of</strong> the following variables was used in order to adjust <strong>for</strong> skewed distributions—health expenditure per capita, energy use per capita,population <strong>and</strong> average annual exposure to PM 10.*p
Air Qual Atmos HealthTable 3 The type <strong>of</strong> evidenceused to set or revise AAQS(n=17)a The Inter<strong>national</strong> Agency <strong>for</strong>Research on Cancer (IARC) is aseparate agency <strong>of</strong> the WHO thatevaluates the carcinogenicity <strong>of</strong> asubstanceType <strong>of</strong> study or secondary evaluation Number <strong>of</strong> countriesPrimary data Air <strong>quality</strong> monitoring data 17Environmental epidemiology 12Occupational epidemiology 5Controlled human exposure studies 3Toxicology studies 3Secondary assessments AAQSs from other Countries 14WHO AQGs 12NGO reports 5IARC a designation 3represent 84% <strong>of</strong> the global population. Most countries(83%) had AAQSs <strong>for</strong> PM 10 or SO 2 at the time <strong>of</strong> thisresearch.There are at least two numeric values <strong>for</strong> each AAQSthat account <strong>for</strong> the majority <strong>of</strong> the AAQSs globally.AAQSs set at 50 <strong>and</strong> 150 μg/m 3 comprise 82% (n=68) <strong>of</strong>the PM 10 AAQS. These coincide with the WHO AQGvalue (50 μg/m 3 ) <strong>and</strong> the US PM 10 NAAQS (150 μg/m 3 ),which has not changed since 1997 (US EPA 2008).St<strong>and</strong>ards set at 125 <strong>and</strong> 365 μg/m 3 represent 64% (n=73) <strong>of</strong> the AAQSs <strong>for</strong> SO 2 —equivalent to the first WHOinterim target (125 μg/m 3 ) <strong>for</strong> SO 2 <strong>and</strong> the US SO 2NAAQS (365 μg/m 3 ). This suggests that the WHO AQGs<strong>and</strong> the US NAAQS have influenced the selection <strong>of</strong>AAQSs in numerous countries.Table 4 Countries that based their AAQS on the AAQSs <strong>of</strong> anothercountry or region (n=14)Existing st<strong>and</strong>ardUS NAAQSEU directivesCARB <strong>st<strong>and</strong>ards</strong>Russia FederationSouth AfricaSingaporeSenegalNigeriaEgyptAsian countries <strong>and</strong>East Asian regionsIndiaAgencies that used theexisting st<strong>and</strong>ard todetermine their own AAQSBrunei Darussalam, Chile,Mexico, Egypt, Philippines,Thail<strong>and</strong>Republic <strong>of</strong> Serbia, Chile,CroatiaSwitzerl<strong>and</strong>, Thail<strong>and</strong>Georgia, ArmeniaLesothoBrunei DarussalamCameroonCameroonCameroonPhilippinesNepalUS NAAQS United States National Ambient Air Quality St<strong>and</strong>ards,EU European Union, CARB Cali<strong>for</strong>nia Air Resources BoardComparison to the WHO AQGsTables 5 <strong>and</strong> 6 provide a summary on the number <strong>of</strong>countries that have AAQGs that have reached each WHOIT <strong>for</strong> PM 10 <strong>and</strong> SO 2 . Most <strong>of</strong> the global population lives ina country that has not implemented an AAQS that meets theWHO AQG target <strong>for</strong> PM 10 (72%) or SO 2 (100%). Theaverage 24-h PM 10 AAQS (95 μg/m 3 ) is slightly lower thenWHO IT-2 (100 μg/m 3 ), out <strong>of</strong> three possible ITs, <strong>and</strong>almost twice the recommended WHO AQG (50 μg/m 3 ).The mean 24-h SO 2 AAQS (182 μg/m 3 ) is well aboveWHO IT-1 (125 μg/m 3 ), out <strong>of</strong> two possible ITs, <strong>and</strong> morethan nine times the WHO AQG (20 μg/m 3 ) (WHO 2006).The population-weighted average AAQS <strong>for</strong> both PM 10 <strong>and</strong>SO 2 is slightly different than the unadjusted averages, butwithin the same WHO IT range. The global average PM 10AAQS is much closer to the AQG value than the averageSO 2 AAQS. This is because the European Union, whichconsisted <strong>of</strong> 27 countries at the time <strong>of</strong> this research,adopted the AQG value <strong>for</strong> PM 10 , but the first interimtarget level (IT-1) <strong>for</strong> SO 2 .Association between AAQS stringency <strong>and</strong> selecteddemographicsAs shown in Table 1, the stringency <strong>of</strong> AAQSs <strong>for</strong> PM 10 ismoderately associated with a number <strong>of</strong> <strong>national</strong> demographicindicators. Energy use, health/government expenditure,<strong>and</strong> country level PM 10 concentration had thestrongest association to PM 10 AAQS stringency. Combiningenergy use <strong>and</strong> PM 10 concentration into one modelyielded slightly better results (R 2 =0.46). Although, the lowR 2 <strong>for</strong> each indicator signifies that the variability in eachcountry’s AAQS is largely attributed to other factors. Thesefindings are line with the survey results, which identified <strong>air</strong><strong>quality</strong> monitoring data, AAQS in other countries, environmentalepidemiology studies, <strong>and</strong> the WHO AQGs as theprimary determinants <strong>of</strong> a countries AAQS. However, since<strong>air</strong> <strong>quality</strong> monitoring data were a main determinant in thesurvey results one might expect country level PM 10 to have
Air Qual Atmos HealthTable 5 Summary <strong>of</strong> PM 10AAQS <strong>and</strong> WHO targets(WHO, 2006)WHO AQGequivalentPM 10 (ug/m 3 )Number <strong>of</strong> countrieswith AAQS in range aMillion peoplecovered (2008)Percent <strong>of</strong> globalpopulation (2008)a Please note that this tableexcludes countries with AAQS,whose values are unknown (n=1)AQG 50 34 1870 28IT-3 51–75 4 86 1IT-2 76–100 3 1270 19IT-1 101–150 25 1700 25>IT-1 >151 2 31 IT-1 >125 28 1640 24No AAQS 18 379 6No data 96 1090 16
Air Qual Atmos Healthguidelines to determine their AAQSs, <strong>and</strong> significantlymore (91%, n=22) <strong>of</strong> the respondents plan on using themost recent publication Air Quality Guidelines: <strong>Global</strong>Update 2005 to set or revise their AAQSs. One <strong>of</strong> the twocountries that did not plan to use the WHO AQGs currentlyhas no AAQSs, <strong>and</strong> has no plans to establish any.Most <strong>of</strong> the agencies that used one <strong>of</strong> the WHO AQGsdocuments to set or revise an AAQS evaluated the evidence inthe document, compared it to their local conditions, <strong>and</strong> thendecided on a st<strong>and</strong>ard. In the case <strong>of</strong> the PM st<strong>and</strong>ard, the morerecent the WHO publication the more likely a country was tomodify the WHO AQG <strong>for</strong> local conditions. This findingsuggests it would be useful <strong>for</strong> the WHO to develop a methodto aid agencies in evaluating how the WHO AQGs compareto country-specific characteristics in their next edition.Limiting factorsThere was a disproportionate lack <strong>of</strong> in<strong>for</strong>mation aboutAfrican, Middle Eastern, <strong>and</strong> Central European countries.Possible explanations <strong>for</strong> this could be a lack <strong>of</strong> actualAAQSs, a deficit in published in<strong>for</strong>mation regardingAAQSs or language barriers—Arabic is difficult to translatewith free online translation services. In addition, <strong>of</strong> course,the survey was printed in English.A visual analysis <strong>of</strong> Figs. 1 <strong>and</strong> 2 indicates that theremight be a spatial correlation in the AAQSs in particularregions. After more data are gathered, particularly in Africa<strong>and</strong> the Middle East, a spatial analysis might be warrantedto test if there is an underlying trend <strong>of</strong> clustering. Untilthen, this <strong>review</strong> has produced a useful reference <strong>of</strong> 24-hPM 10 <strong>and</strong> SO 2 AAQSs <strong>for</strong> policymakers in the developed<strong>and</strong> developing world.ConclusionIn summary, most countries have 24-h AAQSs <strong>for</strong> both PM 10<strong>and</strong> SO 2 . The average AAQS <strong>for</strong> both PM 10 <strong>and</strong> SO 2 issubstantially higher than the WHO AQG value. Severalcountries have promulgated AAQSs at the AQG value <strong>for</strong>PM 10 ,butnotSO 2 . Although AAQSs that pertain to 84% <strong>of</strong>the global population were identified, the global conclusionsare limited by the lack <strong>of</strong> in<strong>for</strong>mation in several regions. In thecountries with data, however, <strong>air</strong> <strong>quality</strong> monitoring data seemto be considered the most frequently when setting <strong>and</strong> revisingAAQS, followed by existing AAQSs in other countries,environmental epidemiology studies, <strong>and</strong> the WHO AQGs.Relevance <strong>of</strong> findingsThese findings, which cover 84% <strong>of</strong> the world population,have provided a set <strong>of</strong> benchmarks <strong>for</strong> evaluating the status<strong>of</strong> AAQSs. These benchmarks can provide policy makerswith a broader perspective, when establishing <strong>and</strong> revisingtheir own AAQSs. Inter<strong>national</strong> organizations, such as theWHO, might also find these benchmarks useful whenrevising the AQGs. The in<strong>for</strong>mation presented in this papercould also be utilized to advance econometric analyses <strong>of</strong><strong>air</strong> <strong>quality</strong> regulations <strong>and</strong> economic <strong>and</strong> social indicators;<strong>and</strong> to promote further research on the implementation <strong>and</strong>en<strong>for</strong>cement <strong>of</strong> AAQSs.Acknowledgments We thank Aaron Cohen <strong>and</strong> Michal Krzyzanowski<strong>for</strong> their guidance, the Brian <strong>and</strong> Jennifer Maxwell Endowed Ch<strong>air</strong> at theSchool <strong>of</strong> Public Health <strong>for</strong> partial funding, <strong>and</strong> Maureen Lahiff <strong>for</strong>statistical support.Open Access This article is distributed under the terms <strong>of</strong> the CreativeCommons Attribution Noncommercial License which permits anynoncommercial use, distribution, <strong>and</strong> reproduction in any medium,provided the original author(s) <strong>and</strong> source are credited.ReferencesArcher G, Davidson RD (1996) In: Williams W (ed) GEMS/AIR: <strong>air</strong><strong>quality</strong> management <strong>and</strong> assessment capabilities in 20 majorcities. Monitoring <strong>and</strong> Assessment Center (MARC), LondonElsom D, Longhurst J (eds) (2004) Regional <strong>and</strong> local aspects <strong>of</strong> <strong>air</strong><strong>quality</strong> management. WIT, SouthamptonInter<strong>national</strong> Union <strong>of</strong> Air Pollution Prevention Associations (1991) In:Murley L (ed) Clean <strong>air</strong> around the world: <strong>national</strong> <strong>and</strong> inter<strong>national</strong>approaches to <strong>air</strong> pollution control, 2nd edn. Inter<strong>national</strong> Union <strong>of</strong>Air Pollution Prevention Associations, BrightonKrzyzanowski M, Cohen A (2008) Update <strong>of</strong> WHO <strong>air</strong> <strong>quality</strong>guidelines. Air Qual Atmos Health 1:7–13Maggioria CD, Lopez-Silva JA (2006) Vulnerability to Air Pollutionin Latin America <strong>and</strong> the Caribbean Region. Latin America <strong>and</strong>Caribbean Region Sustainable Development Working Paper 28.The World BankSchwela D, Haq G, Huizenga C, Wha-Jin H, Fabian H, Ajero M(2006) Urban <strong>air</strong> pollution in Asian cities: status, challenges, <strong>and</strong>management. Earthscan, LondonUS EPA (2008) PM St<strong>and</strong>ards Revision—2006. Available at: www.epa.gov. Accessed on Dec 2008WHO (1987) Air <strong>quality</strong> guidelines <strong>for</strong> Europe. European series no.23. WHO Regional Publications, CopenhagenWHO (2000a) Air <strong>quality</strong> guidelines <strong>for</strong> Europe: 2nd ed, in Europeanseries, No. 91. WHO Regional Publications, CopenhagenWHO (2000b) Guidelines <strong>for</strong> <strong>air</strong> <strong>quality</strong>. World Health Organization,GenevaWHO (2006) Air <strong>quality</strong> guidelines: global update 2005. WHORegional Office <strong>for</strong> Europe, Copenhagen
Vahlsing/Smith MS AIRQ‐186Supplementary material <strong>for</strong> Vahlsing/SmithA. Comparison <strong>of</strong> Survey Respondents <strong>and</strong> Non-RespondentsThe geographical distribution <strong>and</strong> selected demographics <strong>of</strong> the survey respondents <strong>and</strong> non-respondents are summarized in Table 1<strong>and</strong> 2.Table 1: Number <strong>of</strong> respondents & Non – respondents in each Geographical RegionRegionRespondents Non – Respondents TotalAsia 10 22 32Africa 6 43 49Central Europe 3 13 16South America 2 30 32Middle East 1 16 17North America 1 0 1Western Europe 1 2 3Sc<strong>and</strong>inavia 0 3 3Total 24 129 153Asian countries represented the largest percent <strong>of</strong> the respondents (40 %), followed by African countries (25 %), Central Europeancountries (12 %) <strong>and</strong> South American countries (8 %). The remaining 8 % <strong>of</strong> the respondents were from the Middle East, NorthAmerica, <strong>and</strong> Western Europe. A statistical significant difference between medians was not observed between respondents <strong>and</strong> thenon-respondents <strong>for</strong> any <strong>of</strong> the variables shown in Table 2.Table 2: Selected Median <strong>of</strong> Demographics <strong>for</strong> Survey Respondents & Non – RespondentsDemographicMedianRespondents(n = 24)Non – Respondents(n = 129)Population (2008) 1,000,000 6,200,000Urban Population (% <strong>of</strong> Total, 2008) 53 49GDP per capita (current $US, 2008) 3,400 2,800Health expenditure per capita 130 1501
Vahlsing/Smith MS AIRQ‐186(current US$ 2007)Energy Use(kg <strong>of</strong> oil equivalent per capita, 2007)<strong>PM10</strong>(population weighted ug/m3 2006)SO2 Emissions(thous<strong>and</strong> metric tons 2000)General Government Final Consumption Expenditure(% <strong>of</strong> GDP, 2008)DALYS(attributed to urban <strong>air</strong> pollution, 2009)*statistical significance difference (p>0.05) between respondent <strong>and</strong> non – respondentsGDP(Gross Domestic Product), DALYs (Disability Adjusted Life Years)Source – World Bank, World Development Indicators, 2010850 91051 3796 5914 131,000,000 930,000B. Ambient Air Quality St<strong>and</strong>ards & Selected DemographicsAAQSPollutant(ug/m3)Year 2 AAQSSet or RevisedCountry Name(Source <strong>of</strong> AAQS 1 ) <strong>PM10</strong> SO2 <strong>PM10</strong> SO2Population 3(2008)Urban population 4(% <strong>of</strong> total, 2008)GDP/capita 5(current US$, 2008)Healthexpenditure/capita 6(current US$, 2006)Energy use 7(kg <strong>of</strong> oilequalent/capita, 2007)<strong>PM10</strong> 8(ug/m3, 2007)General governmentfinal consumptionexpenditure 9(% <strong>of</strong> GDP, 2008)Type <strong>of</strong> AAQS**Algeria(Kerbachi, 2006)0 0 2007 2007 34,373,426 65 4,845 173 1,089 71 131 Secondary sources are listed. If no source is provided the AAQS data came from the survey results discussed in this paper.2 The most recent year each AAQS was revised or the year the AAQS was set, if has not been revised. For example, the AAQS or limit values in the EU were lastconsidered <strong>for</strong> revision in 2008, despite the fact that they did not change from 1999 limit values set in 1999. If the country does not have AAQS then this is thedate the most recent document was published stating that there are no AAQS.3 Source: World Bank, World Development Indicators, 2010, www.worldbank.org4 Source: World Bank, World Development Indicators, 2010, www.worldbank.org5 Source: World Bank, World Development Indicators, 2010, www.worldbank.org6 Source: World Bank, World Development Indicators, 2010, www.worldbank.org2
Vahlsing/Smith MS AIRQ‐186AAQSPollutant(ug/m3)Year 2 AAQSSet or RevisedCountry Name(Source <strong>of</strong> AAQS 1 ) <strong>PM10</strong> SO2 <strong>PM10</strong> SO2Population 3(2008)Urban population 4(% <strong>of</strong> total, 2008)GDP/capita 5(current US$, 2008)Healthexpenditure/capita 6(current US$, 2006)Energy use 7(kg <strong>of</strong> oilequalent/capita, 2007)<strong>PM10</strong> 8(ug/m3, 2007)General governmentfinal consumptionexpenditure 9(% <strong>of</strong> GDP, 2008)Type <strong>of</strong> AAQS**Antigua & Barbuda 10(Blacklane, 2011)0 0 2007 2007 86,634 30 14,048 627 12 18Argentina(Maggioria, 2006)Armenia(survey respondent)Australia(Aus. Gov., 1998)500 70 2006 39,882,980 92 8,236 663 1,850 73 130 yes 11 2007 2004 3,077,087 64 3,873 133 926 59 12209(0.08ppm)1998 1998 21,431,800 89 47,370 3,986 5,888 15 1Austria(Council <strong>of</strong> EU, 2008)50 125 2008 2008 8,336,926 67 49,599 4,523 3,997 33 18 D7 Source: World Bank, World Development Indicators, 2010, www.worldbank.org8 Particulate matter concentrations refer to fine suspended particulates less than 10 microns in diameter (<strong>PM10</strong>) that are capable <strong>of</strong> penetrating deep into therespiratory tract <strong>and</strong> causing significant health damage. Data <strong>for</strong> countries <strong>and</strong> aggregates <strong>for</strong> regions <strong>and</strong> income groups are urban-population weighted <strong>PM10</strong>levels in residential areas <strong>of</strong> cities with more than 100,000 residents. The estimates represent the average annual exposure level <strong>of</strong> the average urban resident tooutdoor particulate matter. The state <strong>of</strong> a country's technology <strong>and</strong> pollution controls is an important determinant <strong>of</strong> particulate matter concentrations (Source:World Bank, World Development Indicators, 2010, www.worldbank.org).9 General government final consumption expenditure (<strong>for</strong>merly general government consumption) includes all government current expenditures <strong>for</strong> purchases <strong>of</strong>goods <strong>and</strong> services (including compensation <strong>of</strong> employees). It also includes most expenditure on <strong>national</strong> defense <strong>and</strong> security, but excludes government militaryexpenditures that are part <strong>of</strong> government capital <strong>for</strong>mation. Source: World Bank, World Development Indicators, 2010, www.worldbank.org10 Although Antigua <strong>and</strong> Barbuda have no AAQS they use the WHO AQG when necessary11 If the survey respondent indicated that their country had AAQS <strong>for</strong> pollutant, but did not specify what the AAQS it was assumed that the country had the leaststringent AAQS on the map, but the country was not included in average AAQA calculation.3
Vahlsing/Smith MS AIRQ‐186AAQSPollutant(ug/m3)Year 2 AAQSSet or RevisedCountry Name(Source <strong>of</strong> AAQS 1 ) <strong>PM10</strong> SO2 <strong>PM10</strong> SO2Population 3(2008)Urban population 4(% <strong>of</strong> total, 2008)GDP/capita 5(current US$, 2008)Healthexpenditure/capita 6(current US$, 2006)Energy use 7(kg <strong>of</strong> oilequalent/capita, 2007)<strong>PM10</strong> 8(ug/m3, 2007)General governmentfinal consumptionexpenditure 9(% <strong>of</strong> GDP, 2008)Type <strong>of</strong> AAQS**The Bahamas 12(Min, <strong>of</strong> Environment,2006))Bangladesh(Govt. Bangladesh, 2005)Barbados(EPD, 2004)Belarus(WHO, 2003)Belgium(Council <strong>of</strong> EU, 2008)Belize 13(Law Rev. Com. 2003)Benin(Min de l'Habitat, 2003)Bolivia(Maggioria, 2006)Botswana(survey respondent)Brazil*(Maggioria, 2006)Brunei Darussalam*(survey respondent)Bulgaria(Council <strong>of</strong> EU, 2008)0 0 2008 2008 337,668 84 1,535150 365 2005 2005 160,000,128 27 497 15 163 135 5 S150 2004 255,203 40 14,426 932 40 S0 200 9,680,850 73 6,230 302 2,891 6 17 M50 125 2008 2008 10,708,433 97 47,085 4,056 5,366 22 23 D0 80 2003 2003 322,100 52 4,218 174 15 16 S0 0 2003 2003 8,662,086 41 771 32 343 46150 365 1992 1992 9,694,113 66 1,720 69 571 94 13 S0 300 2008 2001 1,921,122 60 6,982 372 1,068 67 20 S150 365 1990 1990 191,971,506 86 8,205 606 1,239 23 20 SYes 0 2007 2007 392,280 75 753 7,190 54 S50 125 2008 2008 7,623,395 71 6,546 384 2,641 57 16 D12 The Bahamas has drafted AAQS (The Environmental Planning <strong>and</strong> Protection Act <strong>of</strong> 2005. Pollution Control <strong>and</strong> Waste Management Regulations(preliminary draft May 18, 2005), but they have not been adopted.13 Residential <strong>and</strong> rural SO 2 AAQS. The industrial <strong>and</strong> mixed use SO 2 AAQS is 120 ug/m 3 <strong>and</strong> the sensitive AAQS is 30 ug/m 3 .4
Vahlsing/Smith MS AIRQ‐186AAQSPollutant(ug/m3)Year 2 AAQSSet or RevisedCountry Name(Source <strong>of</strong> AAQS 1 ) <strong>PM10</strong> SO2 <strong>PM10</strong> SO2Population 3(2008)Urban population 4(% <strong>of</strong> total, 2008)GDP/capita 5(current US$, 2008)Healthexpenditure/capita 6(current US$, 2006)Energy use 7(kg <strong>of</strong> oilequalent/capita, 2007)<strong>PM10</strong> 8(ug/m3, 2007)General governmentfinal consumptionexpenditure 9(% <strong>of</strong> GDP, 2008)Type <strong>of</strong> AAQS**Cameroon(survey respondent)Canada 14(Health Canada, 2006)Chile(survey respondent)China(personal communication)Colombia(Maggioria, 2006)Costa Rica(Maggioria, 2006)Croatia(survey respondent)Cyprus(Council <strong>of</strong> EU, 2008)Czech Republic(Council <strong>of</strong> EU, 2008)Denmark(Council <strong>of</strong> EU, 2008)Dominican Republic(Maggioria, 2006)Ecuador(Maggioria, 2006)260 125 2007 2007 19,088,385 57 1,226 54 391 62 S0301(115ppb)2008 1998 33,311,400 80 45,070 4,409 8,169 17150 250 2001 16,803,952 88 10,084 615 1,851 48 12 S50 50 2000 2000 1,324,655,000 43 3,267 108 1,484 73 14 S150 250 2006 2006 45,012,096 75 5,416 284 655 22 16 S150 365 2002 2002 4,519,126 63 6,564 488 1,070 36 1450 125 2004 2004 4,434,000 57 15,637 1,009 2,101 30 19 S50 125 2008 2008 862,434 70 31,410 1,778 2,854 44 19 D50 125 2008 2008 10,424,336 74 20,673 1,141 4,428 21 20 D50 125 2008 2008 5,493,621 87 62,118 5,551 3,598 19 27 D150 150 2002 2002 9,952,711 69 4,576 224 804 20 8 S150 350 2003 2003 13,481,424 66 4,056 200 885 25 1114 The maximum acceptable level was used in this research. The maximumtolerable level is 306 ppb.5
Vahlsing/Smith MS AIRQ‐186AAQSPollutant(ug/m3)Year 2 AAQSSet or RevisedCountry Name(Source <strong>of</strong> AAQS 1 ) <strong>PM10</strong> SO2 <strong>PM10</strong> SO2Population 3(2008)Urban population 4(% <strong>of</strong> total, 2008)GDP/capita 5(current US$, 2008)Healthexpenditure/capita 6(current US$, 2006)Energy use 7(kg <strong>of</strong> oilequalent/capita, 2007)<strong>PM10</strong> 8(ug/m3, 2007)General governmentfinal consumptionexpenditure 9(% <strong>of</strong> GDP, 2008)Type <strong>of</strong> AAQS**Egypt(survey respondent)El Salvador(Maggioria, 2006)Estonia(Council <strong>of</strong> EU, 2008)Ethiopia(Etyemezian V, 2005)Finl<strong>and</strong>(Council <strong>of</strong> EU, 2008)France(Council <strong>of</strong> EU, 2008)The Gambia(Sarr, 2008)Georgia(survey respondent)Germany(Council <strong>of</strong> EU, 2008)Ghana(survey respondent)Greece(Council <strong>of</strong> EU, 2008)Grenada(survey respondent)Guatemala(Maggioria, 2006)Honduras(Maggioria, 2006)150 150 2005 81,527,172 43 1,991 101 840 119 11 S150 365 2003 2003 6,133,910 61 3,605 206 800 33 9 S50 125 2008 2008 1,340,675 69 17,454 837 4,198 13 19 D150365(0.14ppm)2003 2003 80,713,434 17 317 9 290 68 10 G50 125 2008 2008 5,313,399 63 51,323 3,809 6,895 18 22 D50 125 2008 2008 62,277,432 77 44,508 4,627 4,258 13 23 D50 125 1999 1999 1,660,200 56 489 22 86 160 yes 2007 2003 4,307,011 53 2,970 191 767 47 14 S50 125 2008 2008 82,110,097 74 44,446 4,209 4,027 19 18 D70 100 2000 2000 23,350,927 50 713 54 415 34 20 G50 125 2008 2008 11,237,094 61 31,670 2,679 2,875 36 17 D0 0 2007 2007 103,538 31 6,162 416 20 160 0 2006 2006 13,686,128 49 2,848 186 620 62 90 0 2006 2006 7,318,789 48 1,823 107 661 43 166
Vahlsing/Smith MS AIRQ‐186AAQSPollutant(ug/m3)Year 2 AAQSSet or RevisedCountry Name(Source <strong>of</strong> AAQS 1 ) <strong>PM10</strong> SO2 <strong>PM10</strong> SO2Population 3(2008)Urban population 4(% <strong>of</strong> total, 2008)GDP/capita 5(current US$, 2008)Healthexpenditure/capita 6(current US$, 2006)Energy use 7(kg <strong>of</strong> oilequalent/capita, 2007)<strong>PM10</strong> 8(ug/m3, 2007)General governmentfinal consumptionexpenditure 9(% <strong>of</strong> GDP, 2008)Type <strong>of</strong> AAQS**Hungary(Council <strong>of</strong> EU, 2008)India(Govt. <strong>of</strong> India, 2009)Indonesia(Govt. <strong>of</strong> Indonesia, 1999)Irel<strong>and</strong>(Council <strong>of</strong> EU, 2008)Israel 15 i(Govt. <strong>of</strong> Israel, 1992)Italy(Council <strong>of</strong> EU, 2008)Jamaica(Claude Davis, 2006)Japan(Schwela, 2006)Kenya 16(Govt. <strong>of</strong> Kenya, 2009)50 125 2008 2008 10,038,188 68 15,408 1,019 2,658 19 9 D100 80 2009 2009 1,139,964,932 30 1,017 40 529 65 12 S150 365 1999 1999 227,345,082 51 2,246 42 849 83 8 S50 125 2008 2008 4,425,675 61 60,460 4,556 3,457 16 D150 280 1992 1992 7,308,800 92 27,652 1,893 3,059 31 2550 125 2008 2008 59,832,179 68 38,492 3,136 3,001 27 20 D150 365 2006 2006 2,687,200 53 5,438 224 1,852 43 S100 105 127,704,000 66 38,455 2,751 4,019 30 S0 0 2004 2004 38,765,312 22 783 34 485 36 1715 PM 10 is defined as respirable particulate matter.16 Draft AAQS were promulgated. See reference.7
Vahlsing/Smith MS AIRQ‐186AAQSPollutant(ug/m3)Year 2 AAQSSet or RevisedCountry Name(Source <strong>of</strong> AAQS 1 ) <strong>PM10</strong> SO2 <strong>PM10</strong> SO2Population 3(2008)Urban population 4(% <strong>of</strong> total, 2008)GDP/capita 5(current US$, 2008)Healthexpenditure/capita 6(current US$, 2006)Energy use 7(kg <strong>of</strong> oilequalent/capita, 2007)<strong>PM10</strong> 8(ug/m3, 2007)General governmentfinal consumptionexpenditure 9(% <strong>of</strong> GDP, 2008)Type <strong>of</strong> AAQS**Korea, Rep.(Schwela, 2006)Latvia(Council <strong>of</strong> EU, 2008)Lesotho(survey respondent)Lithuania(Council <strong>of</strong> EU, 2008)Luxembourg(Council <strong>of</strong> EU, 2008)Malta(Council <strong>of</strong> EU, 2008)Mauritius(survey respondent)Mexico(SEMARNAT, 2005)(Min. <strong>of</strong> Health., 1993)Moldova(Cojocaru, 2008)Myanmar(survey respondent)Nepal(survey respondent; Sah,2003)Netherl<strong>and</strong>s(Council <strong>of</strong> EU, 2008)New Zeal<strong>and</strong>(Min. <strong>for</strong> the Envir, 2004)Nicaragua(Maggioria, 2006)150 48,607,000 81 19,115 1,362 4,586 35 15 S50 125 2008 2008 2,266,094 68 14,908 784 2,052 16 20 D0 0 2007 2007 2,049,429 25 791 51 41 2750 125 2008 2008 3,358,115 67 14,098 717 2,740 19 18 D50 125 2008 2008 488,650 82 109,903 7,439 8,790 15 16 D50 125 2008 2008 411,950 94 1,362 2,120 D100 200 1997 1997 1,268,854 42 7,345 247 18 13 S120 341 2005 1994 106,350,434 77 10,232 564 1,750 36 10 S0 50 2008 3,633,369 42 1,694 127 910 36 21 M0 0 2007 2007 49,563,019 33 7 319 58120 70 2003 2003 28,809,526 17 438 20 338 34 10 S50 125 2008 2008 16,445,593 82 52,963 4,243 4,909 34 25 D50 0 2004 2004 4,268,900 87 30,439 2,790 3,966 140 0 2006 2006 5,667,325 57 1,163 92 621 288
Vahlsing/Smith MS AIRQ‐186AAQSPollutant(ug/m3)Year 2 AAQSSet or RevisedCountry Name(Source <strong>of</strong> AAQS 1 ) <strong>PM10</strong> SO2 <strong>PM10</strong> SO2Population 3(2008)Urban population 4(% <strong>of</strong> total, 2008)GDP/capita 5(current US$, 2008)Healthexpenditure/capita 6(current US$, 2006)Energy use 7(kg <strong>of</strong> oilequalent/capita, 2007)<strong>PM10</strong> 8(ug/m3, 2007)General governmentfinal consumptionexpenditure 9(% <strong>of</strong> GDP, 2008)Type <strong>of</strong> AAQS**Pakistan(survey respondent)Panama(Maggioria, 2006)Peru(Maggioria, 2006)Philippines(survey respondent)Pol<strong>and</strong>(Council <strong>of</strong> EU, 2008)Portugal(Council <strong>of</strong> EU, 2008)Romania(Council <strong>of</strong> EU, 2008)Russian Federation(Sakhalin Energy, 2005)Senegal(Govt. <strong>of</strong> Senegal, 2003)Seychelles(survey respondent)Singapore(Schwela, 2006)Slovak Republic(Council <strong>of</strong> EU, 2008)Slovenia(Council <strong>of</strong> EU, 2008)South Africa(Rep. <strong>of</strong> South Africa,2006)0 0 2007 2007 166,111,487 36 991 23 512 120 120 0 2006 2006 3,398,823 73 6,793 396 845 35 11150 365 2001 2001 28,836,700 71 4,477 160 494 54 9150 180 1999 1999 90,348,437 65 1,847 63 451 23 10 G50 125 2008 2008 38,125,759 61 13,845 716 2,547 37 19 D50 125 2008 2008 10,622,413 59 22,923 2,108 2,363 23 21 D50 125 2008 2008 21,513,622 54 9,300 369 1,806 14 16 D0 50 2008 141,950,000 73 11,832 493 4,730 18 17 M260 125 2003 2003 12,211,181 42 1,087 54 225 95 10 S0 0 2007 2007 86,956 54 9,580 564 15150 365 4,839,400 100 37,597 1,148 5,831 41 1150 125 2008 2008 5,406,626 57 18,212 1,077 3,307 15 17 D50 125 2008 2008 2,021,316 49 27,019 1,836 3,632 30 D75 125 2007 2004 48,687,000 61 5,678 497 2,807 21 20 G9
Vahlsing/Smith MS AIRQ‐186AAQSPollutant(ug/m3)Year 2 AAQSSet or RevisedCountry Name(Source <strong>of</strong> AAQS 1 ) <strong>PM10</strong> SO2 <strong>PM10</strong> SO2Population 3(2008)Urban population 4(% <strong>of</strong> total, 2008)GDP/capita 5(current US$, 2008)Healthexpenditure/capita 6(current US$, 2006)Energy use 7(kg <strong>of</strong> oilequalent/capita, 2007)<strong>PM10</strong> 8(ug/m3, 2007)General governmentfinal consumptionexpenditure 9(% <strong>of</strong> GDP, 2008)Type <strong>of</strong> AAQS**Spain(Council <strong>of</strong> EU, 2008)Sri Lanka(survey respondent)Sweden(Council <strong>of</strong> EU, 2008)Switzerl<strong>and</strong>(survey respondent)Thail<strong>and</strong>(survey respondent)Trinidad & Tobago(Rep. <strong>of</strong> Trinidad <strong>and</strong>Tobago, 2005; emailcommunication, 2008)Turkey(Rep. <strong>of</strong> Turkey, 1986)Ug<strong>and</strong>a(Personal comm., 2003)United Kingdom(Council <strong>of</strong> EU, 2008)United States(EPA, 2009)Venezuela(Maggioria, 2006)Vietnam(Schwela, 2006)Serbia(survey respondent)Zambia(Govt. <strong>of</strong> Zambia, 1996)50 125 2008 2008 45,555,716 77 35,215 2,712 3,208 32 19 D0 Yes 2007 2003 20,156,204 15 2,013 68 464 82 16 S50 125 2008 2008 9,219,637 85 51,950 4,495 5,512 12 26 D50 80 2007 7,647,675 73 64,327 6,108 3,406 26 S120 300 1995 2001 67,386,383 33 4,043 136 1,553 71 12 S75 125 2008 2008 1,333,388 13 18,108 785 11,506 101 11 G150 150 1986 1986 73,914,260 69 9,942 465 1,370 40 130 0 2003 2003 31,656,865 13 453 28 12 1250 125 2008 2008 61,414,062 90 43,541 3,867 3,464 15 22 D150 365 2006 1996 304,060,000 82 46,350 7,285 7,766 21 S0 365 2006 1995 27,935,000 93 11,246 477 2,319 11 11150 125 2005 2005 86,210,781 28 1,051 58 655 55 650 150 2000 2000 7,350,221 52 6,811 408 2,141 2170 125 1996 1996 12,620,219 35 1,134 57 604 40 9 G10
Vahlsing/Smith MS AIRQ‐186AAQSPollutant(ug/m3)Year 2 AAQSSet or RevisedCountry Name(Source <strong>of</strong> AAQS 1 ) <strong>PM10</strong> SO2 <strong>PM10</strong> SO2Population 3(2008)Urban population 4(% <strong>of</strong> total, 2008)GDP/capita 5(current US$, 2008)Healthexpenditure/capita 6(current US$, 2006)Energy use 7(kg <strong>of</strong> oilequalent/capita, 2007)<strong>PM10</strong> 8(ug/m3, 2007)General governmentfinal consumptionexpenditure 9(% <strong>of</strong> GDP, 2008)Type <strong>of</strong> AAQS**Zimbabwe(Govt. <strong>of</strong> Zimbabwe,2006)World(WHO, 2006)0 0 2005 2005 12,462,879 37 79 759 2750 20 2005 2005 6,697,254,041 50 9,042 809 1,819 50 G*Sub-<strong>national</strong> AQS** S = <strong>ambient</strong> <strong>air</strong> <strong>quality</strong> st<strong>and</strong>ard, G = <strong>ambient</strong> <strong>air</strong> <strong>quality</strong> guideline, M = maximum permissible concentration, D = EU <strong>air</strong> <strong>quality</strong> directive, blank valuesindicate the type <strong>of</strong> AAQS is unknownReferences:Australian Government (1998) Air Quality: Ambient Air Quality St<strong>and</strong>ards. Department <strong>of</strong> the Environment, Water, Heritage <strong>and</strong> theArts. http://www.environment.gov.au/atmosphere/<strong>air</strong><strong>quality</strong>/<strong>st<strong>and</strong>ards</strong>.html#<strong>air</strong>. Accessed 3 December 2009Blacklane (2011) Personal communication with the Chief Environmental Officer <strong>of</strong> the Environment Division. Ministry <strong>of</strong>Agriculture. Antigua <strong>and</strong> Barbuda.Claude Davis & Associates. (2006) Natural Resources Conservation Authority Ambient Air Quality Guideline Document Hamilton,ON.Cojocaru A (2008) Air Pollution in the Republic <strong>of</strong> Moldova: Current Status <strong>and</strong> Future Prospects in Simulation <strong>and</strong> Assessment <strong>of</strong>Chemical Processes in a Multiphase Environment eds. Barnes I & Kharytonov M.M., Springer Netherl<strong>and</strong>s, DordrechtCouncil <strong>of</strong> the European Union (2008) DIRECTIVE 2008/50/EC OF THE EUROPEAN PARLIAMENT AND OF THE COUNCIL <strong>of</strong>21 May 2008on <strong>ambient</strong> <strong>air</strong> <strong>quality</strong> <strong>and</strong> cleaner <strong>air</strong> <strong>for</strong> Europe. Official Journal <strong>of</strong> the European Communities. http://eurlex.europa.eu/LexUriServ/LexUriServ.do?uri=OJ:L:2008:152:0001:0044:EN:PDF.Accessed on 4 December 200911
Vahlsing/Smith MS AIRQ‐186Environmental Protection Agency (EPA). (2009) National Ambient Air Quality St<strong>and</strong>ards. Air <strong>and</strong> Radiationhttp://www.epa.gov/<strong>air</strong>/criteria.html. Accessed 20 December 2009Environmental Protection Department (2004) Ambient Air Quality. Ministry <strong>of</strong> the Environment, Water Resources <strong>and</strong> Drainage -Government <strong>of</strong> Barbados http://www.epd.gov.bb/articles.cfm?articlecategory=13&category=1. Accessed 4 December 2009Etyemezian V, Tesfaye M, Yimer A, Chow JC, Mesfin D, Nega T, Nikolich G, Watson JG, Wondmagegn M (2005) Results from apilot-scale <strong>air</strong> <strong>quality</strong> study in Addis Ababa, Ethiopia. Atmos Environ 39:7849–7860Government <strong>of</strong> the Peoples Republic <strong>of</strong> Bangladesh, Ministry <strong>of</strong> Environment <strong>and</strong> Forests (2005) S.R.O. No: 220-Law/2005:Schedule-2 Air Quality St<strong>and</strong>ards (Un<strong>of</strong>ficial English Version). Clean Air Initiative - Asiahttp://www.clean<strong>air</strong>net.org/caiasia/1412/articles-69642_<strong>st<strong>and</strong>ards</strong>.doc. Accessed 4 December 2009Government <strong>of</strong> India, Central Pollution Control Board (2009) Ministry <strong>of</strong> Environment <strong>and</strong> Forests Notification: National AmbientAir Quality St<strong>and</strong>ards. The Gazette <strong>of</strong> India: Extraordinary http://www.cpcb.nic.in/upload/Latest/Latest_49_MoEF_Notification.pdf.Accessed 6 December 2009Government <strong>of</strong> Indonesia, Ministry <strong>of</strong> the Environment. (1999) Peraturan Pemerintah No. 41 Tahun 1999, tentang PengendalianPencemaran Udara, BPLHD JAWA BARAT Baden Pengeloaan Lingkungan Hiduphttp://www.bplhdjabar.go.id/index.php/component/docman/cat_view/86-perundang-undangan. Access 6 December 2009מפגעי למניעת תקנות ם (ב"התשנ ,(אויר איכות -1992 (1992) Israel Government <strong>of</strong>Government <strong>of</strong> Kenya (2009) Highlights on Draft Air Quality Regulations, 2008. National Environmental Management Authority.http://www.nema.go.ke/index.php?option=com_content&task=view&id=52&Itemid=60 Accessed 29 December 2009Government <strong>of</strong> Senegal (2003) Pollution atmosphérique - Norme de rejets NS-05-062. Edité et diffusé par l’Association Sénégalaisede Normalisation (ASN), DakarGovernment <strong>of</strong> Zambia (1996) The Air Pollution Control (Licencing <strong>and</strong> Emissions St<strong>and</strong>ards) Regulations, 1996. EnvironmentalCouncil <strong>of</strong> Zambia http://www.necz.org.zm/cap204/Regulations/<strong>air</strong>.html. Accessed 20 December 2009Government <strong>of</strong> Zimbabwe (2006) Environmental Management Act [Chapter 20:27]. Veritas Trust12
Vahlsing/Smith MS AIRQ‐186Health Canada (2006) Regulations Related to Health <strong>and</strong> Air Quality. Environmental <strong>and</strong> Workplace Health. http://www.hcsc.gc.ca/ewh-semt/<strong>air</strong>/out-ext/reg-eng.php#a2.Accessed 5 December 2009Kerbachi R, Boughedaoui M, Bounoua L, Keddam M (2006) Ambient <strong>air</strong> pollution by aromatic hydrocarbons in Algiers. AtmosEnviron 40(21): 3995-4003Ministry <strong>of</strong> Environment (2006) Statement by Senator the Honourable Dr. Marcus Bethel, Minister <strong>of</strong> Energy <strong>and</strong> the Environment <strong>of</strong>the Commonwealth <strong>of</strong> the Bahamas at the High-Level Segment <strong>of</strong> the Fourteenth Session <strong>of</strong> the Commission on SustainableDevelopment. United Nations, New York. . http://www.un.org/esa/sustdev/csd/csd14/statements/bahamas_11may.pdf Accessed on 4December 2009Law Revision Commissioner (2003) Environmental Protection Act Chapter 328: Revised Edition 2003. Government <strong>of</strong> Belize,BelmopanMaggioria CD, Lopez – Silva JA (2006) Vulnerability to Air Pollution in Latin America <strong>and</strong> the Caribbean Region. Latin America <strong>and</strong>Caribbean Region Sustainable Development Working Paper 28. The World BankMinistry <strong>for</strong> the Environment (2004) 5 Air Quality Criteria: National Ambient Air Quality St<strong>and</strong>ards.http://www.mfe.govt.nz/publications/<strong>air</strong>/assessing-discharges-l<strong>and</strong>-transport-jun08/html/page6.html. Accessed 8 December 2009Ministre de l'Habitat, de l'Urbanisme et de l'Aménagement de l'Espace. (2003) Dahir n° 1-03-61 du 10 rabii I 1424 (12 mai 2003)portant promulgation de la loi n° 13-03 relative à la lutte contre la pollution de l'<strong>air</strong>. Bulletin <strong>of</strong>ficielhttp://www.mhuae.gov.ma/NR/exeres/66386A00-F8F8-4E43-9E0B-538F28E56102.htm . Accessed 4 December 2009Ministry <strong>of</strong> Health. (1993) NORMA OFICIAL MEXICANA NOM-022-SSA1-1993. "SALUD AMBIENTAL. CRITERIO PARAEVALUAR LA CALIDAD DEL AIRE AMBIENTE, CON RESPECTO AL BIOXIDO DE AZUFRE (SO 2 ). VALOR NORMADOPARA LA CONCENTRACION DE BIOXIDO DE AZUFRE (SO 2 ) EN EL AIRE AMBIENTE, COMO MEDIDA DEPROTECCION A LA SALUD DE LA POBLACION". Diario Oficial de la Federación, México, D.F., a 18 de agosto de 1994Republic <strong>of</strong> South Africa (2006) The National Air Quality Management Programme (NAQMP) Output C.4 Initial Sate <strong>of</strong> Air Report.Department <strong>of</strong> Environmental Aff<strong>air</strong>s <strong>and</strong> Tourism. http://soer.deat.gov.za/frontpage.aspx?m=2. Accessed 9 March 2008.13
Vahlsing/Smith MS AIRQ‐186Republic <strong>of</strong> Trinidad <strong>and</strong> Tobago (2005) The Air Pollution Rules, 2005. Legal Notice No.Republic <strong>of</strong> Turkey (1986) HAVA KALİTESİNİN KORUNMASI YÖNETMELİĞİ. Resmi Gazete : 02.11.1986 tarih ve 19269 sayıSah RA (2003) Advocating <strong>and</strong> En<strong>for</strong>cing Air-Quality St<strong>and</strong>ards in Nepal. Better Air Quality 2003 Conference.http://www.clean<strong>air</strong>net.org/baq2003/1496/articles-58046_resource_1.pdf. Accessed 8 December 2009Sakhalin Energy. (2005) Environmental Impact Assessment Addendum (2005) Sakhalin Energy Investment Company 0000-S-90-04-P-7069-00-E http://www.sakhalinenergy.com/en/documents/doc_lender_eia_9.pdf. Accessed 18 December 2009.Sarr MB (2008) Sulphur Oxide <strong>and</strong> Its Environmental Impacts. National Consultative Workshop on Sulphur Reduction in Diesel Fuelhttp://www.unep.org/pcfv/PDF/Gambia-SulphurEnvironImpacts.pdf. Accessed 5 December 2009Schwela D, Haq G, Huizenga C, Wha – Jin H, Fabian H, Ajero M (2006) Urban Air Pollution in Asian Cities: Status, Challenges, <strong>and</strong>Management. Earthscan, LondonSEMARNAT (2005) MODIFICACION A LA NORMA OFICIAL MEXICANA NOM-025-SSA1-1993, SALUD AMBIENTAL.CRITERIOS PARA EVALUAR LA CALIDAD DEL AIRE AMBIENTE, CON RESPECTO A MATERIAL PARTICULADO.VALOR DE CONCENTRACION MAXIMA DE MATERIALPARTICULADO PARA PARTICULAS SUSPENDIDAS TOTALES PST, PARTICULAS MENORES DE 10 MICROMETROSPM 10 Y PARTICULAS MENORES DE 2.5 MICROMETROS PM 2.5 EN EL AIRE AMBIENTE COMO MEDIDA DEPROTECCION A LA SALUD DE LA POBLACION, PARA QUEDAR COMO NORMA OFICIAL MEXICANA NOM-025-SSA1-1993, SALUD AMBIENTAL.http://www.semarnat.gob.mx/leyesynormas/Normas%20Oficiales%20Mexicanas%20vigentes/NOM_001_RECNAT.pdf . Accessed 8December 2009WHO (2003) Air Quality <strong>and</strong> Health in Eastern Europe, Caucasus <strong>and</strong> Central Asia. Report on the WHO WorkshopSt. Petersburg.WHO (2006) Air Quality Guidelines: <strong>Global</strong> Update 2005. WHO Regional Office <strong>for</strong> Europe, Copenhagen14
Vahlsing/Smith MS AIRQ‐18615
Vahlsing/Smith MS AIRQ‐186AAQS Survey16
Vahlsing/Smith MS AIRQ‐18617
Vahlsing/Smith MS AIRQ‐18618