Vahlsing/Smith MS AIRQ‐186AAQSPollutant(ug/m3)Year 2 AAQSSet or RevisedCountry Name(Source <strong>of</strong> AAQS 1 ) <strong>PM10</strong> SO2 <strong>PM10</strong> SO2Population 3(2008)Urban population 4(% <strong>of</strong> total, 2008)GDP/capita 5(current US$, 2008)Healthexpenditure/capita 6(current US$, 2006)Energy use 7(kg <strong>of</strong> oilequalent/capita, 2007)<strong>PM10</strong> 8(ug/m3, 2007)General governmentfinal consumptionexpenditure 9(% <strong>of</strong> GDP, 2008)Type <strong>of</strong> AAQS**Antigua & Barbuda 10(Blacklane, 2011)0 0 2007 2007 86,634 30 14,048 627 12 18Argentina(Maggioria, 2006)Armenia(survey respondent)Australia(Aus. Gov., 1998)500 70 2006 39,882,980 92 8,236 663 1,850 73 130 yes 11 2007 2004 3,077,087 64 3,873 133 926 59 12209(0.08ppm)1998 1998 21,431,800 89 47,370 3,986 5,888 15 1Austria(Council <strong>of</strong> EU, 2008)50 125 2008 2008 8,336,926 67 49,599 4,523 3,997 33 18 D7 Source: World Bank, World Development Indicators, 2010, www.worldbank.org8 Particulate matter concentrations refer to fine suspended particulates less than 10 microns in diameter (<strong>PM10</strong>) that are capable <strong>of</strong> penetrating deep into therespiratory tract <strong>and</strong> causing significant health damage. Data <strong>for</strong> countries <strong>and</strong> aggregates <strong>for</strong> regions <strong>and</strong> income groups are urban-population weighted <strong>PM10</strong>levels in residential areas <strong>of</strong> cities with more than 100,000 residents. The estimates represent the average annual exposure level <strong>of</strong> the average urban resident tooutdoor particulate matter. The state <strong>of</strong> a country's technology <strong>and</strong> pollution controls is an important determinant <strong>of</strong> particulate matter concentrations (Source:World Bank, World Development Indicators, 2010, www.worldbank.org).9 General government final consumption expenditure (<strong>for</strong>merly general government consumption) includes all government current expenditures <strong>for</strong> purchases <strong>of</strong>goods <strong>and</strong> services (including compensation <strong>of</strong> employees). It also includes most expenditure on <strong>national</strong> defense <strong>and</strong> security, but excludes government militaryexpenditures that are part <strong>of</strong> government capital <strong>for</strong>mation. Source: World Bank, World Development Indicators, 2010, www.worldbank.org10 Although Antigua <strong>and</strong> Barbuda have no AAQS they use the WHO AQG when necessary11 If the survey respondent indicated that their country had AAQS <strong>for</strong> pollutant, but did not specify what the AAQS it was assumed that the country had the leaststringent AAQS on the map, but the country was not included in average AAQA calculation.3
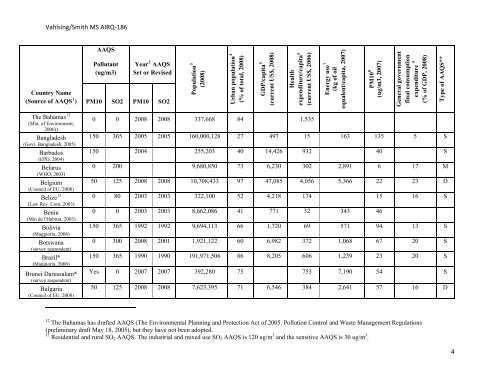
Vahlsing/Smith MS AIRQ‐186AAQSPollutant(ug/m3)Year 2 AAQSSet or RevisedCountry Name(Source <strong>of</strong> AAQS 1 ) <strong>PM10</strong> SO2 <strong>PM10</strong> SO2Population 3(2008)Urban population 4(% <strong>of</strong> total, 2008)GDP/capita 5(current US$, 2008)Healthexpenditure/capita 6(current US$, 2006)Energy use 7(kg <strong>of</strong> oilequalent/capita, 2007)<strong>PM10</strong> 8(ug/m3, 2007)General governmentfinal consumptionexpenditure 9(% <strong>of</strong> GDP, 2008)Type <strong>of</strong> AAQS**The Bahamas 12(Min, <strong>of</strong> Environment,2006))Bangladesh(Govt. Bangladesh, 2005)Barbados(EPD, 2004)Belarus(WHO, 2003)Belgium(Council <strong>of</strong> EU, 2008)Belize 13(Law Rev. Com. 2003)Benin(Min de l'Habitat, 2003)Bolivia(Maggioria, 2006)Botswana(survey respondent)Brazil*(Maggioria, 2006)Brunei Darussalam*(survey respondent)Bulgaria(Council <strong>of</strong> EU, 2008)0 0 2008 2008 337,668 84 1,535150 365 2005 2005 160,000,128 27 497 15 163 135 5 S150 2004 255,203 40 14,426 932 40 S0 200 9,680,850 73 6,230 302 2,891 6 17 M50 125 2008 2008 10,708,433 97 47,085 4,056 5,366 22 23 D0 80 2003 2003 322,100 52 4,218 174 15 16 S0 0 2003 2003 8,662,086 41 771 32 343 46150 365 1992 1992 9,694,113 66 1,720 69 571 94 13 S0 300 2008 2001 1,921,122 60 6,982 372 1,068 67 20 S150 365 1990 1990 191,971,506 86 8,205 606 1,239 23 20 SYes 0 2007 2007 392,280 75 753 7,190 54 S50 125 2008 2008 7,623,395 71 6,546 384 2,641 57 16 D12 The Bahamas has drafted AAQS (The Environmental Planning <strong>and</strong> Protection Act <strong>of</strong> 2005. Pollution Control <strong>and</strong> Waste Management Regulations(preliminary draft May 18, 2005), but they have not been adopted.13 Residential <strong>and</strong> rural SO 2 AAQS. The industrial <strong>and</strong> mixed use SO 2 AAQS is 120 ug/m 3 <strong>and</strong> the sensitive AAQS is 30 ug/m 3 .4