Atomically defined tips in scanning probe microscopy - McGill Physics
Atomically defined tips in scanning probe microscopy - McGill Physics
Atomically defined tips in scanning probe microscopy - McGill Physics

You also want an ePaper? Increase the reach of your titles
YUMPU automatically turns print PDFs into web optimized ePapers that Google loves.
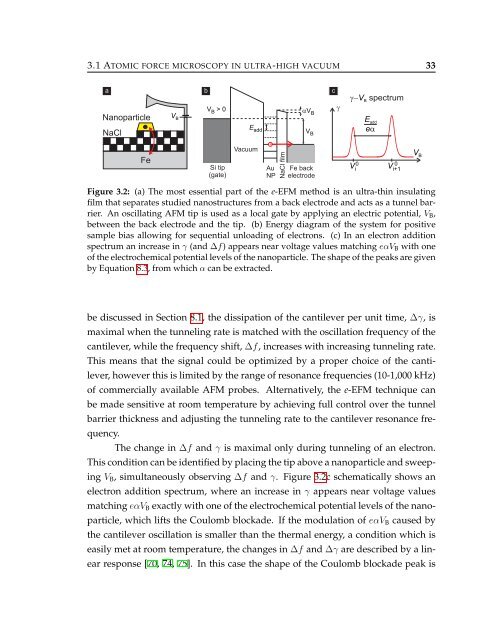
3.1 ATOMIC FORCE MICROSCOPY IN ULTRA-HIGH VACUUM 33Figure 3.2: (a) The most essential part of the e-EFM method is an ultra-th<strong>in</strong> <strong>in</strong>sulat<strong>in</strong>gfilm that separates studied nanostructures from a back electrode and acts as a tunnel barrier.An oscillat<strong>in</strong>g AFM tip is used as a local gate by apply<strong>in</strong>g an electric potential, V B ,between the back electrode and the tip. (b) Energy diagram of the system for positivesample bias allow<strong>in</strong>g for sequential unload<strong>in</strong>g of electrons. (c) In an electron additionspectrum an <strong>in</strong>crease <strong>in</strong> γ (and ∆f) appears near voltage values match<strong>in</strong>g eαV B with oneof the electrochemical potential levels of the nanoparticle. The shape of the peaks are givenby Equation 8.3, from which α can be extracted.be discussed <strong>in</strong> Section 8.1, the dissipation of the cantilever per unit time, ∆γ, ismaximal when the tunnel<strong>in</strong>g rate is matched with the oscillation frequency of thecantilever, while the frequency shift, ∆f, <strong>in</strong>creases with <strong>in</strong>creas<strong>in</strong>g tunnel<strong>in</strong>g rate.This means that the signal could be optimized by a proper choice of the cantilever,however this is limited by the range of resonance frequencies (10-1,000 kHz)of commercially available AFM <strong>probe</strong>s. Alternatively, the e-EFM technique canbe made sensitive at room temperature by achiev<strong>in</strong>g full control over the tunnelbarrier thickness and adjust<strong>in</strong>g the tunnel<strong>in</strong>g rate to the cantilever resonance frequency.The change <strong>in</strong> ∆f and γ is maximal only dur<strong>in</strong>g tunnel<strong>in</strong>g of an electron.This condition can be identified by plac<strong>in</strong>g the tip above a nanoparticle and sweep<strong>in</strong>gV B , simultaneously observ<strong>in</strong>g ∆f and γ. Figure 3.2c schematically shows anelectron addition spectrum, where an <strong>in</strong>crease <strong>in</strong> γ appears near voltage valuesmatch<strong>in</strong>g eαV B exactly with one of the electrochemical potential levels of the nanoparticle,which lifts the Coulomb blockade. If the modulation of eαV B caused bythe cantilever oscillation is smaller than the thermal energy, a condition which iseasily met at room temperature, the changes <strong>in</strong> ∆f and ∆γ are described by a l<strong>in</strong>earresponse [70, 74, 75]. In this case the shape of the Coulomb blockade peak is