Queensland University of Technology 2011 Annual Report - QUT
Queensland University of Technology 2011 Annual Report - QUT
Queensland University of Technology 2011 Annual Report - QUT

You also want an ePaper? Increase the reach of your titles
YUMPU automatically turns print PDFs into web optimized ePapers that Google loves.
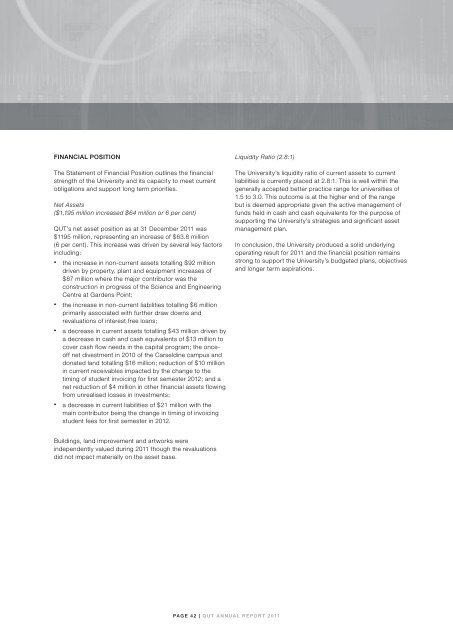
Financial PositionThe Statement <strong>of</strong> Financial Position outlines the financialstrength <strong>of</strong> the <strong>University</strong> and its capacity to meet currentobligations and support long term priorities.Net Assets($1,195 million increased $64 million or 6 per cent)<strong>QUT</strong>’s net asset position as at 31 December <strong>2011</strong> was$1195 million, representing an increase <strong>of</strong> $63.8 million(6 per cent). This increase was driven by several key factorsincluding:• the increase in non-current assets totalling $92 milliondriven by property, plant and equipment increases <strong>of</strong>$87 million where the major contributor was theconstruction in progress <strong>of</strong> the Science and EngineeringCentre at Gardens Point;• the increase in non-current liabilities totalling $6 millionprimarily associated with further draw downs andrevaluations <strong>of</strong> interest free loans;• a decrease in current assets totalling $43 million driven bya decrease in cash and cash equivalents <strong>of</strong> $13 million tocover cash flow needs in the capital program; the once<strong>of</strong>fnet divestment in 2010 <strong>of</strong> the Carseldine campus anddonated land totalling $16 million; reduction <strong>of</strong> $10 millionin current receivables impacted by the change to thetiming <strong>of</strong> student invoicing for first semester 2012; and anet reduction <strong>of</strong> $4 million in other financial assets flowingfrom unrealised losses in investments;• a decrease in current liabilities <strong>of</strong> $21 million with themain contributor being the change in timing <strong>of</strong> invoicingstudent fees for first semester in 2012.Liquidity Ratio (2.8:1)The <strong>University</strong>’s liquidity ratio <strong>of</strong> current assets to currentliabilities is currently placed at 2.8:1. This is well within thegenerally accepted better practice range for universities <strong>of</strong>1.5 to 3.0. This outcome is at the higher end <strong>of</strong> the rangebut is deemed appropriate given the active management <strong>of</strong>funds held in cash and cash equivalents for the purpose <strong>of</strong>supporting the <strong>University</strong>’s strategies and significant assetmanagement plan.In conclusion, the <strong>University</strong> produced a solid underlyingoperating result for <strong>2011</strong> and the financial position remainsstrong to support the <strong>University</strong>’s budgeted plans, objectivesand longer term aspirations.Buildings, land improvement and artworks wereindependently valued during <strong>2011</strong> though the revaluationsdid not impact materially on the asset base.PAGE 42 | <strong>QUT</strong> ANNUAL REPORT <strong>2011</strong>