Chapter 11: Weather Theory - FAA
Chapter 11: Weather Theory - FAA
Chapter 11: Weather Theory - FAA

You also want an ePaper? Increase the reach of your titles
YUMPU automatically turns print PDFs into web optimized ePapers that Google loves.
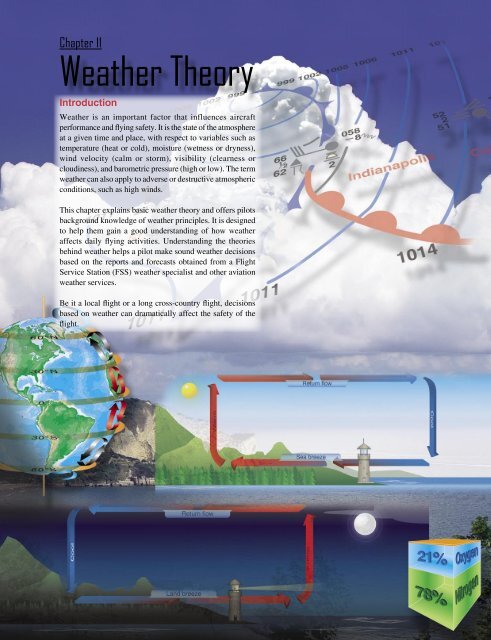
<strong>Chapter</strong> <strong>11</strong><strong>Weather</strong> <strong>Theory</strong>Introduction<strong>Weather</strong> is an important factor that influences aircraftperformance and flying safety. It is the state of the atmosphereat a given time and place, with respect to variables such astemperature (heat or cold), moisture (wetness or dryness),wind velocity (calm or storm), visibility (clearness orcloudiness), and barometric pressure (high or low). The termweather can also apply to adverse or destructive atmosphericconditions, such as high winds.This chapter explains basic weather theory and offers pilotsbackground knowledge of weather principles. It is designedto help them gain a good understanding of how weatheraffects daily flying activities. Understanding the theoriesbehind weather helps a pilot make sound weather decisionsbased on the reports and forecasts obtained from a FlightService Station (FSS) weather specialist and other aviationweather services.Be it a local flight or a long cross-country flight, decisionsbased on weather can dramatically affect the safety of theflight.<strong>11</strong>-1
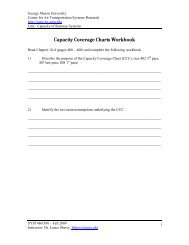
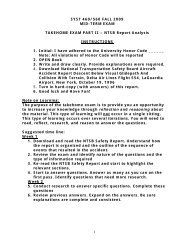
AtmosphereThe atmosphere is a blanket of air made up of a mixture ofgases that surrounds the Earth and reaches almost 350 milesfrom the surface of the Earth. This mixture is in constantmotion. If the atmosphere were visible, it might look likean ocean with swirls and eddies, rising and falling air, andwaves that travel for great distances.Life on Earth is supported by the atmosphere, solar energy,and the planet’s magnetic fields. The atmosphere absorbsenergy from the Sun, recycles water and other chemicals, andworks with the electrical and magnetic forces to provide amoderate climate. The atmosphere also protects life on Earthfrom high energy radiation and the frigid vacuum of space.1%21%78%OxygenNitrogenComposition of the AtmosphereIn any given volume of air, nitrogen accounts for 78 percentof the gases that comprise the atmosphere, while oxygenmakes up 21 percent. Argon, carbon dioxide, and traces ofother gases make up the remaining one percent. This cubicfoot also contains some water vapor, varying from zero toabout five percent by volume. This small amount of watervapor is responsible for major changes in the weather.[Figure <strong>11</strong>-1]The envelope of gases surrounding the Earth changesfrom the ground up. Four distinct layers or spheres of theatmosphere have been identified using thermal characteristicsFigure <strong>11</strong>-1. Composition of the atmosphere.(temperature changes), chemical composition, movement,and density. [Figure <strong>11</strong>-2]The first layer, known as the troposphere, extends from sealevel up to 20,000 feet (8 kilometers (km)) over the northernand southern poles and up to 48,000 feet (14.5 km) over theequatorial regions. The vast majority of weather, clouds,storms, and temperature variances occur within this first layerof the atmosphere. Inside the troposphere, the temperaturedecreases at a rate of about 2 °Celsius (C) every 1,000 feetof altitude gain, and the pressure decreases at a rate of aboutone inch per 1,000 feet of altitude gain.ThermosphereMesosphereStratosphereTroposphere280,000 feet160,000 feet20,000 feetFigure <strong>11</strong>-2. Layers of the atmosphere.<strong>11</strong>-2
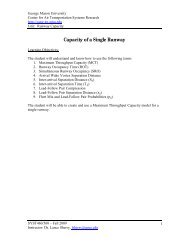
At the top of the troposphere is a boundary known as thetropopause, which traps moisture and the associated weatherin the troposphere. The altitude of the tropopause varies withlatitude and with the season of the year; therefore, it takeson an elliptical shape, as opposed to round. Location of thetropopause is important because it is commonly associatedwith the location of the jet stream and possible clear airturbulence.Above the tropopause are three more atmospheric levels. Thefirst is the stratosphere, which extends from the tropopause toa height of about 160,000 feet (50 km). Little weather existsin this layer and the air remains stable although certain typesof clouds occasionally extend in it. Above the stratosphereare the mesosphere and thermosphere which have littleinfluence over weather.Atmospheric CirculationAs noted earlier, the atmosphere is in constant motion.Certain factors combine to set the atmosphere in motion, but amajor factor is the uneven heating of the Earth’s surface. Thisheating upsets the equilibrium of the atmosphere, creatingchanges in air movement and atmospheric pressure. Themovement of air around the surface of the Earth is calledatmospheric circulation.Heating of the Earth’s surface is accomplished by severalprocesses, but in the simple convection-only model used forthis discussion, the Earth is warmed by energy radiating fromthe sun. The process causes a circular motion that resultswhen warm air rises and is replaced by cooler air.Warm air rises because heat causes air molecules to spreadapart. As the air expands, it becomes less dense and lighterthan the surrounding air. As air cools, the molecules packtogether more closely, becoming denser and heavier thanwarm air. As a result, cool, heavy air tends to sink and replacewarmer, rising air.Because the Earth has a curved surface that rotates on a tiltedaxis while orbiting the sun, the equatorial regions of the Earthreceive a greater amount of heat from the sun than the polarregions. The amount of sun that heats the Earth depends onthe time of year and the latitude of the specific region. All ofthese factors affect the length of time and the angle at whichsunlight strikes the surface.Solar heating causes higher temperatures in equatorial areaswhich causes the air to be less dense and rise. As the warmair flows toward the poles, it cools, becoming denser, andsinks back toward the surface. [Figure <strong>11</strong>-3]Figure <strong>11</strong>-3. Circulation pattern in a static environment.Atmospheric PressureThe unequal heating of the Earth’s surface not only modifiesair density and creates circulation patterns; it also causeschanges in air pressure or the force exerted by the weightof air molecules. Although air molecules are invisible, theystill have weight and take up space.Imagine a sealed column of air that has a footprint of onesquare inch and is 350 miles high. It would take 14.7 poundsof effort to lift that column. This represents the air’s weight;if the column is shortened, the pressure exerted at the bottom(and its weight) would be less.The weight of the shortened column of air at 18,000 feet isapproximately 7.4 pounds; almost 50 percent that at sea level.For instance, if a bathroom scale (calibrated for sea level)were raised to 18,000 feet, the column of air weighing 14.7pounds at sea level would be 18,000 feet shorter, and wouldweigh approximately 7.3 pounds (50 percent) less than atsea level. [Figure <strong>11</strong>-4]The actual pressure at a given place and time differs withaltitude, temperature, and density of the air. These conditionsalso affect aircraft performance, especially with regard totakeoff, rate of climb, and landings.Coriolis ForceIn general atmospheric circulation theory, areas of lowpressure exist over the equatorial regions and areas of highpressure exist over the polar regions due to a difference intemperature. The resulting low pressure allows the highpressureair at the poles to flow along the planet’s surface<strong>11</strong>-3
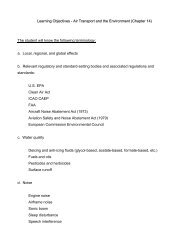
14.7 lb1Square Inch1Square Inch1Square Inch<strong>11</strong>Square Inch18,000 feet7.4 lb1Sea levelFigure <strong>11</strong>-5. Three-cell circulation pattern due to the rotation ofthe Earth.Figure <strong>11</strong>-4. Atmosphere weights.toward the equator. While this pattern of air circulation iscorrect in theory, the circulation of air is modified by severalforces, the most important of which is the rotation of theEarth.The force created by the rotation of the Earth is known asthe Coriolis force. This force is not perceptible to humans asthey walk around because humans move slowly and travelrelatively short distances compared to the size and rotationrate of the Earth. However, the Coriolis force significantlyaffects bodies that move over great distances, such as an airmass or body of water.The Coriolis force deflects air to the right in the NorthernHemisphere, causing it to follow a curved path instead of astraight line. The amount of deflection differs depending onthe latitude. It is greatest at the poles, and diminishes to zeroat the equator. The magnitude of Coriolis force also differswith the speed of the moving body—the greater the speed,the greater the deviation. In the Northern Hemisphere, therotation of the Earth deflects moving air to the right andchanges the general circulation pattern of the air.The speed of the Earth’s rotation causes the general flowto break up into three distinct cells in each hemisphere.[Figure <strong>11</strong>-5] In the Northern Hemisphere, the warm air atthe equator rises upward from the surface, travels northward,and is deflected eastward by the rotation of the Earth. Bythe time it has traveled one-third of the distance from theequator to the North Pole, it is no longer moving northward,but eastward. This air cools and sinks in a belt-like area atabout 30° latitude, creating an area of high pressure as itsinks toward the surface. Then, it flows southward alongthe surface back toward the equator. Coriolis force bendsthe flow to the right, thus creating the northeasterly tradewinds that prevail from 30° latitude to the equator. Similarforces create circulation cells that encircle the Earth between30° and 60° latitude, and between 60° and the poles. Thiscirculation pattern results in the prevailing westerly windsin the conterminous United States.Circulation patterns are further complicated by seasonalchanges, differences between the surfaces of continents andoceans, and other factors such as frictional forces causedby the topography of the Earth’s surface which modify themovement of the air in the atmosphere. For example, within2,000 feet of the ground, the friction between the surface andthe atmosphere slows the moving air. The wind is diverted fromits path because the frictional force reduces the Coriolis force.Thus, the wind direction at the surface varies somewhat fromthe wind direction just a few thousand feet above the Earth.Measurement of Atmosphere PressureAtmospheric pressure is typically measured in inches ofmercury ("Hg) by a mercurial barometer. [Figure <strong>11</strong>-6] Thebarometer measures the height of a column of mercury inside aglass tube. A section of the mercury is exposed to the pressureof the atmosphere, which exerts a force on the mercury. Anincrease in pressure forces the mercury to rise inside the tube.When the pressure drops, mercury drains out of the tube,decreasing the height of the column. This type of barometer istypically used in a laboratory or weather observation station,is not easily transported, and difficult to read.<strong>11</strong>-4
Height of mercury(760 mm)29.92"At sea level in a standardatmosphere, the weightof the atmosphere(14.7 lb/in 2 ) supportsa column of mercury29.92 inches high.Atmospheric pressureSea levelTo provide a common reference, the International StandardAtmosphere (ISA) has been established. These standardconditions are the basis for certain flight instruments andmost aircraft performance data. Standard sea level pressureis defined as 29.92 "Hg and a standard temperature of 59 °F(15 °C). Atmospheric pressure is also reported in millibars(mb), with 1 "Hg equal to approximately 34 mb. Standard sealevel pressure is 1,013.2 mb. Typical mb pressure readingsrange from 950.0 to 1,040.0 mb. Constant pressure charts andhurricane pressure reports are written using mb.Since weather stations are located around the globe, all localbarometric pressure readings are converted to a sea levelpressure to provide a standard for records and reports. Toachieve this, each station converts its barometric pressure byadding approximately 1 "Hg for every 1,000 feet of elevation.For example, a station at 5,000 feet above sea level, with areading of 24.92 "Hg, reports a sea level pressure reading of29.92 "Hg. [Figure <strong>11</strong>-8] Using common sea level pressurereadings helps ensure aircraft altimeters are set correctly,based on the current pressure readings.29.92 "Hg = 1,013.2 mb (hPa) = 14.7 lb/in 2Figure <strong>11</strong>-6. Mercurial barometer.An aneroid barometer is an alternative to a mercurialbarometer; it is easier to read and transport. [Figure <strong>11</strong>-7] Theaneroid barometer contains a closed vessel, called an aneroidcell that contracts or expands with changes in pressure. Theaneroid cell attaches to a pressure indicator with a mechanicallinkage to provide pressure readings. The pressure sensingpart of an aircraft altimeter is essentially an aneroidbarometer. It is important to note that due to the linkagemechanism of an aneroid barometer, it is not as accurate asa mercurial barometer.HigherBy tracking barometric pressure trends across a large area,weather forecasters can more accurately predict movementof pressure systems and the associated weather. For example,tracking a pattern of rising pressure at a single weather stationgenerally indicates the approach of fair weather. Conversely,decreasing or rapidly falling pressure usually indicatesapproaching bad weather and, possibly, severe storms.Altitude and Atmospheric PressureAs altitude increases, atmospheric pressure decreases. Onaverage, with every 1,000 feet of increase in altitude, theatmospheric pressure decreases 1 "Hg. As pressure decreases,the air becomes less dense or “thinner.” This is the equivalentof being at a higher altitude and is referred to as densityaltitude (DA). As pressure decreases, DA increases and hasa pronounced effect on aircraft performance.Atmospheric pressureSealed aneroid cellSealed aneroid cellLowerDifferences in air density caused by changes in temperatureresult in a change in pressure. This, in turn, creates motion inthe atmosphere, both vertically and horizontally, in the formof currents and wind. The atmosphere is almost constantlyin motion as it strives to reach equilibrium. These neverendingair movements set up chain reactions which cause acontinuing variety in the weather.Sealed aneroid cellFigure <strong>11</strong>-7. Aneroid barometer.<strong>11</strong>-5
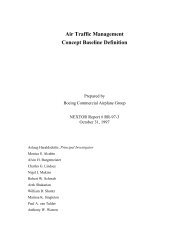
Station PressureDenver24.92 "HgStandard AtmosphereStation PressureNew Orleans29.92 "HgDenver 29.92 "HgNew Orleans 29.92 "HgFigure <strong>11</strong>-8. Station pressure is converted to and reported in sea level pressure.Altitude and FlightAltitude affects every aspect of flight from aircraftperformance to human performance. At higher altitudes,with a decreased atmospheric pressure, takeoff and landingdistances are increased, as are climb rates.When an aircraft takes off, lift must be developed by theflow of air around the wings. If the air is thin, more speedis required to obtain enough lift for takeoff; therefore, theground run is longer. An aircraft that requires 745 feet ofground run at sea level requires more than double that at apressure altitude of 8,000 feet. [Figure <strong>11</strong>-9]. It is also truethat at higher altitudes, due to the decreased density of theair, aircraft engines and propellers are less efficient. Thisleads to reduced rates of climb and a greater ground run forobstacle clearance.Altitude and the Human BodyAs discussed earlier, nitrogen and other trace gases makeup 79 percent of the atmosphere, while the remaining 21Pressure Altitude: Sea levelTAKEOFF DISTANCEMAXIMUM WEIGHT 2,400 LBPressurealtitude(feet)Groundroll(feet)0 °CTotal feetto clear50 foot obstacle745 feetPressure Altitude: 8,000 feetS.L.1,0002,0003,0004,0005,0006,0007,0008,0007458158959801,0751,1851,3051,4401,5901,3201,4451,5851,7401,9202,1252,3602,6352,9601,590 feetFigure <strong>11</strong>-9. Takeoff distances increase with increased altitude.<strong>11</strong>-6
percent is life sustaining, atmospheric oxygen. At sea level,atmospheric pressure is great enough to support normalgrowth, activity, and life. By 18,000 feet, the partial pressureof oxygen is reduced and adversely affects the normalactivities and functions of the human body.The reactions of the average person become impaired at analtitude of about 10,000 feet, but for some people impairmentcan occur at an altitude as low as 5,000 feet. The physiologicalreactions to hypoxia or oxygen deprivation are insidious andaffect people in different ways. These symptoms range frommild disorientation to total incapacitation, depending onbody tolerance and altitude. Supplemental oxygen or cabinpressurization systems help pilots fly at higher altitudes andovercome the effects of oxygen deprivation.Wind and CurrentsAir flows from areas of high pressure into areas of lowpressure because air always seeks out lower pressure. Airpressure, temperature changes, and the Coriolis force work incombination to create two kinds of motion in the atmosphere—vertical movement of ascending and descending currents,and horizontal movement in the form of wind. Currents andwinds are important as they affect takeoff, landing, and cruiseflight operations. Most importantly, currents and winds oratmospheric circulation cause weather changes.Wind PatternsIn the Northern Hemisphere, the flow of air from areas ofhigh to low pressure is deflected to the right and producesa clockwise circulation around an area of high pressure.This is known as anticyclonic circulation. The oppositeis true of low-pressure areas; the air flows toward a lowand is deflected to create a counterclockwise or cycloniccirculation. [Figure <strong>11</strong>-10]High pressure systems are generally areas of dry, stable,descending air. Good weather is typically associated withhigh pressure systems for this reason. Conversely, air flowsinto a low pressure area to replace rising air. This air tendsto be unstable, and usually brings increasing cloudiness andprecipitation. Thus, bad weather is commonly associatedwith areas of low pressure.A good understanding of high and low pressure wind patternscan be of great help when planning a flight, because a pilotcan take advantage of beneficial tailwinds. [Figure <strong>11</strong>-<strong>11</strong>]When planning a flight from west to east, favorable windswould be encountered along the northern side of a highpressure system or the southern side of a low pressure system.On the return flight, the most favorable winds would be alongthe southern side of the same high pressure system or thenorthern side of a low pressure system. An added advantageFigure <strong>11</strong>-10. Circulation pattern about areas of high and lowpressure.is a better understanding of what type of weather to expectin a given area along a route of flight based on the prevailingareas of highs and lows.While the theory of circulation and wind patterns is accuratefor large scale atmospheric circulation, it does not take intoaccount changes to the circulation on a local scale. Localconditions, geological features, and other anomalies canchange the wind direction and speed close to the Earth’ssurface.Convective CurrentsDifferent surfaces radiate heat in varying amounts. Plowedground, rocks, sand, and barren land give off a large amount ofheat; water, trees, and other areas of vegetation tend to absorband retain heat. The resulting uneven heating of the air createssmall areas of local circulation called convective currents.Convective currents cause the bumpy, turbulent air sometimesexperienced when flying at lower altitudes during warmerweather. On a low altitude flight over varying surfaces,updrafts are likely to occur over pavement or barren places,and downdrafts often occur over water or expansive areasof vegetation like a group of trees. Typically, these turbulentconditions can be avoided by flying at higher altitudes, evenabove cumulus cloud layers. [Figure <strong>11</strong>-12]Convective currents are particularly noticeable in areas witha land mass directly adjacent to a large body of water, suchas an ocean, large lake, or other appreciable area of water.During the day, land heats faster than water, so the air over theland becomes warmer and less dense. It rises and is replaced<strong>11</strong>-7
Figure <strong>11</strong>-<strong>11</strong>. Favorable winds near a high pressure system.Figure <strong>11</strong>-12. Convective turbulence avoidance.by cooler, denser air flowing in from over the water. Thiscauses an onshore wind, called a sea breeze. Conversely, atnight land cools faster than water, as does the correspondingair. In this case, the warmer air over the water rises and isreplaced by the cooler, denser air from the land, creating anoffshore wind called a land breeze. This reverses the localwind circulation pattern. Convective currents can occuranywhere there is an uneven heating of the Earth’s surface.[Figure <strong>11</strong>-13]Convective currents close to the ground can affect a pilot’sability to control the aircraft. For example, on final approach,the rising air from terrain devoid of vegetation sometimesproduces a ballooning effect that can cause a pilot toovershoot the intended landing spot. On the other hand,an approach over a large body of water or an area of thickvegetation tends to create a sinking effect that can causean unwary pilot to land short of the intended landing spot.[Figure <strong>11</strong>-14]Effect of Obstructions on WindAnother atmospheric hazard exists that can create problemsfor pilots. Obstructions on the ground affect the flow ofwind and can be an unseen danger. Ground topography andlarge buildings can break up the flow of the wind and createwind gusts that change rapidly in direction and speed. Theseobstructions range from manmade structures like hangarsto large natural obstructions, such as mountains, bluffs, orcanyons. It is especially important to be vigilant when flyingin or out of airports that have large buildings or naturalobstructions located near the runway. [Figure <strong>11</strong>-15]The intensity of the turbulence associated with groundobstructions depends on the size of the obstacle and theprimary velocity of the wind. This can affect the takeoff andlanding performance of any aircraft and can present a veryserious hazard. During the landing phase of flight, an aircraft<strong>11</strong>-8
Return flowCoolWarmCoolSea breezeReturn flowWarmLand breezeFigure <strong>11</strong>-13. Sea breeze and land breeze wind circulation patterns.CoolsinkingairWarmrisingairIntended FlightpathFigure <strong>11</strong>-14. Currents generated by varying surface conditions.<strong>11</strong>-9
W I N DFigure <strong>11</strong>-15. Turbulence caused by manmade obstructions.may “drop in” due to the turbulent air and be too low to clearobstacles during the approach.This same condition is even more noticeable when flying inmountainous regions. [Figure <strong>11</strong>-16] While the wind flowssmoothly up the windward side of the mountain and theupward currents help to carry an aircraft over the peak ofthe mountain, the wind on the leeward side does not act ina similar manner. As the air flows down the leeward side ofthe mountain, the air follows the contour of the terrain andis increasingly turbulent. This tends to push an aircraft intothe side of a mountain. The stronger the wind, the greater thedownward pressure and turbulence become.Due to the effect terrain has on the wind in valleys or canyons,downdrafts can be severe. Before conducting a flight in ornear mountainous terrain, it is helpful for a pilot unfamiliarwith a mountainous area to get a checkout with a mountainqualified flight instructor.Figure <strong>11</strong>-16. Turbulence in mountainous regions.<strong>11</strong>-10
Low-Level Wind ShearWind shear is a sudden, drastic change in wind speed and/ordirection over a very small area. Wind shear can subject anaircraft to violent updrafts and downdrafts, as well as abruptchanges to the horizontal movement of the aircraft. Whilewind shear can occur at any altitude, low-level wind shear isespecially hazardous due to the proximity of an aircraft to theground. Directional wind changes of 180° and speed changesof 50 knots or more are associated with low-level wind shear.Low-level wind shear is commonly associated with passingfrontal systems, thunderstorms, and temperature inversionswith strong upper level winds (greater than 25 knots).Wind shear is dangerous to an aircraft for several reasons. Therapid changes in wind direction and velocity change the wind’srelation to the aircraft disrupting the normal flight attitude andperformance of the aircraft. During a wind shear situation,the effects can be subtle or very dramatic depending on windspeed and direction of change. For example, a tailwind thatquickly changes to a headwind causes an increase in airspeedand performance. Conversely, when a headwind changesto a tailwind, the airspeed rapidly decreases and there is acorresponding decrease in performance. In either case, apilot must be prepared to react immediately to the changesto maintain control of the aircraft.In general, the most severe type of low-level wind shearis associated with convective precipitation or rain fromthunderstorms. One critical type of shear associated withconvective precipitation is known as a microburst. A typicalmicroburst occurs in a space of less than one mile horizontallyand within 1,000 feet vertically. The lifespan of a microburstis about 15 minutes during which it can produce downdraftsof up to 6,000 feet per minute (fpm). It can also produce ahazardous wind direction change of 45 degrees or more, ina matter of seconds.When encountered close to the ground, these excessivedowndrafts and rapid changes in wind direction canproduce a situation in which it is difficult to control theaircraft. [Figure <strong>11</strong>-17] During an inadvertent takeoff intoa microburst, the plane first experiences a performanceincreasingheadwind (1), followed by performance-decreasingdowndrafts (2). Then, the wind rapidly shears to a tailwind(3), and can result in terrain impact or flight dangerouslyclose to the ground (4).Microbursts are often difficult to detect because they occurin relatively confined areas. In an effort to warn pilots oflow-level wind shear, alert systems have been installed atseveral airports around the country. A series of anemometers,placed around the airport, form a net to detect changes inwind speeds. When wind speeds differ by more than 15 knots,a warning for wind shear is given to pilots. This system isknown as the low-level wind shear alert system (LLWAS).It is important to remember that wind shear can affect anyflight and any pilot at any altitude. While wind shear may bereported, it often remains undetected and is a silent dangerto aviation. Always be alert to the possibility of wind shear,especially when flying in and around thunderstorms andfrontal systems.Wind and Pressure Representation on Surface<strong>Weather</strong> MapsSurface weather maps provide information about fronts, areasof high and low pressure, and surface winds and pressuresfor each station. This type of weather map allows pilots toStrong downdraftIntended PathIncreasing headwindIncreasing tailwind2OutflowOutflow134Figure <strong>11</strong>-17. Effects of a microburst wind.<strong>11</strong>-<strong>11</strong>
see the locations of fronts and pressure systems, but moreimportantly, it depicts the wind and pressure at the surfacefor each location. For more information on surface analysisand weather depiction charts, see <strong>Chapter</strong> 12, <strong>Weather</strong>Aviation Services.Wind conditions are reported by an arrow attached to thestation location circle. [Figure <strong>11</strong>-18] The station circlerepresents the head of the arrow, with the arrow pointingin the direction from which the wind is blowing. Windsare described by the direction from which they blow, thusa northwest wind means that the wind is blowing from thenorthwest toward the southeast. The speed of the wind isdepicted by barbs or pennants placed on the wind line. Eachbarb represents a speed of ten knots, while half a barb is equalto five knots, and a pennant is equal to 50 knots.CalmNW/5 ktsSW/20 kts1020102410201016Isobars1012IsobarsWidely spaced isobarsmean a shallow pressuregradient and relativelylight winds.Closely spaced isobars mean a steeppressure gradient and strong winds.L1008Figure <strong>11</strong>-19. Isobars reveal the pressure gradient of an area ofhigh- or low-pressure areas.E/35 kts N/50 kts W/105 ktsFigure <strong>11</strong>-18. Depiction of winds on a surface weather chart.The pressure for each station is recorded on the weather chartand is shown in mb. Isobars are lines drawn on the chart todepict areas of equal pressure. These lines result in a patternthat reveals the pressure gradient or change in pressure overdistance. [Figure <strong>11</strong>-19] Isobars are similar to contour lineson a topographic map that indicate terrain altitudes andslope steepness. For example, isobars that are closely spacedindicate a steep wind gradient and strong winds prevail.Shallow gradients, on the other hand, are represented byisobars that are spaced far apart, and are indicative of lightwinds. Isobars help identify low and high pressure systemsas well as the location of ridges, troughs, and cut-off lows(cols). A high is an area of high pressure surrounded bylower pressure; a low is an area of low pressure surroundedby higher pressure. A ridge is an elongated area of highpressure, and a trough is an elongated area of low pressure.A col is the intersection between a ridge and a trough, or anarea of neutrality between two highs or two lows.Isobars furnish valuable information about winds in the firstfew thousand feet above the surface. Close to the ground,wind direction is modified by the surface and wind speeddecreases due to friction with the surface. At levels 2,000 to3,000 feet above the surface, however, the speed is greaterand the direction becomes more parallel to the isobars.Therefore, the surface winds are shown on the weather map,as well as the winds at a slightly higher altitude.Generally, the wind 2,000 feet above ground level (AGL) is20° to 40° to the right of surface winds, and the wind speedis greater. The change of wind direction is greatest over roughterrain and least over flat surfaces, such as open water. In theabsence of winds aloft information, this rule of thumb allowsfor a rough estimate of the wind conditions a few thousandfeet above the surface.Atmospheric StabilityThe stability of the atmosphere depends on its ability toresist vertical motion. A stable atmosphere makes verticalmovement difficult, and small vertical disturbances dampenout and disappear. In an unstable atmosphere, small verticalair movements tend to become larger, resulting in turbulentairflow and convective activity. Instability can lead tosignificant turbulence, extensive vertical clouds, and severeweather.Rising air expands and cools due to the decrease in airpressure as altitude increases. The opposite is true ofdescending air; as atmospheric pressure increases, thetemperature of descending air increases as it is compressed.Adiabatic heating and adiabatic cooling are terms used todescribe this temperature change.<strong>11</strong>-12
The adiabatic process takes place in all upward anddownward moving air. When air rises into an area of lowerpressure, it expands to a larger volume. As the moleculesof air expand, the temperature of the air lowers. As a result,when a parcel of air rises, pressure decreases, volumeincreases, and temperature decreases. When air descends,the opposite is true. The rate at which temperature decreaseswith an increase in altitude is referred to as its lapse rate.As air ascends through the atmosphere, the average rate oftemperature change is 2 °C (3.5 °F) per 1,000 feet.Since water vapor is lighter than air, moisture decreases airdensity, causing it to rise. Conversely, as moisture decreases,air becomes denser and tends to sink. Since moist air cools at aslower rate, it is generally less stable than dry air since the moistair must rise higher before its temperature cools to that of thesurrounding air. The dry adiabatic lapse rate (unsaturated air)is 3 °C (5.4 °F) per 1,000 feet. The moist adiabatic lapse ratevaries from 1.1 °C to 2.8 °C (2 °F to 5 °F) per 1,000 feet.The combination of moisture and temperature determine thestability of the air and the resulting weather. Cool, dry airis very stable and resists vertical movement, which leads togood and generally clear weather. The greatest instabilityoccurs when the air is moist and warm, as it is in the tropicalregions in the summer. Typically, thunderstorms appear ona daily basis in these regions due to the instability of thesurrounding air.InversionAs air rises and expands in the atmosphere, the temperaturedecreases. There is an atmospheric anomaly that can occur;however, that changes this typical pattern of atmosphericbehavior. When the temperature of the air rises with altitude, atemperature inversion exists. Inversion layers are commonlyshallow layers of smooth, stable air close to the ground. Thetemperature of the air increases with altitude to a certainpoint, which is the top of the inversion. The air at the topof the layer acts as a lid, keeping weather and pollutantstrapped below. If the relative humidity of the air is high, itcan contribute to the formation of clouds, fog, haze, or smoke,resulting in diminished visibility in the inversion layer.Surface based temperature inversions occur on clear, coolnights when the air close to the ground is cooled by thelowering temperature of the ground. The air within a fewhundred feet of the surface becomes cooler than the air aboveit. Frontal inversions occur when warm air spreads over alayer of cooler air, or cooler air is forced under a layer ofwarmer air.Moisture and TemperatureThe atmosphere, by nature, contains moisture in the formof water vapor. The amount of moisture present in theatmosphere is dependent upon the temperature of the air.Every 20 °F increase in temperature doubles the amount ofmoisture the air can hold. Conversely, a decrease of 20 °Fcuts the capacity in half.Water is present in the atmosphere in three states: liquid,solid, and gaseous. All three forms can readily change toanother, and all are present within the temperature ranges ofthe atmosphere. As water changes from one state to another,an exchange of heat takes place. These changes occur throughthe processes of evaporation, sublimation, condensation,deposition, melting, or freezing. However, water vaporis added into the atmosphere only by the processes ofevaporation and sublimation.Evaporation is the changing of liquid water to water vapor.As water vapor forms, it absorbs heat from the nearestavailable source. This heat exchange is known as the latentheat of evaporation. A good example is the evaporation ofhuman perspiration. The net effect is a cooling sensationas heat is extracted from the body. Similarly, sublimationis the changing of ice directly to water vapor, completelybypassing the liquid stage. Though dry ice is not made ofwater, but rather carbon dioxide, it demonstrates the principleof sublimation, when a solid turns directly into vapor.Relative HumidityHumidity refers to the amount of water vapor present in theatmosphere at a given time. Relative humidity is the actualamount of moisture in the air compared to the total amount ofmoisture the air could hold at that temperature. For example,if the current relative humidity is 65 percent, the air isholding 65 percent of the total amount of moisture that it iscapable of holding at that temperature and pressure. Whilemuch of the western United States rarely sees days of highhumidity, relative humidity readings of 75 to 90 percent arenot uncommon in the southern United States during warmermonths. [Figure <strong>11</strong>-20]Temperature/Dew Point RelationshipThe relationship between dew point and temperature definesthe concept of relative humidity. The dew point, given indegrees, is the temperature at which the air can hold nomore moisture. When the temperature of the air is reducedto the dew point, the air is completely saturated and moisturebegins to condense out of the air in the form of fog, dew,frost, clouds, rain, hail, or snow.<strong>11</strong>-13
At sea level pressure, air can hold9 g H 2 O/cubic foot of air at 10 °C17 g H 2 O/cubic foot of air at 20 °C30 g H 2 O/cubic foot of air at 30 °CIf the temperature is lowered to 10 °C,the air can hold only 9 g of watervapor, and 8 g of water will condenseas water droplets. The relativehumidity will still be at 100%.If the same cubic foot of air warmsto 30 °C, the 17 g of water vapor willproduce a relative humidity of 56%.(17 g is 56% of the 30 g the air couldhold at this temperature.)A cubic foot of air with 17 grams (g) ofwater vapor at 20 °C is at saturation,or 100% relative humidity. Any furthercooling will cause condensation (fog,clouds, dew) to form. Thus, 20 °C isthe dewpoint for this situation.Figure <strong>11</strong>-20. Relationship between relative humidity, temperature, and dewpoint.As moist, unstable air rises, clouds often form at the altitudewhere temperature and dew point reach the same value. Whenlifted, unsaturated air cools at a rate of 5.4 °F per 1,000 feetand the dew point temperature decreases at a rate of 1 °Fper 1,000 feet. This results in a convergence of temperatureand dew point at a rate of 4.4 °F. Apply the convergence rateto the reported temperature and dew point to determine theheight of the cloud base.Given:Temperature (T) = 85 °FDew point (DP) = 71 °FConvergence Rate (CR) = 4.4°T – DP = Temperature Dew Point Spread (TDS)TDS ÷ CR = XX × 1,000 feet = height of cloud base AGLExample:85 °F–71 °F = 14 °F14 °F ÷ 4.4 °F = 3.183.18 × 1,000 = 3,180 feet AGLThe height of the cloud base is 3,180 feet AGL.Explanation:With an outside air temperature (OAT) of 85 °F at the surface,and dew point at the surface of 71 °F, the spread is 14°. Dividethe temperature dew point spread by the convergence rate of4.4 °F, and multiply by 1,000 to determine the approximateheight of the cloud base.Methods by Which Air Reaches the SaturationPointIf air reaches the saturation point while temperature and dewpoint are close together, it is highly likely that fog, low clouds,and precipitation will form. There are four methods by whichair can reach the complete saturation point. First, when warmair moves over a cold surface, the air temperature drops andreaches the saturation point. Second, the saturation point maybe reached when cold air and warm air mix. Third, when aircools at night through contact with the cooler ground, airreaches its saturation point. The fourth method occurs whenair is lifted or is forced upward in the atmosphere.As air rises, it uses heat energy to expand. As a result, the risingair loses heat rapidly. Unsaturated air loses heat at a rate of3.0 °C (5.4 °F) for every 1,000 feet of altitude gain. No matterwhat causes the air to reach its saturation point, saturated airbrings clouds, rain, and other critical weather situations.<strong>11</strong>-14
Dew and FrostOn cool, calm nights, the temperature of the ground andobjects on the surface can cause temperatures of thesurrounding air to drop below the dew point. When thisoccurs, the moisture in the air condenses and deposits itself onthe ground, buildings, and other objects like cars and aircraft.This moisture is known as dew and sometimes can be seen ongrass in the morning. If the temperature is below freezing, themoisture is deposited in the form of frost. While dew poses nothreat to an aircraft, frost poses a definite flight safety hazard.Frost disrupts the flow of air over the wing and can drasticallyreduce the production of lift. It also increases drag, which,when combined with lowered lift production, can adverselyaffect the ability to take off. An aircraft must be thoroughlycleaned and free of frost prior to beginning a flight.FogFog is a cloud that begins within 50 feet of the surface. Ittypically occurs when the temperature of air near the groundis cooled to the air’s dew point. At this point, water vapor inthe air condenses and becomes visible in the form of fog. Fogis classified according to the manner in which it forms andis dependent upon the current temperature and the amountof water vapor in the air.On clear nights, with relatively little to no wind present,radiation fog may develop. [Figure <strong>11</strong>-21] Usually, it formsin low-lying areas like mountain valleys. This type of fogoccurs when the ground cools rapidly due to terrestrialradiation, and the surrounding air temperature reaches itsdew point. As the sun rises and the temperature increases,radiation fog lifts and eventually burns off. Any increase inwind also speeds the dissipation of radiation fog. If radiationfog is less than 20 feet thick, it is known as ground fog.When a layer of warm, moist air moves over a cold surface,advection fog is likely to occur. Unlike radiation fog, windis required to form advection fog. Winds of up to 15 knotsallow the fog to form and intensify; above a speed of 15 knots,the fog usually lifts and forms low stratus clouds. Advectionfog is common in coastal areas where sea breezes can blowthe air over cooler landmasses.Upslope fog occurs when moist, stable air is forced up slopingland features like a mountain range. This type of fog alsorequires wind for formation and continued existence. Upslopeand advection fog, unlike radiation fog, may not burn off withthe morning sun, but instead can persist for days. They canalso extend to greater heights than radiation fog.Steam fog, or sea smoke, forms when cold, dry air moves overwarm water. As the water evaporates, it rises and resemblessmoke. This type of fog is common over bodies of waterduring the coldest times of the year. Low-level turbulenceand icing are commonly associated with steam fog.Ice fog occurs in cold weather when the temperature ismuch below freezing and water vapor forms directly intoice crystals. Conditions favorable for its formation arethe same as for radiation fog except for cold temperature,usually –25 °F or colder. It occurs mostly in the arcticregions, but is not unknown in middle latitudes during thecold season.CloudsClouds are visible indicators and are often indicative offuture weather. For clouds to form, there must be adequatewater vapor and condensation nuclei, as well as a method bywhich the air can be cooled. When the air cools and reachesits saturation point, the invisible water vapor changes intoa visible state. Through the processes of deposition (alsoreferred to as sublimation) and condensation, moisturecondenses or sublimates onto miniscule particles of matterlike dust, salt, and smoke known as condensation nuclei. Thenuclei are important because they provide a means for themoisture to change from one state to another.Cloud type is determined by its height, shape, and behavior.They are classified according to the height of their bases aslow, middle, or high clouds, as well as clouds with verticaldevelopment. [Figure <strong>11</strong>-22]Figure <strong>11</strong>-21. Radiation fog.Low clouds are those that form near the Earth’s surface andextend up to 6,500 feet AGL. They are made primarily ofwater droplets, but can include supercooled water dropletsthat induce hazardous aircraft icing. Typical low cloudsare stratus, stratocumulus, and nimbostratus. Fog is alsoclassified as a type of low cloud formation. Clouds in thisfamily create low ceilings, hamper visibility, and can changerapidly. Because of this, they influence flight planning andcan make visual flight rules (VFR) flight impossible.<strong>11</strong>-15
Cirrostratus20,000 AGLAltostratus6,500 AGLStratusCirrocumulusStratocumulusAltocumulusCirrusNimbostratusLow clouds Middle clouds High cloudsCumulusCumulonimbusClouds with vertical developmentFigure <strong>11</strong>-22. Basic cloud types.Middle clouds form around 6,500 feet AGL and extend up to20,000 feet AGL. They are composed of water, ice crystals,and supercooled water droplets. Typical middle-level cloudsinclude altostratus and altocumulus. These types of cloudsmay be encountered on cross-country flights at higheraltitudes. Altostratus clouds can produce turbulence and maycontain moderate icing. Altocumulus clouds, which usuallyform when altostratus clouds are breaking apart, also maycontain light turbulence and icing.High clouds form above 20,000 feet AGL and usually formonly in stable air. They are made up of ice crystals and poseno real threat of turbulence or aircraft icing. Typical high levelclouds are cirrus, cirrostratus, and cirrocumulus.Clouds with extensive vertical development are cumulusclouds that build vertically into towering cumulus orcumulonimbus clouds. The bases of these clouds form inthe low to middle cloud base region but can extend into highaltitude cloud levels. Towering cumulus clouds indicate areasof instability in the atmosphere, and the air around and insidethem is turbulent. These types of clouds often develop intocumulonimbus clouds or thunderstorms. Cumulonimbusclouds contain large amounts of moisture and unstable air,and usually produce hazardous weather phenomena, suchas lightning, hail, tornadoes, gusty winds, and wind shear.These extensive vertical clouds can be obscured by othercloud formations and are not always visible from the groundor while in flight. When this happens, these clouds are said tobe embedded, hence the term, embedded thunderstorms.To pilots, the cumulonimbus cloud is perhaps the mostdangerous cloud type. It appears individually or in groups andis known as either an air mass or orographic thunderstorm.Heating of the air near the Earth’s surface creates an air massthunderstorm; the upslope motion of air in the mountainousregions causes orographic thunderstorms. Cumulonimbusclouds that form in a continuous line are nonfrontal bandsof thunderstorms or squall lines.Since rising air currents cause cumulonimbus clouds, theyare extremely turbulent and pose a significant hazard to flightsafety. For example, if an aircraft enters a thunderstorm, theaircraft could experience updrafts and downdrafts that exceed3,000 fpm. In addition, thunderstorms can produce largehailstones, damaging lightning, tornadoes, and large quantitiesof water, all of which are potentially hazardous to aircraft.A thunderstorm makes its way through three distinct stagesbefore dissipating. It begins with the cumulus stage, in<strong>11</strong>-16
which lifting action of the air begins. If sufficient moistureand instability are present, the clouds continue to increase invertical height. Continuous, strong updrafts prohibit moisturefrom falling. The updraft region grows larger than theindividual thermals feeding the storm. Within approximately15 minutes, the thunderstorm reaches the mature stage, whichis the most violent time period of the thunderstorm’s lifecycle. At this point, drops of moisture, whether rain or ice,are too heavy for the cloud to support and begin falling in theform of rain or hail. This creates a downward motion of theair. Warm, rising air; cool, precipitation-induced descendingair; and violent turbulence all exist within and near the cloud.Below the cloud, the down-rushing air increases surfacewinds and decreases the temperature. Once the verticalmotion near the top of the cloud slows down, the top of thecloud spreads out and takes on an anvil-like shape. At thispoint, the storm enters the dissipating stage. This is whenthe downdrafts spread out and replace the updrafts neededto sustain the storm. [Figure <strong>11</strong>-23]It is impossible to fly over thunderstorms in light aircraft.Severe thunderstorms can punch through the tropopause andreach staggering heights of 50,000 to 60,000 feet dependingon latitude. Flying under thunderstorms can subject aircraftto rain, hail, damaging lightning, and violent turbulence.A good rule of thumb is to circumnavigate thunderstormsidentified as severe or giving an intense radar echo by atleast 20 nautical miles (NM) since hail may fall for milesoutside of the clouds. If flying around a thunderstorm is notan option, stay on the ground until it passes.Cloud classification can be further broken down into specificcloud types according to the outward appearance and cloudcomposition. Knowing these terms can help a pilot identifyvisible clouds.The following is a list of cloud classifications:• Cumulus—heaped or piled clouds• Stratus—formed in layers• Cirrus—ringlets, fibrous clouds, also high level cloudsabove 20,000 feet• Castellanus—common base with separate verticaldevelopment, castle-like• Lenticularus—lens shaped, formed over mountains instrong winds• Nimbus—rain-bearing clouds• Fracto—ragged or broken• Alto—meaning high, also middle level clouds existingat 5,000 to 20,000 feetCeilingFor aviation purposes, a ceiling is the lowest layer of cloudsreported as being broken or overcast, or the vertical visibilityinto an obscuration like fog or haze. Clouds are reportedCumulus Stage (3-5 mile height) Mature Stage (5-10 mile height) Dissipating Stage (5-7 mile height)40,000 ft.Equilibrium level30,000 ft.20,000 ft.32 °F0 °C10,000 ft.5,000 ft.Figure <strong>11</strong>-23. Life cycle of a thunderstorm.<strong>11</strong>-17
as broken when five-eighths to seven-eighths of the sky iscovered with clouds. Overcast means the entire sky is coveredwith clouds. Current ceiling information is reported by theaviation routine weather report (METAR) and automatedweather stations of various types.VisibilityClosely related to cloud cover and reported ceilings isvisibility information. Visibility refers to the greatesthorizontal distance at which prominent objects can beviewed with the naked eye. Current visibility is also reportedin METAR and other aviation weather reports, as well asby automated weather systems. Visibility information, aspredicted by meteorologists, is available for a pilot during apreflight weather briefing.PrecipitationPrecipitation refers to any type of water particles that form inthe atmosphere and fall to the ground. It has a profound impacton flight safety. Depending on the form of precipitation, it canreduce visibility, create icing situations, and affect landingand takeoff performance of an aircraft.Precipitation occurs because water or ice particles in cloudsgrow in size until the atmosphere can no longer support them.It can occur in several forms as it falls toward the Earth,including drizzle, rain, ice pellets, hail, snow, and ice.Drizzle is classified as very small water droplets, smallerthan 0.02 inches in diameter. Drizzle usually accompaniesfog or low stratus clouds. Water droplets of larger size arereferred to as rain. Rain that falls through the atmosphere butevaporates prior to striking the ground is known as virga.Freezing rain and freezing drizzle occur when the temperatureof the surface is below freezing; the rain freezes on contactwith the cooler surface.If rain falls through a temperature inversion, it may freeze asit passes through the underlying cold air and fall to the groundin the form of ice pellets. Ice pellets are an indication of atemperature inversion and that freezing rain exists at a higheraltitude. In the case of hail, freezing water droplets are carriedup and down by drafts inside clouds, growing larger in size asthey come in contact with more moisture. Once the updraftscan no longer hold the freezing water, it falls to the Earth inthe form of hail. Hail can be pea sized, or it can grow as largeas five inches in diameter, larger than a softball.Snow is precipitation in the form of ice crystals that fallsat a steady rate or in snow showers that begin, change inintensity, and end rapidly. Falling snow also varies in size,being very small grains or large flakes. Snow grains are theequivalent of drizzle in size.Precipitation in any form poses a threat to safety of flight.Often, precipitation is accompanied by low ceilings andreduced visibility. Aircraft that have ice, snow, or frost ontheir surfaces must be carefully cleaned prior to beginninga flight because of the possible airflow disruption andloss of lift. Rain can contribute to water in the fuel tanks.Precipitation can create hazards on the runway surface itself,making takeoffs and landings difficult, if not impossible, dueto snow, ice, or pooling water and very slick surfaces.Air MassesAir masses are classified according to the regions wherethey originate. They are large bodies of air that take on thecharacteristics of the surrounding area, or source region. Asource region is typically an area in which the air remainsrelatively stagnant for a period of days or longer. Duringthis time of stagnation, the air mass takes on the temperatureand moisture characteristics of the source region. Areas ofstagnation can be found in polar regions, tropical oceans, anddry deserts. Air masses are generally identified as polar ortropical based on temperature characteristics and maritimeor continental based on moisture content.A continental polar air mass forms over a polar region andbrings cool, dry air with it. Maritime tropical air masses formover warm tropical waters like the Caribbean Sea and bringwarm, moist air. As the air mass moves from its source regionand passes over land or water, the air mass is subjected to thevarying conditions of the land or water, and these modify thenature of the air mass. [Figure <strong>11</strong>-24]An air mass passing over a warmer surface is warmed frombelow, and convective currents form, causing the air to rise.This creates an unstable air mass with good surface visibility.Moist, unstable air causes cumulus clouds, showers, andturbulence to form.Conversely, an air mass passing over a colder surface does notform convective currents, but instead creates a stable air masswith poor surface visibility. The poor surface visibility is dueto the fact that smoke, dust, and other particles cannot riseout of the air mass and are instead trapped near the surface.A stable air mass can produce low stratus clouds and fog.FrontsAs an air mass moves across bodies of water and land, iteventually comes in contact with another air mass withdifferent characteristics. The boundary layer between two typesof air masses is known as a front. An approaching front of anytype always means changes to the weather are imminent.<strong>11</strong>-18
AcPNote standard air mass abbreviations: arctic (A), continental polar(cP), maritime polar (mP), continental tropical (cT), and maritimetropical (mT).mPmPmTcTmTmTFigure <strong>11</strong>-24. North American air mass source regions.There are four types of fronts, which are named accordingto the temperature of the advancing air relative to thetemperature of the air it is replacing: [Figure <strong>11</strong>-25]• Warm• Cold• Stationary• OccludedAny discussion of frontal systems must be tempered withthe knowledge that no two fronts are the same. However,generalized weather conditions are associated with a specifictype of front that helps identify the front.Table ASymbols for surface fronts and other significant linesshown on the surface analysis chartWarm front (red)*Cold front (blue)*Stationary front (red/blue)*Occluded front (purple)** Note: Fronts may be black and white or color, depending on theirsource. Also, fronts shown in color code will not necessarily showfrontal symbols.Figure <strong>11</strong>-25. Common chart symbology to depict weather frontlocation.Warm FrontA warm front occurs when a warm mass of air advancesand replaces a body of colder air. Warm fronts move slowly,typically 10 to 25 miles per hour (mph). The slope of theadvancing front slides over the top of the cooler air andgradually pushes it out of the area. Warm fronts contain warmair that often have very high humidity. As the warm air islifted, the temperature drops and condensation occurs.Generally, prior to the passage of a warm front, cirriformor stratiform clouds, along with fog, can be expected toform along the frontal boundary. In the summer months,cumulonimbus clouds (thunderstorms) are likely to develop.Light to moderate precipitation is probable, usually in theform of rain, sleet, snow, or drizzle, accentuated by poorvisibility. The wind blows from the south-southeast, and theoutside temperature is cool or cold, with an increasing dewpoint. Finally, as the warm front approaches, the barometricpressure continues to fall until the front passes completely.During the passage of a warm front, stratiform clouds arevisible and drizzle may be falling. The visibility is generallypoor, but improves with variable winds. The temperaturerises steadily from the inflow of relatively warmer air. Forthe most part, the dew point remains steady and the pressurelevels off.<strong>11</strong>-19
After the passage of a warm front, stratocumulus cloudspredominate and rain showers are possible. The visibilityeventually improves, but hazy conditions may exist for ashort period after passage. The wind blows from the southsouthwest.With warming temperatures, the dew pointrises and then levels off. There is generally a slight rise inbarometric pressure, followed by a decrease of barometricpressure.Flight Toward an Approaching Warm FrontBy studying a typical warm front, much can be learned aboutthe general patterns and atmospheric conditions that existwhen a warm front is encountered in flight. Figure <strong>11</strong>-26depicts a warm front advancing eastward from St. Louis,Missouri, toward Pittsburgh, Pennsylvania.At the time of departure from Pittsburgh, the weather isgood VFR with a scattered layer of cirrus clouds at 15,000feet. As the flight progresses westward to Columbus andcloser to the oncoming warm front, the clouds deepen andbecome increasingly stratiform in appearance with a ceilingof 6,000 feet. The visibility decreases to six miles in hazewith a falling barometric pressure. Approaching Indianapolis,the weather deteriorates to broken clouds at 2,000 feet withthree miles visibility and rain. With the temperature and dewpoint the same, fog is likely. At St. Louis, the sky is overcastwith low clouds and drizzle and the visibility is one mile.Beyond Indianapolis, the ceiling and visibility would be toolow to continue VFR. Therefore, it would be wise to remainin Indianapolis until the warm front had passed, which mightrequire a day or two.Cold FrontA cold front occurs when a mass of cold, dense, and stableair advances and replaces a body of warmer air.Cold fronts move more rapidly than warm fronts, progressingat a rate of 25 to 30 mph. However, extreme cold frontshave been recorded moving at speeds of up to 60 mph.A typical cold front moves in a manner opposite that of awarm front. It is so dense, it stays close to the ground andacts like a snowplow, sliding under the warmer air andforcing the less dense air aloft. The rapidly ascending aircauses the temperature to decrease suddenly, forcing thecreation of clouds. The type of clouds that form dependson the stability of the warmer air mass. A cold front in theNorthern Hemisphere is normally oriented in a northeast tosouthwest manner and can be several hundred miles long,encompassing a large area of land.CIRRUSWARM AIRALTOSTRATUSCIRROSTRATUSNIMBOSTRATUSCOLD AIRSt. LouisIndianapolis200 milesColumbus400 milesPittsburgh600 miles999 1002 1005 1008 10<strong>11</strong> 1014999100265 0201651010 St. Louis59 0683 4059 56125206 2650 60IndianapolisColumbus531034166181017PittsburghMETAR KSTL 1950Z 21018KT 1SM –RA0VC010 18/18 A2960METAR KIND 1950Z 16012KT 3SM RABKN020 15/15 A2973METAR KCMH 1950Z 13018KT 6SM HZ0VC060 14/10 A29901005METAR KPIT 1950Z 13012KT 10SMSCT150 12/01 A30021008 10<strong>11</strong> 1014 1017Figure <strong>11</strong>-26. Warm front cross-section with surface weather chart depiction and associated METAR.<strong>11</strong>-20
Prior to the passage of a typical cold front, cirriform ortowering cumulus clouds are present, and cumulonimbusclouds are possible. Rain showers and haze are possible dueto the rapid development of clouds. The wind from the southsouthwesthelps to replace the warm temperatures with therelative colder air. A high dew point and falling barometricpressure are indicative of imminent cold front passage.As the cold front passes, towering cumulus or cumulonimbusclouds continue to dominate the sky. Depending on theintensity of the cold front, heavy rain showers form andmight be accompanied by lightning, thunder, and/or hail.More severe cold fronts can also produce tornadoes. Duringcold front passage, the visibility is poor, with winds variableand gusty, and the temperature and dew point drop rapidly.A quickly falling barometric pressure bottoms out duringfrontal passage, then begins a gradual increase.After frontal passage, the towering cumulus and cumulonimbusclouds begin to dissipate to cumulus clouds with a correspondingdecrease in the precipitation. Good visibility eventuallyprevails with the winds from the west-northwest. Temperaturesremain cooler and the barometric pressure continues to rise.Fast-Moving Cold FrontFast-moving cold fronts are pushed by intense pressuresystems far behind the actual front. The friction betweenthe ground and the cold front retards the movement of thefront and creates a steeper frontal surface. This results in avery narrow band of weather, concentrated along the leadingedge of the front. If the warm air being overtaken by thecold front is relatively stable, overcast skies and rain mayoccur for some distance ahead of the front. If the warm airis unstable, scattered thunderstorms and rain showers mayform. A continuous line of thunderstorms, or squall line,may form along or ahead of the front. Squall lines presenta serious hazard to pilots as squall type thunderstorms areintense and move quickly. Behind a fast-moving cold front,the skies usually clear rapidly and the front leaves behindgusty, turbulent winds and colder temperatures.Flight Toward an Approaching Cold FrontLike warm fronts, not all cold fronts are the same. Examininga flight toward an approaching cold front, pilots can get abetter understanding of the type of conditions that can beencountered in flight. Figure <strong>11</strong>-27 shows a flight fromPittsburgh, Pennsylvania, toward St. Louis, Missouri.COLD AIRWARM AIRCUMULONIMBUSSt. LouisIndianapolis200 milesColumbus400 milesPittsburgh600 miles10<strong>11</strong>100846103306642100510St. Louis1005100874 071371 477 1026 875 12210733 12702535Indianapolis Columbus Pittsburgh10<strong>11</strong>1014METAR KSTL 1950Z 30018KT 10SMSCT010 08/02 A2979METAR KIND 1950Z 20024KT 3SM +TSRAOVC010 24/23 A2974METAR KCMH 1950Z 20012KT 6SM HZBKN025 25/24 A298310<strong>11</strong> 10<strong>11</strong> 1014METAR KPIT 1950Z 20012KT 3SM FUSCT035 24/22 A2989Figure <strong>11</strong>-27. Cold front cross-section with surface weather chart depiction and associated METAR.<strong>11</strong>-21
At the time of departure from Pittsburgh, the weather is VFRwith three miles visibility in smoke and a scattered layer ofclouds at 3,500 feet. As the flight progresses westward toColumbus and closer to the oncoming cold front, the cloudsshow signs of vertical development with a broken layer at2,500 feet. The visibility is six miles in haze with a fallingbarometric pressure. Approaching Indianapolis, the weatherhas deteriorated to overcast clouds at 1,000 feet, and threemiles visibility with thunderstorms and heavy rain showers.At St. Louis, the weather gets better with scattered clouds at1,000 feet and a ten mile visibility.A pilot using sound judgment based on the knowledge offrontal conditions would most likely remain in Indianapolisuntil the front had passed. Trying to fly below a line ofthunderstorms or a squall line is hazardous, and flight overthe top of or around the storm is not an option. Thunderstormscan extend up to well over the capability of small airplanesand can extend in a line for 300 to 500 miles.Comparison of Cold and Warm FrontsWarm fronts and cold fronts are very different in nature asare the hazards associated with each front. They vary inspeed, composition, weather phenomenon, and prediction.Cold fronts, which move at 20 to 35 mph, move very quicklyin comparison to warm fronts, which move at only 10 to25 mph. Cold fronts also possess a steeper frontal slope.Violent weather activity is associated with cold fronts, andthe weather usually occurs along the frontal boundary, not inadvance. However, squall lines can form during the summermonths as far as 200 miles in advance of a severe cold front.Whereas warm fronts bring low ceilings, poor visibility,and rain, cold fronts bring sudden storms, gusty winds,turbulence, and sometimes hail or tornadoes.Cold fronts are fast approaching with little or no warning, andthey make a complete weather change in just a few hours.The weather clears rapidly after passage and drier air withunlimited visibilities prevail. Warm fronts, on the other hand,provide advance warning of their approach and can take daysto pass through a region.Wind ShiftsWind around a high pressure system rotates in a clockwisefashion, while low pressure winds rotate in a counterclockwisemanner. When two pressure systems are adjacent,the winds are almost in direct opposition to each other atthe point of contact. Fronts are the boundaries between twoareas of pressure, and therefore, wind shifts are continuallyoccurring within a front. Shifting wind direction is mostpronounced in conjunction with cold fronts.Stationary FrontWhen the forces of two air masses are relatively equal, theboundary or front that separates them remains stationary andinfluences the local weather for days. This front is called astationary front. The weather associated with a stationaryfront is typically a mixture that can be found in both warmand cold fronts.Occluded FrontAn occluded front occurs when a fast-moving cold frontcatches up with a slow-moving warm front. As the occludedfront approaches, warm front weather prevails, but isimmediately followed by cold front weather. There are twotypes of occluded fronts that can occur, and the temperaturesof the colliding frontal systems play a large part in definingthe type of front and the resulting weather. A cold frontocclusion occurs when a fast moving cold front is colderthan the air ahead of the slow moving warm front. Whenthis occurs, the cold air replaces the cool air and forces thewarm front aloft into the atmosphere. Typically, the coldfront occlusion creates a mixture of weather found in bothwarm and cold fronts, providing the air is relatively stable.A warm front occlusion occurs when the air ahead of thewarm front is colder than the air of the cold front. When thisis the case, the cold front rides up and over the warm front. Ifthe air forced aloft by the warm front occlusion is unstable,the weather is more severe than the weather found in a coldfront occlusion. Embedded thunderstorms, rain, and fog arelikely to occur.Figure <strong>11</strong>-28 depicts a cross-section of a typical cold frontocclusion. The warm front slopes over the prevailing coolerair and produces the warm front type weather. Prior to thepassage of the typical occluded front, cirriform and stratiformclouds prevail, light to heavy precipitation is falling, visibilityis poor, dew point is steady, and barometric pressure isfalling. During the passage of the front, nimbostratus andcumulonimbus clouds predominate, and towering cumulusmay also be possible. Light to heavy precipitation is falling,visibility is poor, winds are variable, and the barometricpressure is leveling off. After the passage of the front,nimbostratus and altostratus clouds are visible, precipitationis decreasing and clearing, and visibility is improving.ThunderstormsFor a thunderstorm to form, the air must have sufficient watervapor, an unstable lapse rate, and an initial lifting action tostart the storm process. Some storms occur at random inunstable air, last for only an hour or two, and produce onlymoderate wind gusts and rainfall. These are known as air<strong>11</strong>-22
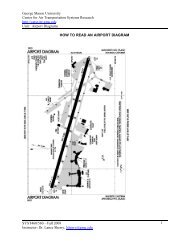
CUMULONIMBUSWARM AIRCIRROSTRATUSCIRRUSALTOSTRATUSCOLD AIRNIMBOSTRATUSCOLD AIRSt. LouisIndianapolis200 milesColumbus400 milesPittsburgh600 miles1006 1005 1002999999 1002 1005 100610<strong>11</strong>101410171020METAR KSTL 1950Z 31023G40KT 8SMSCT035 05/M03 A297642 0768 3226St. Louis661 26220588Indianapolis5225<strong>11</strong>4234Columbus4774020020Pittsburgh1023METAR KIND 1950Z 29028G45KT 1/2SM TSRAGRVV005 18/16 A2970METAR KCMH 1950Z 16017KT 2SM BROVC080 <strong>11</strong>/10 A297010<strong>11</strong> 1014 1017 1020 1023METAR KPIT 1950Z 13012KT 75SMBKN130 08/04 A3012Figure <strong>11</strong>-28. Occluded front cross-section with a weather chart depiction and associated METAR.mass thunderstorms and are generally a result of surfaceheating. Steady-state thunderstorms are associated withweather systems. Fronts, converging winds, and troughs aloftforce upward motion spawning these storms which oftenform into squall lines. In the mature stage, updrafts becomestronger and last much longer than in air mass storms, hencethe name steady state. [Figure <strong>11</strong>-29]Knowledge of thunderstorms and the hazards associated withthem is critical to the safety of flight.Hazards<strong>Weather</strong> can pose serious hazards to flight and a thunderstormpacks just about every weather hazard known to aviation intoone vicious bundle. These hazards occur individually or incombinations and most can be found in a squall line.Squall LineA squall line is a narrow band of active thunderstorms. Oftenit develops on or ahead of a cold front in moist, unstableair, but it may develop in unstable air far removed fromany front. The line may be too long to detour easily and toowide and severe to penetrate. It often contains steady-statethunderstorms and presents the single most intense weatherhazard to aircraft. It usually forms rapidly, generally reachingmaximum intensity during the late afternoon and the first fewhours of darkness.TornadoesThe most violent thunderstorms draw air into their cloud baseswith great vigor. If the incoming air has any initial rotatingmotion, it often forms an extremely concentrated vortex fromthe surface well into the cloud. Meteorologists have estimatedthat wind in such a vortex can exceed 200 knots with pressureinside the vortex quite low. The strong winds gather dustand debris and the low pressure generates a funnel-shapedcloud extending downward from the cumulonimbus base. Ifthe cloud does not reach the surface, it is a funnel cloud; ifit touches a land surface, it is a tornado.Tornadoes occur with both isolated and squall linethunderstorms. Reports for forecasts of tornadoes indicate thatatmospheric conditions are favorable for violent turbulence.An aircraft entering a tornado vortex is almost certain tosuffer structural damage. Since the vortex extends well intothe cloud, any pilot inadvertently caught on instruments in asevere thunderstorm could encounter a hidden vortex.Families of tornadoes have been observed as appendages ofthe main cloud extending several miles outward from the area<strong>11</strong>-23
AnvilHailMOVEMENT OF STORMFigure <strong>11</strong>-29. Movement and turbulence of a maturing thunderstorm.of lightning and precipitation. Thus, any cloud connected toa severe thunderstorm carries a threat of violence.TurbulencePotentially hazardous turbulence is present in allthunderstorms, and a severe thunderstorm can destroy anaircraft. Strongest turbulence within the cloud occurs withshear between updrafts and downdrafts. Outside the cloud,shear turbulence has been encountered several thousand feetabove and 20 miles laterally from a severe storm. A low-levelturbulent area is the shear zone associated with the gust front.Often, a “roll cloud” on the leading edge of a storm marks thetop of the eddies in this shear and it signifies an extremelyturbulent zone. Gust fronts often move far ahead (up to 15miles) of associated precipitation. The gust front causes arapid and sometimes drastic change in surface wind ahead ofan approaching storm. Advisory Circular (AC) 00-50A, LowLevel Wind Shear, explains in detail the hazards associatedwith gust fronts. Figure 1 in the AC shows a schematic trusssection of a thunderstorm with areas outside the cloud whereturbulence may be encountered.IcingUpdrafts in a thunderstorm support abundant liquid waterwith relatively large droplet sizes. When carried abovethe freezing level, the water becomes supercooled. Whentemperature in the upward current cools to about –15 °C,much of the remaining water vapor sublimates as ice crystals.Above this level, at lower temperatures, the amount ofsupercooled water decreases.Supercooled water freezes on impact with an aircraft. Clearicing can occur at any altitude above the freezing level, but athigh levels, icing from smaller droplets may be rime or mixedrime and clear ice. The abundance of large, supercooledwater droplets makes clear icing very rapid between 0 °C and–15 °C and encounters can be frequent in a cluster of cells.Thunderstorm icing can be extremely hazardous.Thunderstorms are not the only area where pilots couldencounter icing conditions. Pilots should be alert for icinganytime the temperature approaches 0 °C and visible moistureis present.HailHail competes with turbulence as the greatest thunderstormhazard to aircraft. Supercooled drops above the freezing levelbegin to freeze. Once a drop has frozen, other drops latch onand freeze to it, so the hailstone grows—sometimes into ahuge ice ball. Large hail occurs with severe thunderstormswith strong updrafts that have built to great heights.Eventually, the hailstones fall, possibly some distance fromthe storm core. Hail may be encountered in clear air severalmiles from thunderstorm clouds.<strong>11</strong>-24
As hailstones fall through air whose temperature is above0 °C, they begin to melt and precipitation may reach theground as either hail or rain. Rain at the surface does notmean the absence of hail aloft. Possible hail should beanticipated with any thunderstorm, especially beneath theanvil of a large cumulonimbus. Hailstones larger than onehalfinch in diameter can significantly damage an aircraftin a few seconds.Ceiling and VisibilityGenerally, visibility is near zero within a thunderstormcloud. Ceiling and visibility also may be restricted inprecipitation and dust between the cloud base and the ground.The restrictions create the same problem as all ceiling andvisibility restrictions; but the hazards are multiplied whenassociated with the other thunderstorm hazards of turbulence,hail, and lightning.Effect on AltimetersPressure usually falls rapidly with the approach of athunderstorm, rises sharply with the onset of the first gustand arrival of the cold downdraft and heavy rain showers,and then falls back to normal as the storm moves on. Thiscycle of pressure change may occur in 15 minutes. If the pilotdoes not receive a corrected altimeter setting, the altimetermay be more than 100 feet in error.Engine Water IngestionTurbine engines have a limit on the amount of water theycan ingest. Updrafts are present in many thunderstorms,particularly those in the developing stages. If the updraftvelocity in the thunderstorm approaches or exceeds theterminal velocity of the falling raindrops, very highconcentrations of water may occur. It is possible that theseconcentrations can be in excess of the quantity of waterturbine engines are designed to ingest. Therefore, severethunderstorms may contain areas of high water concentrationwhich could result in flameout and/or structural failure ofone or more engines.<strong>Chapter</strong> SummaryKnowledge of the atmosphere and the forces acting withinit to create weather is essential to understand how weatheraffects a flight. By understanding basic weather theories, apilot can make sound decisions during flight planning afterreceiving weather briefings. For additional information onthe topics discussed in this chapter, see AC 00-6, Aviation<strong>Weather</strong> For Pilots and Flight Operations Personnel;AC 00-24, Thunderstorms; AC 00-45, Aviation <strong>Weather</strong>Services; AC 91-74, Pilot Guide Flight in Icing Conditions;and chapter 7, section 2 of the Aeronautical InformationManual (AIM).LightningA lightning strike can puncture the skin of an aircraftand damage communications and electronic navigationalequipment. Although lightning has been suspected of ignitingfuel vapors and causing an explosion, serious accidents dueto lightning strikes are rare. Nearby lightning can blind thepilot, rendering him or her momentarily unable to navigateeither by instrument or by visual reference. Nearby lightningcan also induce permanent errors in the magnetic compass.Lightning discharges, even distant ones, can disrupt radiocommunications on low and medium frequencies. Thoughlightning intensity and frequency have no simple relationshipto other storm parameters, severe storms, as a rule, have ahigh frequency of lightning.<strong>11</strong>-25
<strong>11</strong>-26