The Nigerian Accountant 2012 October/December Edition
The Nigerian Accountant 2012 October/December Edition
The Nigerian Accountant 2012 October/December Edition

You also want an ePaper? Increase the reach of your titles
YUMPU automatically turns print PDFs into web optimized ePapers that Google loves.
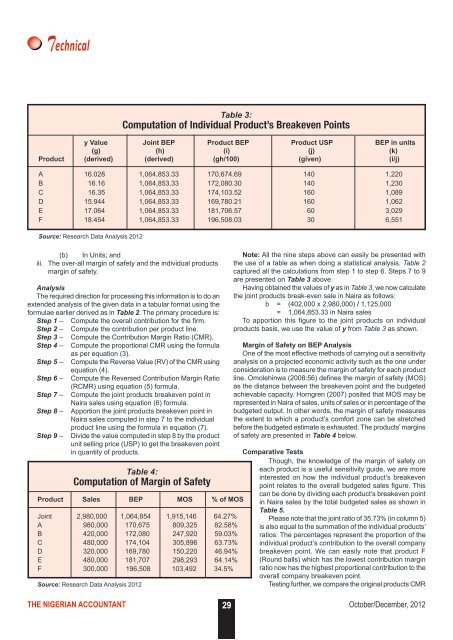
TechnicalTable 3:Computation of Individual Product’s Breakeven Pointsy Value Joint BEP Product BEP Product USP BEP in units(g) (h) (i) (j) (k)Product (derived) (derived) (gh/100) (given) (i/j)A 16.028 1,064,853.33 170,674.69 140 1,220B 16.16 1,064,853.33 172,080.30 140 1,230C 16.35 1,064,853.33 174,103.52 160 1,089D 15.944 1,064,853.33 169,780.21 160 1,062E 17.064 1,064,853.33 181,706.57 60 3,029F 18.454 1,064,853.33 196,508.03 30 6,551Source: Research Data Analysis <strong>2012</strong>(b) In Units; andiii. <strong>The</strong> over-all margin of safety and the individual productsmargin of safety.Analysis<strong>The</strong> required direction for processing this information is to do anextended analysis of the given data in a tabular format using theformulae earlier derived as in Table 2. <strong>The</strong> primary procedure is:Step 1 – Compute the overall contribution for the firm.Step 2 – Compute the contribution per product line.Step 3 – Compute the Contribution Margin Ratio (CMR).Step 4 – Compute the proportional CMR using the formulaas per equation (3).Step 5 – Compute the Reverse Value (RV) of the CMR usingequation (4).Step 6 – Compute the Reversed Contribution Margin Ratio(RCMR) using equation (5) formula.Step 7 – Compute the joint products breakeven point inNaira sales using equation (6) formula.Step 8 – Apportion the joint products breakeven point inNaira sales computed in step 7 to the individualproduct line using the formula in equation (7).Step 9 – Divide the value computed in step 8 by the productunit selling price (USP) to get the breakeven pointin quantity of products.Note: All the nine steps above can easily be presented withthe use of a table as when doing a statistical analysis. Table 2captured all the calculations from step 1 to step 6. Steps 7 to 9are presented on Table 3 above.Having obtained the values of y as in Table 3, we now calculatethe joint products break-even sale in Naira as follows:b = (402,000 x 2,980,000) / 1,125,000= 1,064,853.33 in Naira salesTo apportion this figure to the joint products on individualproducts basis, we use the value of y from Table 3 as shown.Margin of Safety on BEP AnalysisOne of the most effective methods of carrying out a sensitivityanalysis on a projected economic activity such as the one underconsideration is to measure the margin of safety for each productline. Omolehinwa (2008:56) defines the margin of safety (MOS)as the distance between the breakeven point and the budgetedachievable capacity. Horngren (2007) posited that MOS may berepresented in Naira of sales, units of sales or in percentage of thebudgeted output. In other words, the margin of safety measuresthe extent to which a product’s comfort zone can be stretchedbefore the budgeted estimate is exhausted. <strong>The</strong> products’ marginsof safety are presented in Table 4 below.Comparative TestsThough, the knowledge of the margin of safety onTable 4:each product is a useful sensitivity guide, we are moreinterested on how the individual product’s breakevenComputation of Margin of Safetypoint relates to the overall budgeted sales figure. ThisProduct Sales BEP MOS % of MOScan be done by dividing each product’s breakeven pointin Naira sales by the total budgeted sales as shown inTable 5.Joint 2,980,000 1,064,854 1,915,146 64.27% Please note that the joint ratio of 35.73% (in column 5)A 980,000 170,675 809,325 82.58% is also equal to the summation of the individual products’B 420,000 172,080 247,920 59.03% ratios. <strong>The</strong> percentages represent the proportion of theC 480,000 174,104 305,896 63.73% individual product’s contribution to the overall companyD 320,000 169,780 150,220 46.94% breakeven point. We can easily note that product FE 480,000 181,707 298,293 64.14% (Round balls) which has the lowest contribution marginF 300,000 196,508 103,492 34.5% ratio now has the highest proportional contribution to theoverall company breakeven point.Source: Research Data Analysis <strong>2012</strong>Testing further, we compare the original products CMRTHE NIGERIAN ACCOUNTANT 29<strong>October</strong>/<strong>December</strong>, <strong>2012</strong>