The Nigerian Accountant 2012 October/December Edition
The Nigerian Accountant 2012 October/December Edition
The Nigerian Accountant 2012 October/December Edition

You also want an ePaper? Increase the reach of your titles
YUMPU automatically turns print PDFs into web optimized ePapers that Google loves.
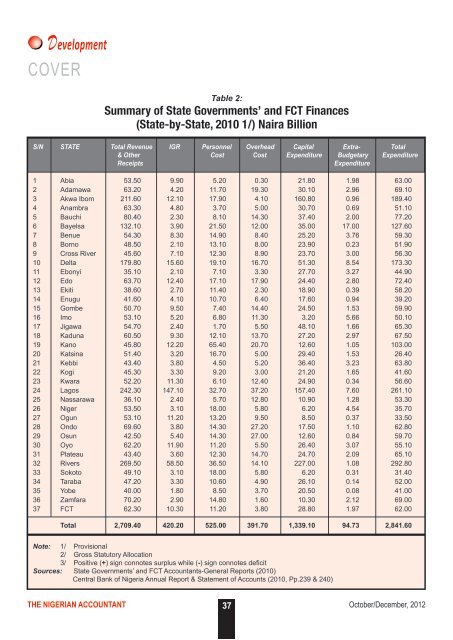
DevelopmentCOVERTable 2:Summary of State Governments’ and FCT Finances(State-by-State, 2010 1/) Naira BillionS/N STATE Total Revenue IGR Personnel Overhead Capital Extra- Total& Other Cost Cost Expenditure Budgetary ExpenditureReceiptsExpenditure1 Abia 53.50 9.90 5.20 0.30 21.80 1.98 63.002 Adamawa 63.20 4.20 11.70 19.30 30.10 2.96 69.103 Akwa Ibom 211.60 12.10 17.90 4.10 160.80 0.96 189.404 Anambra 63.30 4.80 3.70 5.00 30.70 0.69 51.105 Bauchi 80.40 2.30 8.10 14.30 37.40 2.00 77.206 Bayelsa 132.10 3.90 21.50 12.00 35.00 17.00 127.607 Benue 54.30 8.30 14.90 8.40 25.20 3.76 59.308 Borno 48.50 2.10 13.10 8.00 23.90 0.23 51.909 Cross River 45.60 7.10 12.30 8.90 23.70 3.00 56.3010 Delta 179.80 15.60 19.10 16.70 51.30 8.54 173.3011 Ebonyi 35.10 2.10 7.10 3.30 27.70 3.27 44.9012 Edo 63.70 12.40 17.10 17.90 24.40 2.80 72.4013 Ekiti 38.60 2.70 11.40 2.30 18.90 0.39 58.2014 Enugu 41.60 4.10 10.70 6.40 17.60 0.94 39.2015 Gombe 50.70 9.50 7.40 14.40 24.50 1.53 59.9016 Imo 53.10 5.20 6.80 11.30 3.20 5.66 50.1017 Jigawa 54.70 2.40 1.70 5.50 48.10 1.66 65.3018 Kaduna 60.50 9.30 12.10 13.70 27.20 2.97 67.5019 Kano 45.80 12.20 65.40 20.70 12.60 1.05 103.0020 Katsina 51.40 3.20 16.70 5.00 29.40 1.53 26.4021 Kebbi 43.40 3.80 4.50 5.20 36.40 3.23 63.8022 Kogi 45.30 3.30 9.20 3.00 21.20 1.65 41.6023 Kwara 52.20 11.30 6.10 12.40 24.90 0.34 56.6024 Lagos 242.30 147.10 32.70 37.20 157.40 7.60 261.1025 Nassarawa 36.10 2.40 5.70 12.80 10.90 1.28 53.3026 Niger 53.50 3.10 18.00 5.80 6.20 4.54 35.7027 Ogun 53.10 11.20 13.20 9.50 8.50 0.37 33.5028 Ondo 69.60 3.80 14.30 27.20 17.50 1.10 62.8029 Osun 42.50 5.40 14.30 27.00 12.60 0.84 59.7030 Oyo 62.20 11.90 11.20 5.50 26.40 3.07 55.1031 Plateau 43.40 3.60 12.30 14.70 24.70 2.09 65.1032 Rivers 269.50 58.50 36.50 14.10 227.00 1.08 292.8033 Sokoto 49.10 3.10 18.00 5.80 6.20 0.31 31.4034 Taraba 47.20 3.30 10.60 4.90 26.10 0.14 52.0035 Yobe 40.00 1.80 8.50 3.70 20.50 0.08 41.0036 Zamfara 70.20 2.90 14.80 1.60 10.30 2.12 69.0037 FCT 62.30 10.30 11.20 3.80 28.80 1.97 62.00Total 2,709.40 420.20 525.00 391.70 1,339.10 94.73 2,841.60Note: 1/ Provisional2/ Gross Statutory Allocation3/ Positive (+) sign connotes surplus while (-) sign connotes deficitSources: State Governments’ and FCT <strong>Accountant</strong>s-General Reports (2010)Central Bank of Nigeria Annual Report & Statement of Accounts (2010, Pp.239 & 240)THE NIGERIAN ACCOUNTANT 37<strong>October</strong>/<strong>December</strong>, <strong>2012</strong>