Kreinhop Elementary - Klein ISD
Kreinhop Elementary - Klein ISD
Kreinhop Elementary - Klein ISD

You also want an ePaper? Increase the reach of your titles
YUMPU automatically turns print PDFs into web optimized ePapers that Google loves.
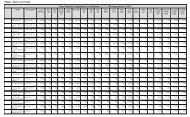
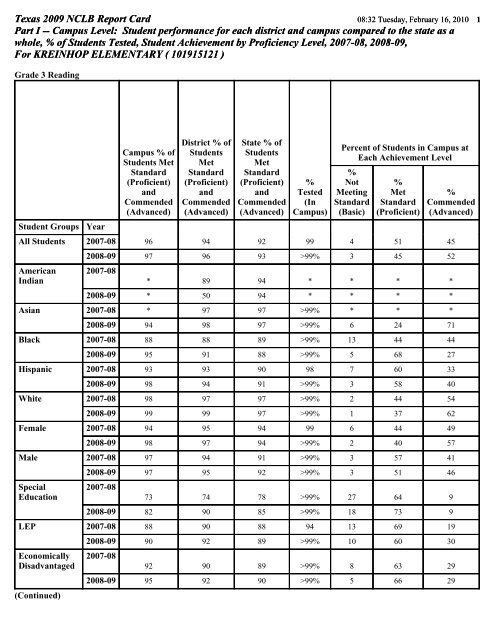
Texas 2009 NCLB Report Card 08:32 Tuesday, February 16, 2010 1Part I -- Campus Level: Student performance for each district and campus compared to the state as awhole, % of Students Tested, Student Achievement by Proficiency Level, 2007-08, 2008-09,For KREINHOP ELEMENTARY ( 101915121 )Grade 3 ReadingStudent GroupsYearCampus % ofStudents MetStandard(Proficient)andCommended(Advanced)District % ofStudentsMetStandard(Proficient)andCommended(Advanced)State % ofStudentsMetStandard(Proficient)andCommended(Advanced)%Tested(InCampus)Percent of Students in Campus atEach Achievement Level%NotMeetingStandard(Basic)%MetStandard(Proficient)%Commended(Advanced)All Students 2007-08 96 94 92 99 4 51 45AmericanIndian2008-09 97 96 93 >99% 3 45 522007-08* 89 94 * * * *2008-09 * 50 94 * * * *Asian 2007-08 * 97 97 >99% * * *2008-09 94 98 97 >99% 6 24 71Black 2007-08 88 88 89 >99% 13 44 442008-09 95 91 88 >99% 5 68 27Hispanic 2007-08 93 93 90 98 7 60 332008-09 98 94 91 >99% 3 58 40White 2007-08 98 97 97 >99% 2 44 542008-09 99 99 97 >99% 1 37 62Female 2007-08 94 95 94 99 6 44 492008-09 98 97 94 >99% 2 40 57Male 2007-08 97 94 91 >99% 3 57 41SpecialEducation2008-09 97 95 92 >99% 3 51 462007-0873 74 78 >99% 27 64 92008-09 82 90 85 >99% 18 73 9LEP 2007-08 88 90 88 94 13 69 19EconomicallyDisadvantaged(Continued)2008-09 90 92 89 >99% 10 60 302007-0892 90 89 >99% 8 63 292008-09 95 92 90 >99% 5 66 29
Texas 2009 NCLB Report Card 08:32 Tuesday, February 16, 2010 2Part I -- Campus Level: Student performance for each district and campus compared to the state as awhole, % of Students Tested, Student Achievement by Proficiency Level, 2007-08, 2008-09,For KREINHOP ELEMENTARY ( 101915121 )Grade 3 ReadingStudent GroupsYearCampus % ofStudents MetStandard(Proficient)andCommended(Advanced)District % ofStudentsMetStandard(Proficient)andCommended(Advanced)State % ofStudentsMetStandard(Proficient)andCommended(Advanced)%Tested(InCampus)Percent of Students in Campus atEach Achievement Level%NotMeetingStandard(Basic)%MetStandard(Proficient)%Commended(Advanced)Migrant 2007-08 * * 84 * * * *2008-09 * * 84 * * * *
Texas 2009 NCLB Report Card 08:32 Tuesday, February 16, 2010 3Part I -- Campus Level: Student performance for each district and campus compared to the state as awhole, % of Students Tested, Student Achievement by Proficiency Level, 2007-08, 2008-09,For KREINHOP ELEMENTARY ( 101915121 )Grade 3 MathematicsStudent GroupsYearCampus % ofStudents MetStandard(Proficient)andCommended(Advanced)District % ofStudentsMetStandard(Proficient)andCommended(Advanced)State % ofStudentsMetStandard(Proficient)andCommended(Advanced)%Tested(InCampus)Percent of Students in Campus atEach Achievement Level%NotMeetingStandard(Basic)%MetStandard(Proficient)%Commended(Advanced)All Students 2007-08 81 87 82 >99% 19 50 31AmericanIndian2008-09 84 90 83 >99% 16 42 422007-08* 67 83 * * * *2008-09 * 67 86 * * * *Asian 2007-08 * 97 94 >99% * * *2008-09 94 96 95 >99% 6 24 71Black 2007-08 69 72 71 >99% 31 25 442008-09 59 79 74 >99% 41 32 27Hispanic 2007-08 80 84 80 >99% 20 61 202008-09 77 86 80 >99% 23 44 33White 2007-08 82 93 90 >99% 18 47 342008-09 93 95 91 >99% 7 49 44Female 2007-08 79 86 82 >99% 21 49 312008-09 82 89 83 >99% 18 37 45Male 2007-08 83 89 83 >99% 17 51 32SpecialEducation2008-09 87 90 84 >99% 13 49 382007-0850 62 68 >99% 50 42 82008-09 55 75 74 >99% 45 36 18LEP 2007-08 88 84 78 >99% 13 69 19EconomicallyDisadvantaged(Continued)2008-09 79 86 79 >99% 21 53 262007-0877 80 77 >99% 23 62 152008-09 78 83 78 >99% 22 41 37
Texas 2009 NCLB Report Card 08:32 Tuesday, February 16, 2010 4Part I -- Campus Level: Student performance for each district and campus compared to the state as awhole, % of Students Tested, Student Achievement by Proficiency Level, 2007-08, 2008-09,For KREINHOP ELEMENTARY ( 101915121 )Grade 3 MathematicsStudent GroupsYearCampus % ofStudents MetStandard(Proficient)andCommended(Advanced)District % ofStudentsMetStandard(Proficient)andCommended(Advanced)State % ofStudentsMetStandard(Proficient)andCommended(Advanced)%Tested(InCampus)Percent of Students in Campus atEach Achievement Level%NotMeetingStandard(Basic)%MetStandard(Proficient)%Commended(Advanced)Migrant 2007-08 * * 73 * * * *2008-09 * * 75 * * * *
Texas 2009 NCLB Report Card 08:32 Tuesday, February 16, 2010 5Part I -- Campus Level: Student performance for each district and campus compared to the state as awhole, % of Students Tested, Student Achievement by Proficiency Level, 2007-08, 2008-09,For KREINHOP ELEMENTARY ( 101915121 )Grade 4 ReadingStudent GroupsYearCampus % ofStudents MetStandard(Proficient)andCommended(Advanced)District % ofStudentsMetStandard(Proficient)andCommended(Advanced)State % ofStudentsMetStandard(Proficient)andCommended(Advanced)%Tested(InCampus)Percent of Students in Campus atEach Achievement Level%NotMeetingStandard(Basic)%MetStandard(Proficient)%Commended(Advanced)All Students 2007-08 83 87 82 99 17 60 23AmericanIndian2008-09 90 89 84 99 10 65 252007-08* * 84 * * * *2008-09 * 88 86 * * * *Asian 2007-08 93 91 93 >99% 7 47 472008-09 * 94 93 >99% * * *Black 2007-08 88 77 74 >99% 12 71 182008-09 87 81 77 >99% 13 60 27Hispanic 2007-08 73 82 77 98 27 57 162008-09 87 84 80 >99% 13 67 20White 2007-08 88 94 91 >99% 12 63 252008-09 91 94 92 99 9 63 28Female 2007-08 88 90 84 99 12 67 212008-09 88 90 86 >99% 12 59 29Male 2007-08 79 85 80 >99% 21 53 25SpecialEducation2008-09 92 87 81 99 8 72 202007-0857 66 63 >99% 43 50 72008-09 62 71 69 >99% 38 54 8LEP 2007-08 53 73 69 95 47 32 21EconomicallyDisadvantaged(Continued)2008-09 * 79 74 >99% * * *2007-0879 77 75 >99% 21 62 172008-09 93 82 78 >99% 7 84 9
Texas 2009 NCLB Report Card 08:32 Tuesday, February 16, 2010 6Part I -- Campus Level: Student performance for each district and campus compared to the state as awhole, % of Students Tested, Student Achievement by Proficiency Level, 2007-08, 2008-09,For KREINHOP ELEMENTARY ( 101915121 )Grade 4 ReadingStudent GroupsYearCampus % ofStudents MetStandard(Proficient)andCommended(Advanced)District % ofStudentsMetStandard(Proficient)andCommended(Advanced)State % ofStudentsMetStandard(Proficient)andCommended(Advanced)%Tested(InCampus)Percent of Students in Campus atEach Achievement Level%NotMeetingStandard(Basic)%MetStandard(Proficient)%Commended(Advanced)Migrant 2007-08 * * 67 * * * *2008-09 * * 72 * * * *
Texas 2009 NCLB Report Card 08:32 Tuesday, February 16, 2010 7Part I -- Campus Level: Student performance for each district and campus compared to the state as awhole, % of Students Tested, Student Achievement by Proficiency Level, 2007-08, 2008-09,For KREINHOP ELEMENTARY ( 101915121 )Grade 4 MathematicsStudent GroupsYearCampus % ofStudents MetStandard(Proficient)andCommended(Advanced)District % ofStudentsMetStandard(Proficient)andCommended(Advanced)State % ofStudentsMetStandard(Proficient)andCommended(Advanced)%Tested(InCampus)Percent of Students in Campus atEach Achievement Level%NotMeetingStandard(Basic)%MetStandard(Proficient)%Commended(Advanced)All Students 2007-08 78 86 83 99 22 50 28AmericanIndian2008-09 88 91 85 99 12 47 412007-08* 91 83 * * * *2008-09 * 88 85 * * * *Asian 2007-08 80 94 95 >99% 20 33 472008-09 * 97 95 >99% * * *Black 2007-08 82 74 73 >99% 18 71 122008-09 93 83 76 >99% 7 40 53Hispanic 2007-08 75 81 80 98 25 57 182008-09 82 87 83 98 18 49 33White 2007-08 79 93 90 >99% 21 43 372008-09 89 95 91 >99% 11 49 39Female 2007-08 73 86 83 99 27 46 272008-09 86 90 85 99 14 47 39Male 2007-08 84 87 83 >99% 16 55 29SpecialEducation2008-09 89 92 85 >99% 11 47 432007-0821 54 63 >99% 79 7 142008-09 54 76 71 >99% 46 46 8LEP 2007-08 53 73 75 95 47 26 26EconomicallyDisadvantaged(Continued)2008-09 73 83 79 >99% 27 47 272007-0871 77 78 >99% 29 52 192008-09 75 86 80 98 25 52 23
Texas 2009 NCLB Report Card 08:32 Tuesday, February 16, 2010 8Part I -- Campus Level: Student performance for each district and campus compared to the state as awhole, % of Students Tested, Student Achievement by Proficiency Level, 2007-08, 2008-09,For KREINHOP ELEMENTARY ( 101915121 )Grade 4 MathematicsStudent GroupsYearCampus % ofStudents MetStandard(Proficient)andCommended(Advanced)District % ofStudentsMetStandard(Proficient)andCommended(Advanced)State % ofStudentsMetStandard(Proficient)andCommended(Advanced)%Tested(InCampus)Percent of Students in Campus atEach Achievement Level%NotMeetingStandard(Basic)%MetStandard(Proficient)%Commended(Advanced)Migrant 2007-08 * * 74 * * * *2008-09 * * 78 * * * *
Texas 2009 NCLB Report Card 08:32 Tuesday, February 16, 2010 9Part I -- Campus Level: Student performance for each district and campus compared to the state as awhole, % of Students Tested, Student Achievement by Proficiency Level, 2007-08, 2008-09,For KREINHOP ELEMENTARY ( 101915121 )Grade 5 ReadingStudent GroupsYearCampus % ofStudents MetStandard(Proficient)andCommended(Advanced)District % ofStudentsMetStandard(Proficient)andCommended(Advanced)State % ofStudentsMetStandard(Proficient)andCommended(Advanced)%Tested(InCampus)Percent of Students in Campus atEach Achievement Level%NotMeetingStandard(Basic)%MetStandard(Proficient)%Commended(Advanced)All Students 2007-08 90 94 89 >99% 10 61 30AmericanIndian2008-09 92 93 89 >99% 8 64 282007-08* * 91 * * * *2008-09 * * 89 * * * *Asian 2007-08 * 96 95 >99% * * *2008-09 93 96 95 >99% 7 53 40Black 2007-08 86 88 85 >99% 14 71 142008-09 94 88 85 >99% 6 82 12Hispanic 2007-08 84 90 86 >99% 16 61 242008-09 85 89 85 >99% 15 67 18White 2007-08 93 97 95 >99% 7 58 362008-09 97 98 95 >99% 3 59 38Female 2007-08 93 94 90 >99% 7 65 282008-09 88 94 90 >99% 12 58 31Male 2007-08 88 93 88 >99% 12 57 32SpecialEducation2008-09 95 93 88 >99% 5 71 242007-0868 70 69 >99% 32 58 112008-09 88 80 78 >99% 12 82 6LEP 2007-08 50 79 72 >99% 50 33 17EconomicallyDisadvantaged(Continued)2008-09 65 78 72 >99% 35 53 122007-0884 88 84 >99% 16 69 162008-09 84 87 84 >99% 16 69 16
Texas 2009 NCLB Report Card 08:32 Tuesday, February 16, 2010 10Part I -- Campus Level: Student performance for each district and campus compared to the state as awhole, % of Students Tested, Student Achievement by Proficiency Level, 2007-08, 2008-09,For KREINHOP ELEMENTARY ( 101915121 )Grade 5 ReadingStudent GroupsYearCampus % ofStudents MetStandard(Proficient)andCommended(Advanced)District % ofStudentsMetStandard(Proficient)andCommended(Advanced)State % ofStudentsMetStandard(Proficient)andCommended(Advanced)%Tested(InCampus)Percent of Students in Campus atEach Achievement Level%NotMeetingStandard(Basic)%MetStandard(Proficient)%Commended(Advanced)Migrant 2007-08 * * 76 * * * *2008-09 * * 76 * * * *
Texas 2009 NCLB Report Card 08:32 Tuesday, February 16, 2010 11Part I -- Campus Level: Student performance for each district and campus compared to the state as awhole, % of Students Tested, Student Achievement by Proficiency Level, 2007-08, 2008-09,For KREINHOP ELEMENTARY ( 101915121 )Grade 5 MathematicsStudent GroupsYearCampus % ofStudents MetStandard(Proficient)andCommended(Advanced)District % ofStudentsMetStandard(Proficient)andCommended(Advanced)State % ofStudentsMetStandard(Proficient)andCommended(Advanced)%Tested(InCampus)Percent of Students in Campus atEach Achievement Level%NotMeetingStandard(Basic)%MetStandard(Proficient)%Commended(Advanced)All Students 2007-08 89 91 88 >99% 11 46 43AmericanIndian2008-09 96 94 90 >99% 4 55 412007-08* 88 89 * * * *2008-09 * * 88 * * * *Asian 2007-08 * 97 96 >99% * * *2008-09 93 97 97 >99% 7 33 60Black 2007-08 76 81 80 >99% 24 48 292008-09 88 88 83 >99% 12 59 29Hispanic 2007-08 87 87 85 >99% 13 48 382008-09 95 91 87 >99% 5 55 40White 2007-08 92 95 94 >99% 8 45 482008-09 * 98 95 >99% * * *Female 2007-08 90 91 88 >99% 10 52 382008-09 96 94 90 >99% 4 51 45Male 2007-08 88 91 87 >99% 12 40 48SpecialEducation2008-09 96 94 90 >99% 4 59 372007-0853 62 64 >99% 47 37 162008-09 88 81 78 >99% 12 71 18LEP 2007-08 67 77 74 >99% 33 33 33EconomicallyDisadvantaged(Continued)2008-09 94 84 78 >99% 6 71 242007-0880 84 83 >99% 20 47 332008-09 95 89 86 >99% 5 59 36
Texas 2009 NCLB Report Card 08:32 Tuesday, February 16, 2010 12Part I -- Campus Level: Student performance for each district and campus compared to the state as awhole, % of Students Tested, Student Achievement by Proficiency Level, 2007-08, 2008-09,For KREINHOP ELEMENTARY ( 101915121 )Grade 5 MathematicsStudent GroupsYearCampus % ofStudents MetStandard(Proficient)andCommended(Advanced)District % ofStudentsMetStandard(Proficient)andCommended(Advanced)State % ofStudentsMetStandard(Proficient)andCommended(Advanced)%Tested(InCampus)Percent of Students in Campus atEach Achievement Level%NotMeetingStandard(Basic)%MetStandard(Proficient)%Commended(Advanced)Migrant 2007-08 * * 78 * * * *2008-09 * * 81 * * * *
Texas 2009 NCLB Report Card 08:32 Tuesday, February 16, 2010 13Part I -- Campus Level: Student performance for each district and campus compared to the state as awhole, % of Students Tested, Student Achievement by Proficiency Level, 2007-08, 2008-09,For KREINHOP ELEMENTARY ( 101915121 )Grade 5 ScienceStudent GroupsYearCampus % ofStudents MetStandard(Proficient)andCommended(Advanced)District % ofStudentsMetStandard(Proficient)andCommended(Advanced)State % ofStudentsMetStandard(Proficient)andCommended(Advanced)%Tested(InCampus)Percent of Students in Campus atEach Achievement Level%NotMeetingStandard(Basic)%MetStandard(Proficient)%Commended(Advanced)All Students 2007-08 78 83 78 99 22 35 43AmericanIndian2008-09 92 87 82 99 8 57 352007-08* 75 83 * * * *2008-09 * * 85 * * * *Asian 2007-08 * 90 89 91 * * *2008-09 93 91 92 >99% 7 33 60Black 2007-08 58 67 67 95 42 37 212008-09 76 75 73 >99% 24 65 12Hispanic 2007-08 69 74 73 >99% 31 35 352008-09 90 79 77 98 10 61 29White 2007-08 85 92 89 >99% 15 37 482008-09 98 95 92 >99% 2 57 41Female 2007-08 73 79 76 99 27 37 372008-09 90 85 80 99 10 57 32Male 2007-08 82 86 81 99 18 34 48SpecialEducation2008-09 95 89 84 >99% 5 57 382007-0847 52 55 >99% 53 32 162008-09 88 63 61 >99% 12 71 18LEP 2007-08 50 55 54 >99% 50 33 17EconomicallyDisadvantaged(Continued)2008-09 75 63 61 94 25 56 192007-0870 71 71 >99% 30 42 282008-09 89 77 75 >99% 11 61 27
Texas 2009 NCLB Report Card 08:32 Tuesday, February 16, 2010 14Part I -- Campus Level: Student performance for each district and campus compared to the state as awhole, % of Students Tested, Student Achievement by Proficiency Level, 2007-08, 2008-09,For KREINHOP ELEMENTARY ( 101915121 )Grade 5 ScienceStudent GroupsYearCampus % ofStudents MetStandard(Proficient)andCommended(Advanced)District % ofStudentsMetStandard(Proficient)andCommended(Advanced)State % ofStudentsMetStandard(Proficient)andCommended(Advanced)%Tested(InCampus)Percent of Students in Campus atEach Achievement Level%NotMeetingStandard(Basic)%MetStandard(Proficient)%Commended(Advanced)Migrant 2007-08 * * 63 * * * *2008-09 * * 67 * * * *
Texas 2009~_NCLB Report Card 08:32 Tuesday, February 16, 2010 15Part I -- Campus Level: Student performance for each district and campus compared to the state as awhole, % of Students Tested, Student Achievement by Proficiency Level, 2007-08,~_2008-09,For KREINHOP ELEMENTARY ( 101915121 )FootnotesStudent Achievement results are rounded to the nearest whole percent.Special formats ('*', >99%,
Part II a. -- Campus Level: Comparison between student achievement in the LEA as a whole and for eachcampus within the LEA and the State's academic expectations in reading/language arts and mathematics,and information on the other academic indicators used for AYP determinationsFor KREINHOP ELEMENTARY ( 101915121 )08:33 Tuesday, February 16, 2010Reading/Language ArtsStudent GroupsYearPercentTestedTarget:95%PercentTestedTarget:95%PercentTestedTarget:95%PercentMetStandard(Proficient)&Commended(Advanced)'08 Target:60%'09 Target:67%PercentMetStandard(Proficient)&Commended(Advanced)'08 Target:60%'09 Target:67%PercentMetStandard(Proficient)&Commended(Advanced)'08 Target:60%'09 Target:67%Campus District State Campus District StateAll Students 2007-08 >99% >99% 99 90 92 882008-09 >99% >99% 99 93 93 88American Indian 2007-08 * >99% 99 * 91 902008-09 * >99% 99 * 90 91Asian 2007-08 >99% >99% >99% 97 95 952008-09 >99% >99% 99 95 96 95Black 2007-08 >99% >99% >99% 85 86 832008-09 >99% >99% >99% 92 89 84Hispanic 2007-08 99 99 99 85 88 842008-09 >99% 99 99 88 89 85White 2007-08 >99% >99% >99% 93 96 942008-09 >99% >99% >99% 96 96 94Female 2007-08 99 >99% >99% 92 94 902008-09 >99% >99% 99 92 94 90Male 2007-08 >99% >99% 99 88 90 862008-09 >99% >99% 99 94 92 86Special Education 2007-08 >99% 99 99 64 65 622008-09 >99% 99 99 78 76 65LEP 2007-08 95 99 99 81 82 762008-09 >99% 99 98 87 82 76Economically Disadvantaged 2007-08 >99% >99% 99 84 85 832008-09 >99% 99 99 91 87 83Migrant 2007-08 * * 99 * * 762008-09 * * 98 * * 76
Part II a. -- Campus Level: Comparison between student achievement in the LEA as a whole and for eachcampus within the LEA and the State's academic expectations in reading/language arts and mathematics,and information on the other academic indicators used for AYP determinationsFor KREINHOP ELEMENTARY ( 101915121 )08:33 Tuesday, February 16, 2010MathematicsPercentTestedPercentTestedPercentTestedPercentMetStandard(Proficient)&Commended(Advanced)PercentMetStandard(Proficient)&Commended(Advanced)PercentMetStandard(Proficient)&Commended(Advanced)Student GroupsYearTarget:95%Target:95%Target:95%'08 Target:50%'09 Target:58%'08 Target:50%'09 Target:58%'08 Target:50%'09 Target:58%Campus District State Campus District StateAll Students 2007-08 >99% >99% >99% 84 84 792008-09 >99% >99% >99% 90 87 81American Indian 2007-08 * >99% 99 * 79 812008-09 * 98 99 * 81 83Asian 2007-08 >99% >99% >99% 92 94 942008-09 >99% >99% >99% 95 95 94Black 2007-08 >99% >99% 99 76 70 682008-09 >99% 99 >99% 78 77 70Hispanic 2007-08 99 >99% >99% 81 79 752008-09 99 >99% >99% 86 83 77White 2007-08 >99% >99% >99% 86 91 882008-09 >99% >99% >99% 93 92 89Female 2007-08 >99% >99% >99% 81 84 802008-09 >99% >99% >99% 88 87 81Male 2007-08 >99% >99% >99% 87 84 792008-09 >99% >99% >99% 91 87 81Special Education 2007-08 >99% 99 99 43 46 502008-09 >99% 99 99 68 63 57LEP 2007-08 98 >99% >99% 82 78 722008-09 >99% >99% 99 87 80 74Economically Disadvantaged 2007-08 >99% >99% >99% 76 75 732008-09 99 >99% >99% 83 80 75Migrant 2007-08 * * >99% * * 682008-09 * * 99 * * 70
Part II a. -- Campus Level: Comparison between student achievement in the LEA as a whole and for eachcampus within the LEA and the State's academic expectations in reading/language arts and mathematics,and information on the other academic indicators used for AYP determinationsFor KREINHOP ELEMENTARY ( 101915121 )08:33 Tuesday, February 16, 2010Additional Academic IndicatorsGraduationRateGraduationRateGraduationRateAttendanceRateAttendanceRateAttendanceRateStudent GroupsYearTarget:70%Target:70%Target:70%Target:90%Target:90%Target:90%Campus District State Campus District StateAll Students 2007-08 n/a 81.7 78.0 96.8 n/a 95.52008-09 n/a 85.0 79.1 96.9 n/a 95.5American Indian 2007-08 n/a 70.0 81.4 * n/a 94.82008-09 n/a 71.4 81.7 - n/a 94.8Asian 2007-08 n/a 88.4 91.5 97.5 n/a 97.52008-09 n/a 94.4 91.2 96.8 n/a 97.5Black 2007-08 n/a 67.9 70.7 96.8 n/a 95.02008-09 n/a 76.3 71.8 97.6 n/a 95.1Hispanic 2007-08 n/a 70.1 68.5 97.1 n/a 95.32008-09 n/a 73.2 70.8 97.1 n/a 95.4White 2007-08 n/a 89.5 88.2 96.6 n/a 95.72008-09 n/a 91.6 88.8 96.6 n/a 95.6Female 2007-08 n/a 83.6 80.3 96.7 n/a 95.52008-09 n/a 87.7 81.4 96.9 n/a 95.5Male 2007-08 n/a 79.7 75.8 96.9 n/a 95.52008-09 n/a 82.5 76.8 96.9 n/a 95.5Special Education 2007-08 n/a 66.6 70.3 96.6 n/a 94.02008-09 n/a 75.0 69.8 96.3 n/a 94.0LEP 2007-08 n/a 32.9 39.3 97.1 n/a 96.32008-09 n/a 36.2 44.2 96.9 n/a 96.4Economically Disadvantaged 2007-08 n/a 67.0 68.8 96.0 n/a 95.22008-09 n/a 68.5 70.4 96.8 n/a 95.2Migrant 2007-08 n/a - 60.1 - n/a 94.22008-09 n/a - 66.3 - n/a 94.1
Part II a. -- Campus Level: Comparison between student achievement in the LEA as a whole and for eachcampus within the LEA and the State's academic expectations in reading/language arts and mathematics,and information on the other academic indicators used for AYP determinationsFor KREINHOP ELEMENTARY ( 101915121 )08:33 Tuesday, February 16, 2010FootnotesStudent Achievement results are rounded to the nearest whole percent. Additional Academic Indicators (Graduation and Attendance Rate) arerounded to the nearest one-tenth of a percent (one decimal place).Adequate Yearly Progress (AYP) is measured for the following student groups: All Students, African American, Hispanic, White,Economically Disadvantaged, Special Education, and Limited English Proficient (LEP) students. Other student groups are shown forinformational purposes only.Special formats ('*', >99%,
Part III -- Additional accountability information for schools receiving Title I, Part A fundsFor KREINHOP ELEMENTARY ( 101915121 )Year Met AYP SIP2007-08 Meets AYP2008-09 Meets AYPContact Information08:33 Tuesday, February 16, 2010Questions regarding Part III of the No Child Left Behind School Report Card should be directed to the Division of Performance Reporting.Contact us at (512) 463-9704 or performance.reporting@tea.state.tx.us.
Part IV - Teacher Quality1a. Professional qualifications of all public elementary and secondary teachers, as defined by the state (TeacherDegree), for the campusFor KREINHOP ELEMENTARY ( 101915121 )08:34 Tuesday, February 16, 2010Year Bachelors Masters Doctorate2007-08 Not Provided Not Provided Not Provided2008-09 84.5 15.5 0.0FootnotesPercent of Teachers are rounded to the nearest one-tenth of a percent (one decimal place).Percentages reported by Teacher Degree may not sum to 100% either or due to rounding or because the category “teachers with no degree” isnot reported.Contact InformationQuestions regarding Part IV a. of the No Child Left Behind School Report Card should be directed to the Division of Performance Reporting.Contact us at (512) 463-9704 or performance.reporting@tea.state.tx.us.Part IV - Teacher Qualityb. Percentage of public elementary and secondary teachers with emergency/provisional credentials for the campusFor KREINHOP ELEMENTARY ( 101915121 )Year %2007-08 0.002008-09 0.00FootnotesPercent of Teachers are rounded to the nearest one-hundredth of a percent (two decimal places).Contact InformationQuestions regarding Part IV b. of the No Child Left Behind School Report Card should be directed to theDivision of NCLB Program Coordination.Contact us at (512) 463-9374 or nclb@tea.state.tx.us.
Part IV - Teacher Quality2c. Percentage of classes not taught by highly qualified teachers of the ESEA (applies to public elementaryand secondary school teachers who teach a core academic subject), in the aggregate for the campusFor KREINHOP ELEMENTARY ( 101915121 )08:34 Tuesday, February 16, 2010Level Year %Percentage of Core AcademicSubject <strong>Elementary</strong> andSecondary School Classes nottaught by Highly Qualified TeachersFootnotes2007-08 0.002008-09 0.00Percent of Classes are rounded to the nearest one-hundredth of a percent (two decimal places).Contact InformationQuestions regarding Part IV c. of the No Child Left Behind School Report Card should be directed to theDivision of NCLB Program Coordination.Contact us at (512) 463-9374 or nclb@tea.state.tx.us.