Biplot AMMI graphic representation of specific combining ... - SBMP
Biplot AMMI graphic representation of specific combining ... - SBMP
Biplot AMMI graphic representation of specific combining ... - SBMP
Create successful ePaper yourself
Turn your PDF publications into a flip-book with our unique Google optimized e-Paper software.
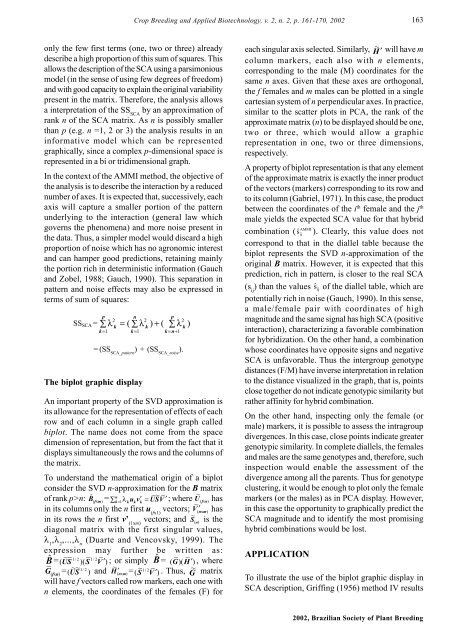
Crop Breeding and Applied Biotechnology, v. 2, n. 2, p. 161-170, 2002163only the few first terms (one, two or three) alreadydescribe a high proportion <strong>of</strong> this sum <strong>of</strong> squares. Thisallows the description <strong>of</strong> the SCA using a parsimoniousmodel (in the sense <strong>of</strong> using few degrees <strong>of</strong> freedom)and with good capacity to explain the original variabilitypresent in the matrix. Therefore, the analysis allowsa interpretation <strong>of</strong> the SS SCAby an approximation <strong>of</strong>rank n <strong>of</strong> the SCA matrix. As n is possibly smallerthan p (e.g. n =1, 2 or 3) the analysis results in aninformative model which can be represented<strong>graphic</strong>ally, since a complex p-dimensional space isrepresented in a bi or tridimensional graph.In the context <strong>of</strong> the <strong>AMMI</strong> method, the objective <strong>of</strong>the analysis is to describe the interaction by a reducednumber <strong>of</strong> axes. It is expected that, successively, eachaxis will capture a smaller portion <strong>of</strong> the patternunderlying to the interaction (general law whichgoverns the phenomena) and more noise present inthe data. Thus, a simpler model would discard a highproportion <strong>of</strong> noise which has no agronomic interestand can hamper good predictions, retaining mainlythe portion rich in deterministic information (Gauchand Zobel, 1988; Gauch, 1990). This separation inpattern and noise effects may also be expressed interms <strong>of</strong> sum <strong>of</strong> squares:p222SS SCA = ∑ λ = ( ∑ λ ) + ( ∑ λ )nkkkk= 1 k= 1 k= n+1= (SS SCA_pattern) + (SS SCA_noise).The biplot <strong>graphic</strong> displayAn important property <strong>of</strong> the SVD approximation isits allowance for the <strong>representation</strong> <strong>of</strong> effects <strong>of</strong> eachrow and <strong>of</strong> each column in a single graph calledbiplot. The name does not come from the spacedimension <strong>of</strong> <strong>representation</strong>, but from the fact that itdisplays simultaneously the rows and the columns <strong>of</strong>the matrix.To understand the mathematical origin <strong>of</strong> a biplotconsider the SVD n-approximation for the B matrix<strong>of</strong> rank p>n: ˆn ~~ ~ ~B( fxm)= ∑ k= 1 λkukv′k= USV′; where U( fxn)has~in its columns only the n first u (fx1)vectors; V ′( nxm)has~in its rows the n first v’ (1xm)vectors; and S( n)is thediagonal matrix with the first singular values,λ 1,λ 2,...,λ n(Duarte and Vencovsky, 1999). Theexpression may further be written as:Bˆ =~~ 1/ 2 ~ 1/ 2 ~( U S )( S V ′); or simply Bˆ =~ ~( G )( H ′), where~G( fxn)=~~ 2~( U S1/ ) and H ′( nxm)= ~ 1/ 2 ~( S V ′). Thus, ~ G matrixwill have f vectors called row markers, each one withn elements, the coordinates <strong>of</strong> the females (F) forpeach singular axis selected. Similarly, ~ H ′ will have mcolumn markers, each also with n elements,corresponding to the male (M) coordinates for thesame n axes. Given that these axes are orthogonal,the f females and m males can be plotted in a singlecartesian system <strong>of</strong> n perpendicular axes. In practice,similar to the scatter plots in PCA, the rank <strong>of</strong> theapproximate matrix (n) to be displayed should be one,two or three, which would allow a <strong>graphic</strong><strong>representation</strong> in one, two or three dimensions,respectively.A property <strong>of</strong> biplot <strong>representation</strong> is that any element<strong>of</strong> the approximate matrix is exactly the inner product<strong>of</strong> the vectors (markers) corresponding to its row andto its column (Gabriel, 1971). In this case, the productbetween the coordinates <strong>of</strong> the i th female and the j thmale yields the expected SCA value for that hybridcombination ( ŝ<strong>AMMI</strong>ij ). Clearly, this value does notcorrespond to that in the diallel table because thebiplot represents the SVD n-approximation <strong>of</strong> theoriginal B matrix. However, it is expected that thisprediction, rich in pattern, is closer to the real SCA(s ij) than the values ŝ ij <strong>of</strong> the diallel table, which arepotentially rich in noise (Gauch, 1990). In this sense,a male/female pair with coordinates <strong>of</strong> highmagnitude and the same signal has high SCA (positiveinteraction), characterizing a favorable combinationfor hybridization. On the other hand, a combinationwhose coordinates have opposite signs and negativeSCA is unfavorable. Thus the intergroup genotypedistances (F/M) have inverse interpretation in relationto the distance visualized in the graph, that is, pointsclose together do not indicate genotypic similarity butrather affinity for hybrid combination.On the other hand, inspecting only the female (ormale) markers, it is possible to assess the intragroupdivergences. In this case, close points indicate greatergenotypic similarity. In complete diallels, the femalesand males are the same genotypes and, therefore, suchinspection would enable the assessment <strong>of</strong> thedivergence among all the parents. Thus for genotypeclustering, it would be enough to plot only the femalemarkers (or the males) as in PCA display. However,in this case the opportunity to <strong>graphic</strong>ally predict theSCA magnitude and to identify the most promisinghybrid combinations would be lost.APPLICATIONTo illustrate the use <strong>of</strong> the biplot <strong>graphic</strong> display inSCA description, Griffing (1956) method IV results2002, Brazilian Society <strong>of</strong> Plant Breeding


