Biplot AMMI graphic representation of specific combining ... - SBMP
Biplot AMMI graphic representation of specific combining ... - SBMP
Biplot AMMI graphic representation of specific combining ... - SBMP

You also want an ePaper? Increase the reach of your titles
YUMPU automatically turns print PDFs into web optimized ePapers that Google loves.
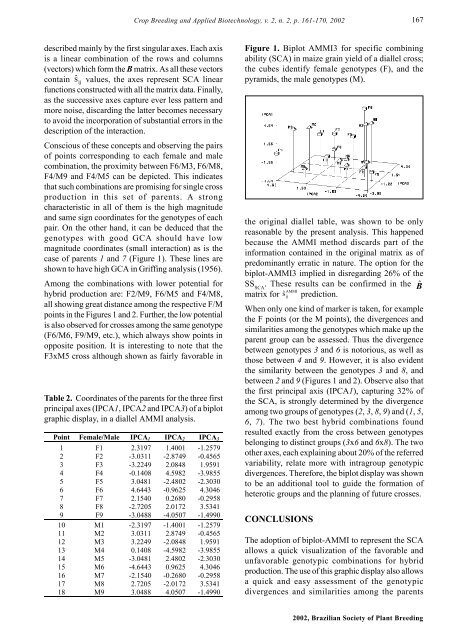
Crop Breeding and Applied Biotechnology, v. 2, n. 2, p. 161-170, 2002167described mainly by the first singular axes. Each axisis a linear combination <strong>of</strong> the rows and columns(vectors) which form the B matrix. As all these vectorscontain ŝij values, the axes represent SCA linearfunctions constructed with all the matrix data. Finally,as the successive axes capture ever less pattern andmore noise, discarding the latter becomes necessaryto avoid the incorporation <strong>of</strong> substantial errors in thedescription <strong>of</strong> the interaction.Conscious <strong>of</strong> these concepts and observing the pairs<strong>of</strong> points corresponding to each female and malecombination, the proximity between F6/M3, F6/M8,F4/M9 and F4/M5 can be depicted. This indicatesthat such combinations are promising for single crossproduction in this set <strong>of</strong> parents. A strongcharacteristic in all <strong>of</strong> them is the high magnitudeand same sign coordinates for the genotypes <strong>of</strong> eachpair. On the other hand, it can be deduced that thegenotypes with good GCA should have lowmagnitude coordinates (small interaction) as is thecase <strong>of</strong> parents 1 and 7 (Figure 1). These lines areshown to have high GCA in Griffing analysis (1956).Among the combinations with lower potential forhybrid production are: F2/M9, F6/M5 and F4/M8,all showing great distance among the respective F/Mpoints in the Figures 1 and 2. Further, the low potentialis also observed for crosses among the same genotype(F6/M6, F9/M9, etc.), which always show points inopposite position. It is interesting to note that theF3xM5 cross although shown as fairly favorable inTable 2. Coordinates <strong>of</strong> the parents for the three firstprincipal axes (IPCA1, IPCA2 and IPCA3) <strong>of</strong> a biplot<strong>graphic</strong> display, in a diallel <strong>AMMI</strong> analysis.Point Female/Male IPCA 1 IPCA 2 IPCA 31 F1 2.3197 1.4001 -1.25792 F2 -3.0311 -2.8749 -0.45653 F3 -3.2249 2.0848 1.95914 F4 -0.1408 4.5982 -3.98555 F5 3.0481 -2.4802 -2.30306 F6 4.6443 -0.9625 4.30467 F7 2.1540 0.2680 -0.29588 F8 -2.7205 2.0172 3.53419 F9 -3.0488 -4.0507 -1.499010 M1 -2.3197 -1.4001 -1.257911 M2 3.0311 2.8749 -0.456512 M3 3.2249 -2.0848 1.959113 M4 0.1408 -4.5982 -3.985514 M5 -3.0481 2.4802 -2.303015 M6 -4.6443 0.9625 4.304616 M7 -2.1540 -0.2680 -0.295817 M8 2.7205 -2.0172 3.534118 M9 3.0488 4.0507 -1.4990Figure 1. <strong>Biplot</strong> <strong>AMMI</strong>3 for <strong>specific</strong> <strong>combining</strong>ability (SCA) in maize grain yield <strong>of</strong> a diallel cross;the cubes identify female genotypes (F), and thepyramids, the male genotypes (M).the original diallel table, was shown to be onlyreasonable by the present analysis. This happenedbecause the <strong>AMMI</strong> method discards part <strong>of</strong> theinformation contained in the original matrix as <strong>of</strong>predominantly erratic in nature. The option for thebiplot-<strong>AMMI</strong>3 implied in disregarding 26% <strong>of</strong> theSS SCA. These results can be confirmed in the Bˆmatrix for ŝ <strong>AMMI</strong>ij prediction.When only one kind <strong>of</strong> marker is taken, for examplethe F points (or the M points), the divergences andsimilarities among the genotypes which make up theparent group can be assessed. Thus the divergencebetween genotypes 3 and 6 is notorious, as well asthose between 4 and 9. However, it is also evidentthe similarity between the genotypes 3 and 8, andbetween 2 and 9 (Figures 1 and 2). Observe also thatthe first principal axis (IPCA1), capturing 32% <strong>of</strong>the SCA, is strongly determined by the divergenceamong two groups <strong>of</strong> genotypes (2, 3, 8, 9) and (1, 5,6, 7). The two best hybrid combinations foundresulted exactly from the cross between genotypesbelonging to distinct groups (3x6 and 6x8). The twoother axes, each explaining about 20% <strong>of</strong> the referredvariability, relate more with intragroup genotypicdivergences. Therefore, the biplot display was shownto be an additional tool to guide the formation <strong>of</strong>heterotic groups and the planning <strong>of</strong> future crosses.CONCLUSIONSThe adoption <strong>of</strong> biplot-<strong>AMMI</strong> to represent the SCAallows a quick visualization <strong>of</strong> the favorable andunfavorable genotypic combinations for hybridproduction. The use <strong>of</strong> this <strong>graphic</strong> display also allowsa quick and easy assessment <strong>of</strong> the genotypicdivergences and similarities among the parents2002, Brazilian Society <strong>of</strong> Plant Breeding