000_GMM Directors Report-Pg-1-18.indd - GMM Pfaudler Ltd
000_GMM Directors Report-Pg-1-18.indd - GMM Pfaudler Ltd
000_GMM Directors Report-Pg-1-18.indd - GMM Pfaudler Ltd

Create successful ePaper yourself
Turn your PDF publications into a flip-book with our unique Google optimized e-Paper software.
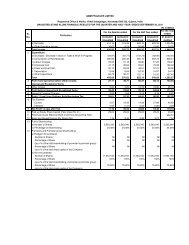
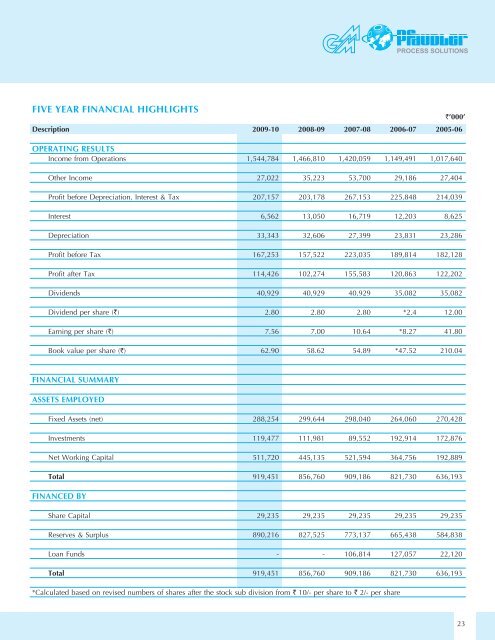
FIVE YEAR FINANCIAL HIGHLIGHTSDescription 2009-10 2008-09 2007-08 2006-07 2005-06OPERATING RESULTSIncome from Operations 1,544,784 1,466,810 1,420,059 1,149,491 1,017,640Other Income 27,022 35,223 53,700 29,186 27,404Profit before Depreciation, Interest & Tax 207,157 203,178 267,153 225,848 214,039Interest 6,562 13,050 16,719 12,203 8,625Depreciation 33,343 32,606 27,399 23,831 23,286Profit before Tax 167,253 157,522 223,035 189,814 182,128Profit after Tax 114,426 102,274 155,583 120,863 122,202Dividends 40,929 40,929 40,929 35,082 35,082Dividend per share (`) 2.80 2.80 2.80 *2.4 12.00Earning per share (`) 7.56 7.00 10.64 *8.27 41.80Book value per share (`) 62.90 58.62 54.89 *47.52 210.04`’<strong>000</strong>’FINANCIAL SUMMARYASSETS EMPLOYEDFixed Assets (net) 288,254 299,644 298,040 264,060 270,428Investments 119,477 111,981 89,552 192,914 172,876Net Working Capital 511,720 445,135 521,594 364,756 192,889Total 919,451 856,760 909,186 821,730 636,193FINANCED BYShare Capital 29,235 29,235 29,235 29,235 29,235Reserves & Surplus 890,216 827,525 773,137 665,438 584,838Loan Funds - - 106,814 127,057 22,120Total 919,451 856,760 909,186 821,730 636,193*Calculated based on revised numbers of shares after the stock sub division from ` 10/- per share to ` 2/- per share23