Download - Yemen Humanitarian Response | YEMEN
Download - Yemen Humanitarian Response | YEMEN
Download - Yemen Humanitarian Response | YEMEN

Create successful ePaper yourself
Turn your PDF publications into a flip-book with our unique Google optimized e-Paper software.
Nutrition and Mortality Survey inLow Land and Mountainous7Ecological Zones ofNutrition and Mortality Survey in Low Land andMountainous Ecological Lahj Governorate Zones of Lahj Governorate<strong>Yemen</strong>UNICEF/RI Joint Survey in collaboration with MOPHPJune 30 - July 14, 2012Lahj, <strong>Yemen</strong>0
TABLE OF CONTENTSTABLE OF CONTENTS....................................................................................................................... 1LIST OF TABLES ................................................................................................................................ 3LIST OF FIGURES .............................................................................................................................. 4LIST OF ANNEXES ............................................................................................................................ 4ABBREVIATIONS AND ACRONYMS .................................................................................................. 5ACKNOWLEDGEMENT ..................................................................................................................... 6SURVEY TEAM MEMBERS ............................................................................................................... 7EXECUTIVE SUMMARY .................................................................................................................... 81. BACKGROUND........................................................................................................................ 122. OBJECTIVES OF THE SURVEY .................................................................................................. 143. MATERIALS AND METHODS ................................................................................................... 153.1. Survey timing .................................................................................................................. 153.2. Survey design ................................................................................................................. 153.3. Sample Size ..................................................................................................................... 153.4. Sampling methodology .................................................................................................. 183.5. Training and survey team composition .......................................................................... 193.6. Field supervision and quality assurance ........................................................................ 203.7. Data collection methods ................................................................................................ 213.8. Ethical considerations .................................................................................................... 233.9. Data analysis ................................................................................................................... 233.10. Survey limitation ......................................................................................................... 244. RESULTS ................................................................................................................................. 254.1. Demographics and socio-economic characteristics ....................................................... 254.2. Anthropometric results: children (based on WHO reference 2006) ............................. 284.3. Mortality ......................................................................................................................... 354.4. Population pyramid ........................................................................................................ 364.5. Feeding practices............................................................................................................ 364.6. Morbidity and health seeking behavior ......................................................................... 381
4.7. Food security .................................................................................................................. 404.8. Water, Sanitation and Hygiene ...................................................................................... 414.9. Programme coverage ..................................................................................................... 435. DISCUSSION ........................................................................................................................... 475.1. Anthropometry ............................................................................................................... 475.2. Mortality ......................................................................................................................... 495.3. Morbidity and Health Care Practices ............................................................................. 495.4. Feeding Practices ............................................................................................................ 505.5. Water, Sanitation and Hygiene ...................................................................................... 515.6. Education of caregivers .................................................................................................. 525.7. Cross Cutting Issues (Gender) ........................................................................................ 526. CONCLUSION ......................................................................................................................... 527. RECOMMENDATIONS ............................................................................................................ 53Immediate recommendations ................................................................................................... 53Medium term ............................................................................................................................ 55Longer term ............................................................................................................................... 55ANNEXES ....................................................................................................................................... 57Annex I: Clusters Selected for Lahj Lowland Ecological Zone ................................................... 57Annex II: Clusters Selected for Lahj Mountain Ecological Zone ................................................ 58Annex III: Random Number Table ............................................................................................. 59Annex IV: Local calendar of events, Lahj Nutrition Survey, July 2012 ...................................... 60Annex V: Reference Table for Age Estimation, Lahj Nutrition Survey, July 2012 ..................... 61Annex VI: RETROSPECTIVE MORTALITY FORM ......................................................................... 63Annex VII: Household Questionnaire ........................................................................................ 64Annex VIII: Referral Form for the Malnourished Children ........................................................ 76Annex IX: Assessments Quality Checks ..................................................................................... 77Annex X: Suspected measles cases reported ............................................................................ 782
LIST OF TABLESTable 1a: Assumptions for calculating the anthropometry sample sizeTable 1b: Estimated sample sizes and clusters for nutritional status (anthropometricmeasurements) by zones with 20 households to be surveyed per day.Table 2a: Assumptions for calculating the anthropometry sample sizeTable 2b: Estimated sample size for Mortality and clusters by Zones with 90 days recall period(DEFF of 1.5, CMR of 0.9/10000/day and precision of 0.4 with 20 households per cluster)Table 3: <strong>Response</strong> rates and sample details for survey areas, Lahj governorate, July 2012Table 4: Percent distribution of households by sex of head of household and by household size,according to ecological zone, Lahj governorate, July 2012Table 5: Percent distribution of household head by marital status and source of income, Lahjgovernorate, July 2012Table 6: Percent distribution of households by level of education of the caregivers’ by ecologicalzones, Lahj governorate, July 2012Table 7: Age and sex distribution of the sample population, Lowland ecological zone (n=797)Table 8: Age and sex distribution of the sample population, Mountainous ecological zone (n=762)Table 9: Prevalence of Acute Malnutrition/Wasting (6-59 months) by survey area and by sex, with95% confidence intervalsTable 10: Prevalence of Chronic Malnutrition/Stunting (6-59 months) by survey area and by sex,with 95% confidence intervalsTable 11: Prevalence of Underweight months) by survey area and by sex, with 95% confidenceintervalsTable 12: Prevalence of Chronic Malnutrition/Stunting (6-59 months) by survey area and by sex,with 95% confidence intervalsTable 13: Percent distribution of children born in the two years preceding the survey and stillbreastfeeding, according to age, Lahj governorate, July 2012Table 14a: Percentage of still breast feeding children, 6 to 23 months old, who received theminimum* number of meals, Lahj governorate, July 2012Table 14b: Percentage of non breast feeding children, 6 to 23 months old, who received theminimum* number of meals, Lahj governorate, July 2012Table 15: Morbidity among children 6-59 months, Lahj governorate, July 2012Table 16: Health seeking behavior, Lahj governorate, July 2012Table 17: Household coping strategies, Lahj governorate, July 2012Table 18: Percent distribution of households by source and treatment of water, according toecological zones, Lahj governorate, July 2012Table 19: Percent distribution of households by type of toilet/latrine facilities and hand washingpractices, according to ecological zones, Lahj governorate, July 2012Table 20: Percent distribution of children by vaccination and supplementation, Lahj governorate,July 2012Table 21: Percent distribution of households with salt tested for level of iodization by ecologicalzones, Lahj governorate, July 20123
LIST OF FIGURESFigure 1:Figure 2:Figure 3:Figure 4:Figure 5:Figure 6:Figure 7:Map of Lahj governorateAcute Malnutrition of Lowland by ageAcute Malnutrition of Mountain by ageChronic Malnutrition of Lowland by ageChronic Malnutrition of Mountain by ageUnderweight of Lowland by ageUnderweight of Mountain by ageLIST OF ANNEXESAnnex I: Clusters Selected for Lahj Lowland Ecological ZoneAnnex II: Clusters Selected for Lahj Mountain Ecological ZoneAnnex III: Random Number TableAnnex IV: Local calendar of events, Lahj Nutrition Survey, July 2012Annex V: Reference Table for Age Estimation, Lahj Nutrition Survey, July 2012Annex VI: Retrospective Mortality FormAnnex VII: Household QuestionnaireAnnex VIII: Referral Form for the Malnourished ChildrenAnnex IX: Assessments Quality ChecksAnnex X: Suspected measles cases reported4
ABBREVIATIONS AND ACRONYMSARICDCCICLPCMAMCMRDEFFENAEPIGAMHAZHHICRCIDPITNMCHMOPHPMUACNNGOOTPPHCPLWPPSRIRUTFSAMSDSFPSMARTTFCTFPTSFPU5MRUNICEFWAZWFP-CFSSWHOWHZAcute Respiratory InfectionCenters for Disease Control and PreventionConfidence IntervalCommunity Livelihood ProgrammeCommunity Management of Acute MalnutritionCrude Mortality RateDesign EffectEmergency Nutrition AssessmentExpanded Programme on ImmunizationGlobal Acute MalnutritionHeight-for-Age z-scoreHouseholdInternational Committee of Red CrescentInternally Displaced PeopleInsecticide Treated NetMaternal and Child HealthMinistry of Public Health and PopulationMiddle Upper Arm CircumferenceNumberNon-governmental OrganizationOutpatient Therapeutic ProgrammePrimary Health CarePregnant and Lactating WomanPopulation Proportional to SizeRelief InternationalReady-To-Use Therapeutic FoodSevere Acute MalnutritionStandard DeviationSupplementary Feeding ProgrammeStandardized Monitoring and Assessment of Relief and TransitionTherapeutic Feeding CentreTherapeutic Feeding ProgrammeTargeted Supplementary Feeding ProgrammeUnder five Mortality RateUnited Nation Children’s FundWeight-for-Age z-scoreWorld Food Programme-Comprehensive Food Security SurveyWorld Health OrganizationWeight-for-Height z-score5
ACKNOWLEDGEMENTThis standard nutrition survey took place in the 15 districts of the Lowland and Mountainouszones of Lahj governorate, <strong>Yemen</strong>. It was a joint survey conducted by UNICEF and RI with thecollaboration of Ministry of Public Health and Population (Nutrition Wing) of Government of<strong>Yemen</strong> and Health Office, Lahj governorate. The survey consisted of a very large team of teamleaders, interviewers & measurers (around 24), facilitators, qualified data clerk andprofessionals from UNICEF Aden office and Lahj governorate health office.The author of this report would like to thank UNICEF for funding this survey and providing allthe necessary logistic support with special thanks to Dr Gamila Hebatulla, Nutrition sub-cluster,Aden office; Dr Wisam, UNICEF Nutrition Unit Chief and Dr Saja Farooq, UNICEF NutritionCluster Coordinator, for providing continuous administrative support and useful advice thathelped in the smooth implementation of the survey. I am immensely thankful to the RI <strong>Yemen</strong>mission team for their enormous support to this survey, especially Dr Habib Rajeh. I am alsothankful to Nagib, UNICEF Sanna for making himself available for 3 days to work with the dataentry team. His input was invaluable.I am also thankful to Dr Malak Abdulaziz Mussawa for her constant and always availablecontribution during the various phases of the survey including, planning, implementation,monitoring and logistics. I am grateful to Dr Omer Zain Mohammed, Director General of LahjHealth Office, for his involvement in planning and reviewing almost every step of the surveyimplementation. Without his support, access to different villages, various necessaryinformation and implementation of the survey would have been almost impossible.My hats off to those brave surveyors who collected the data in the remote areas and top ofmountains under a very hot and harsh weather environment and data entry team. It was agreat team to work with that was not bound to schedule working hours. Credit goes to the Lahjgovernorate health office, especially Dr Ensigam Mohammed Zain and Dr Malak AbdulazizMussawa, for organizing a very competent team for data collection, and entry. The team’sflexibility in working late hours helped finish the survey in scheduled time.As a consultant of the survey, my appreciation goes to all those who directly or indirectlycontributed to the success of this survey.Finally, I wish to thank the individual families who pleasantly allowed the survey team membersto assess their children and provided the survey team with the information required that madethis exercise a success.6
SURVEY TEAM MEMBERSConsultant and Survey Manager: Beka Teshome (Addis Ababa, Ethiopia; bekates@yahoo.com)Facilitation Group: Dr. Malak Abdulaziz Mussawa (Health Office, Lahj), Dr Gamila Hebatullah(UNICEF, Aden), Dr. Omer Zain Mohammed (Health Office, Lahj), Dr Ensigam Mohammed Zain(Health Office, Lahj), Dr Leena Hamid (Health Office, Lahj) and Dr Rosa Mohammed Nasser(Health Office, Lahj)Team Leaders: Abdolmena'em Hassan Muthana, Farook Muthana Saleh, Dr Mahfoodh AliMoqbil, Wadah Abdu Saleh, Sami Nasser Ali, Moa'mmer Fadhl MohammedInterviewers: Dr Ensigam Mohammed Zain, Dr Rosa Mohammed Nasser, Dr Amani Rasheed,Eidhah Abdul Mohamood Saif, Dr Leena Hamid, Salama Mohammed FadhlMeasurers: Sabreen Abdullah Ali, Arwa Esmael Hamud, Nuha Hussein Fadel, Ibtihal MohsenMohammed, Amal Mohammed Fadhl, Jehan Salem Jalal, Bushra, Huda Hussain Fadhl, Abeer AliAhmed, Zahra Hussein Ahmed, Nogood Mansour Subiet, Omalkhair Fadhl AbdulkarimData Entry: Sami Mohammed, Afaan Mohammed Abdu, Wail Fadhl and Shadi Shafiq7
EXECUTIVE SUMMARYIn July 2012, UNICEF in collaboration with Relief International, and Health Office, Lahjgovernorate, conducted two nutrition assessments in the Lowland and Mountainous ecologicalzones of the 15 districts. This was in response to the need to determine the malnutrition levelsand trends for the different ecological zones and to inform on the intervention responses forthe governorate. The main objective of the surveys was to determine the level of wastingamong children aged 6-59 months, analyze the possible factors contributing to malnutrition,morbidity, feeding practices, food security and mortality rate in the specific ecological zones ofthe governorate. A two-stage cluster sampling methodology using probability proportional tosize, 40 and 36 cluster were selected for the Lowland and Mountainous surveys, respectively.Data collection continued from 30 th June until 14 th July of 2012 in two phases- Lowland zone inthe 1st phase and Mountainous zone in the 2nd phase. A total of 1571 children (803 fromLowland and 768 from Mountainous zones) aged 6-59 months from 1504 households (799 fromLowland; and 705 from Mountainous zones) were assessed.Socio-demographics: The mean household size was 6.87 and 7.05 persons respectively in theLowland and Mountainous assessments while the respective mean number of the under fivesper household was 1.09 and 1.19.Malnutrition: The global acute malnutrition (GAM) rate (weight for height
Although a direct comparison is not possible, the Lahj health office health indicator datashowed a crude death rate (CMR) of 0.33/1000 indicating that these levels are comparable.Morbidity: High morbidity rates (from common child illnesses) were reported in the twoecological zones. The incidences of reported diarrhea in Lowland and Mountainous populations(27.9% and 28.8% respectively) within two weeks prior to the assessment were high as was theincidences of ARI and fever in the two ecological zones. The Lowland populations in particularhad a very high prevalence of ARI and Fever. These levels were consistent with the nationallevel figures. Nearly all (95-98%) of the community populations surveyed sought treatment forillness outside of the home. The majority of people sought treatment in a hospital/clinic/healthcenter; followed by private physicians.Infant Feeding: Among children aged 6 to 24 months, only 68-70% were still being breastfed.Among children 6 to 23 months of age and still breastfeeding, more than half (56-57%) ofchildren met the recommended minimum number of meals; while only 18-22% of nonbreastfedchildren received the respective minimum number of meals for their age in theprevious day.Food security: Borrowing money to purchase food or purchase food in credit or mortgage iswidely practiced. 29% in Mountain and 43% in lowland reduced meals size in the past 30 days;further almost one quarter of households in Lowland areas and 14% in Mountain reportedhaving to go to bed hungry in the 4 weeks prior to the survey. 17-25% of households reportedlyreduced the expenditure on education to save money to purchase food, over the 4 weeks priorto the survey. The result is indicative of household food insecurity, particularly in the Lowlandecological zone.Water and Sanitation: In Mountain community, approximately two thirds of the populationuses an improved source of drinking water. In Lowland, more than 83% population usesimproved water, with a nearly one-third using piped water connected to home. Overall, fewhouseholds treat water for drinking purposes. In Mountain community less than half of thepopulation (41.7%) used improved toilet facility, whilst in Lowland, the proportion ofhouseholds using improve facility increases approximately to 51%. Hand washing practicesamong the communities surveyed were highest before and after eating and after toilet use.Hand washing after disposing of children’s feces and before feeding children is low. Use of soapfor hand washing in general was good with 92-97% of population surveyed washed their handswith soap. About 16% people in the Lowland and 5% of the Mountainous community had beendefecating in the open field. Among the Lowland communities, more than two thirds (75.5%) ofthe people wash their hands after eating, while 70.1% washed before eating and 61.3% after9
toilet use. Among the Mountainous areas, 70.6% wash their hand before eating, 70.5% aftereating and further 63.8% after using the toilet.Programme coverage: The level of measles vaccination based on immunization card andmother’s recall was in the range of 86-89% in the two survey areas. Approximately 70-73% ofpopulation in the Lowland and Mountain ecological zone had received vitamin A capsule in thepast 6 months prior to the survey. These coverage figures of the current survey are lower thanthe 87% coverage reported in the last Vitamin A supplementation campaign in Lahj governoratewhich was conducted in March 2012. Only 25% of households had salt with adequateiodization.Recommendations:In conclusion, the level nutrition situation in Lahj governorate is categorized as critical in theLowland zone and serious in the Mountainous zone. There is a need for a nutrition response tosalvage the situation and prevent it from further deteriorating. Children are the mostsusceptible to such shocks and such a situation if not rescued will have a detrimental effect ontheir health and lives both in the short and long run. The following recommendations areproposed to compliment the efforts on the ground and to ensure that the nutritionalrequirements of the community are met.• Convene a multi-sectoral meeting at governorate level to develop a joint action planidentifying responsible partners, and setting a time frame to act on therecommendations made for improving the nutrition situation.• Expand and scale-up the current CMAM services to more health facilities to increasecoverage and to reach more malnourished children.• The CMAM service in the existing health facilities must also be strengthened throughcapacity building and as a preparation to enhance the capacity of managing severemalnourished children• Strengthened the community mobilization efforts to improve early case finding andreferral for OTP• Deploy additional mobile health teams to strengthen and compliment the primaryhealth care services delivered at static health facilities• Appropriate targeting and continued distribution of existing food aid• Blanket and targeted supplementary feeding in severely affected areas• Improved coverage of vitamin A supplementation, multiple micronutrient supplementsthat includes iodine and better management of diarrhea and acute respiratoryinfections10
• Better hygiene and sanitation practices/opportunities• Establishing of nutrition surveillance and monitoring system and a follow-up survey after6 months to assess the change in status of the populations and effect of health andnutrition interventions on malnutrition prevalence, morbidity and mortality• Strengthen the support for ITN distribution and awareness raising campaigns• Implement programmes that will promote self-sufficiency and household food security• Promote salt iodization programmes11
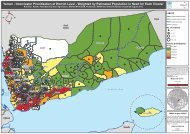
1. BACKGROUNDLocationLahj governorate (Figure 1) is one of the twenty one governorates in <strong>Yemen</strong>, covering a totalarea of 13,046 km 2 which makes it the fifth largest governorate in <strong>Yemen</strong> by its total area. LahjGovernorate is located 320 km southwest of the Capital City of Sana’a and 30 km to the east ofthe City of Aden. Al-Houta is the capital city of Lahj and is considered a crossing point to andfrom many governorates. Al-Houta is also a favorite stopover for tourists, because of thepresence of vital facilities, administrative centers and markets. Sultan Abdali Palace isconsidered to be the most prominent architectural landmark of Houta city. The condition of theroad to Al-houta and the inter district roads are generally good.Lahj governorate borders Abyan governorate in the East, Taiz governorate to the Southeast, Al-Baidha governorate to the Northwest and Aden governorate to the South. The governorate issubdivided into 15 districts (muderiah).Figure 1: Map of Lahj governorate (Map: OCHA <strong>Yemen</strong>)12
DemographyThe total population of Lahj governorate is estimated to be 869,253 1 with a sex distribution of50% (435028) females and 50% (434225) males. The average family size is estimated to be 7persons per household. According to health office information, 793,964 (91%) of the totalpopulation live in the rural areas.TopographyThe topography of Lahj varies from high mountains reaching 2500m above sea level as part ofAs-Sarat mountainous range, to fertile valleys, such as Wadi Tuban, which is one of the mostfertile Wadis in <strong>Yemen</strong>. The Mountainous Areas of Lahj are rich in natural resources forenvironmental tourism such as: The Forest of Irf-Maqatirah and areas in the mountains ofYafi'a, which grows some of the finest <strong>Yemen</strong>i coffee. The villages of Yafi'a also arecharacterized with their own architectural features, such as the reliance on stone and their highrise floors. Islamic landmarks in the governorate include the Al-Nour Mosque in Al-Mousat.There are still annual pilgrimages to various tombs in the different areas of Lahj Governorate topay tribute to respected Islamic notables of the past.ClimateThe governorates climate varies according to the topography of the terrain. In the coastalplains the temperature can rise in the summer to 32 o C, where the mean temperature in thewinter comes down to 20 o C. The coastal plains also witness rainfall in the winter and autumn.However, in the mountainous highlands, rainfall is witnessed in the spring and summerseasons.AgricultureThe total cultivated area in the Governorate of Lahj is 60,000 feddans. The most popular wadisare Wadi Tuban, Wadi Wirzan, Wadi Yahr, Wadi Saba and Wadi Al-Rruja’a. Along the banks ofWadi Tiban, a number of recent dams were constructed. Since Wadi Tiban is characterized by asemi-tropical climate this fills the gardens of Lahj Governorate with vegetables, fruits, varioustypes of grain and long fiber cotton and with the lovely scents of blossoms and flowers.1 Source: the total population of the governorate in 2012 projected based on the 2005 census13
2. OBJECTIVES OF THE SURVEYThe main purpose of the survey was to assess the nutrition situation of the Lowland andMountainous communities. The final outcome of the survey would be to makerecommendations for the purposes of guiding the design and implementation of an appropriateresponse in Lahj governorate.The specific objectives were as follows:• Nutritional statuso To determine the prevalence of global and severe acute malnutrition amongchildren aged 6-59 monthso To determine the prevalence of stunting and underweight among children aged6-59 months• Morbidityo To determine the prevalence of diarrhea, fever, acute respiratory infection (ARI)and suspected measles in the previous one month among children aged 6-59months• Mortalityo To determine the retrospective crude and under-five mortality rate for the 3months prior to the survey• Infant and Young Child Feedingo To gain a better understanding of infant and young child feeding practicesincluding the minimum meal frequency for children 6-24 months.• Water and Sanitationo To estimate access to safe water among householdso To determine the hygiene and sanitary practices among households• Food Securityo To understand the coping strategies of households at times of acute foodshortage• Programme Coverageo To estimate the proportion of households using to iodized salto To estimate the proportion of children aged 9-59 months vaccinated againstmeasleso To estimate the proportion of children aged 6-59 months who have receivedvitamin A supplementation within the 6 months time period prior to the survey14
3. MATERIALS AND METHODS3.1. Survey timingData were collected in the two survey areas during June and July 2012. Lowland communitydata collection was completed in 7 days between 30 June - 7 July 2012, and the Mountainousareas completed in 6 days between 8 th and 14 th July, 2012.3.2. Survey designBecause of the perceived differences across the districts in the same governorate, it was agreedto assess the nutrition situation among two different population groups: “Lowland Community”to represent the population residing in Lowland households, and “Mountainous Community”that to represent the population living in Mountainous areas. Surveys included all the fifteendistricts as sampling universe. Hence there were two separate cross-sectional surveysconducted, one representative of the Lowland community populations of 9 districts and theother survey representative of the Mountainous population residing in 10 districts.Systematic random sampling using probability proportional to size (PPS) and SMARTmethodology was used to select the clusters for each survey. Households were the samplingunit in the clusters, with mothers and care takers’ of children under 5 years as respondents.3.3. Sample SizeSample size for malnutrition and mortality is calculated separately as described below.a) Sample size for Severe Acute Malnutrition (wasting)The sample size calculation was performed with the assumption that the expected prevalenceof acute malnutrition would be 15.1%, with 4% precision and a design effect of 2 (Table 1a).15
Under 5 Non SampleTable 1a: Assumptions for calculating the anthropometry sample sizeZones Estimated Acute Desired Design AveragePrevalence (%) 1 (%)Size 3 (%) 4 household (N)(%) 5(Stratum) Malnutrition Precision Effect 2 Household year old response SizeMountain 15.1 4 2 7 15.8 5 709Lowland 15.1 4 2 6.1 16 5 803Considering the time needed to travel daily, taking the measurements and complete the forms,it was estimated that a team could visit 20 households per day. The total number of clusters tobe surveyed is estimated by dividing the total number of households to be visited by each teamper day, which gives a cluster of 36 in Low Land and 40 in Mountain Zones. The overallanthropometry sample size of the two Zones (stratum) is presented in Table 1b.Table 1b: Estimated sample sizes and clusters for nutritional status (anthropometricmeasurements) by zones with 20 households to be surveyed per day.S. No Zones(stratum)Estimatedsample sizeHouseholds to bevisited/ day/clusterTotal clusterper surveyDays to complete thesurvey for 6 teams 61 Mountain 709 20 36 62 Lowland 803 20 40 7b) Sample size for crude death rateTo calculate the sample size for estimating the death rate one needs to know the crude deathrate/10,000 population/day. The estimated U5MR mortality rate from <strong>Yemen</strong> Family HealthSurvey 7 2003 was 101.9/1000/year, which was divided in to three 8 and used as the estimate forcalculating sample size for mortality (Table 2a).1 WFP. CFSS, <strong>Yemen</strong>. May 20122 An assumption was made that within the Zones (stratum) selected, the population are expected not to be equallyaffected and differences to be seen on the level of malnutrition between clusters due to differences in access toservices and information, etc3 Calculated on basis of Central Statistics office data of population versus households4 Estimated on basis of MoPHP reports and immunization statistics5 Non-response rate of 5% was estimated to account for refusal, security-related inaccessibility or absence.6 This is an estimate that does not allow for delayed access due to weather or security conditions.7 <strong>Yemen</strong> Family Health Survey, 20038 From earlier surveys conducted in various governorates, it was estimated that the level of CMR is one-third of theU5MR16
Table 2a: Assumptions for calculating the anthropometry Sample SizeEstimated Desired Design AverageMortality Precision Effect 9 HouseholdPrevalence (%)Size(%)Zones(Stratum)RecallPeriod(days)Nonresponsehousehold(%)Mountain 0.9 0.4 1.5 7 90 5 590Lowland 0.9 0.4 1.5 6.1 90 5 677Considering that a maximum 20 households can be surveyed per day per team, the number ofclusters is 30 in Mountain and 34 in Lowland Zones. The overall mortality sample size of the twoZones (stratum) is presented in Table 2b.SampleSize(N)Table 2b: Estimated sample size for Mortality and clusters by Zones with 90 days recall period(DEFF of 1.5, CMR of 0.9/10000/day and precision of 0.4 with 20 households per cluster)S. No Zones (Stratum) Estimated samplesizeHouseholds to bevisited/ day/clusterTotal cluster persurvey1 Mountain 590 20 302 Lowland 677 20 34Conclusion about sample size: As shown above in Table 1b and 2b, the total number of clustersto be visited in order to estimate the under-five nutritional status and CMR in the two Zones(stratum) differ slightly. SMART methodology recommends selecting the higher householdnumber when the anthropometric and mortality sample sizes vary. In this case, theanthropometric sample size was used for the survey. This implies that although only 30 and 34clusters are needed for the mortality data collection in Lowland and Mountain zonesrespectively, the actual number of clusters surveyed followed the anthropometric calculations,i.e., 36 and 40 clusters. Therefore, mortality data was collected in all households visited foranthropometric measurements.9 An assumption was made that minor heterogeneity in the death within clusters17
3.4. Sampling methodologya) Sampling universeIn Lahj governorate, districts are subdivided in to sub-districts; which are further divided intovillages. The universe that the samples were drawn was based on the complete list of ‘villages’in all the fifteen districts and the best available population estimates of the selected villagesobtained from the central population office.b) Cluster selectionSince it is difficult to obtain an updated sampling frame of under-five children or households atvillage level, village level population data was used for cluster assignment. A total of 40 clusterin Lowland and 36 in Mountainous zone were randomly selected by assigning probabilityproportional to population size (PPS) using ENA software (Annex I & II)c) Household selectionThe survey teams visited the selected cluster location and met village leaders. The team leaderexplained the purpose of the survey and survey procedures. After obtaining the initialpermission of village leaders, participation from each household was requested.After the cluster location was identified, the nutrition survey teams use the modified EPImethod. In the centre of each cluster 10 , the survey team chooses a direction by using the“spinning pencil method”, whereby a pen is thrown into the air to decide the way of direction.The team leader walked to the boundary of the cluster following the direction of the pen. Whenthe border was reached, a new direction was randomly selected by spinning pen again until itpointed into the body of the cluster.Then, the team leader walked to the end of the selected direction counting all the availablehouseholds (HHs 11 ) and after obtaining initial consent from a household member marked thehousehold with a board marker. The first house was selected by using a random table (AnnexIII). The second house was taken by proximity, when leaving the houses and continues until therequired data was collected.10 The centre of the cluster was determined with the assistance of a village chief /leader11 A household was defined as persons routinely sharing food from the same cooking pot and living in the samecompound or physical location as this is considered one household in Lahj context. Members of a household maynot necessarily be relatives by blood or marriage. A polygamous family living and eating together was consideredto be one household18
Teams attempted to collect data from 20 households per cluster. All chosen households wereselected to answer the household and mortality questions, whether or not they contained achild 6–59 months of age. If household members were not present during the survey, the teamrevisited the household at least three times in an effort to interview and measure eligiblehousehold members, unless security or logistical constraints prohibited the amount of timespent in a cluster. In situations where the members of a household had departed permanentlyor were not expected to return before the survey team had to leave the cluster, that particularhousehold was skipped and not replaced. The minimum age of respondents for interview was15 years old. When respondents could not provide accurate information, households wererevisited and if accurate information could not be obtained, those questions were marked asmissing in the questionnaire. All eligible children aged 6 to 59 months were measured in thecluster. If a child’s age was unknown, it was estimated using a seasonal/local calendar. Absentchildren were followed up during the survey day. Children present the day of the survey, butwho are not living in the household are not included in the survey.3.5. Training and survey team compositionSix teams were trained for the survey and each team consisted of 4 members – two femalemeasurers and one female interviewer and one male team leader were recruited, trained andsubsequently participated in the data collection and conduct of the survey. Females collectedinformation from the mothers/care takers’ and conducted weight and height measurements ofthe children. Male members carried the instruments, arranged and helped in anthropometricmeasurements and conducted the sampling at each cluster. The training of team members(interviewers, measurers and team leaders) by the survey consultant and manager wasconducted at Al-houta for 4 days.More than half of the training sessions focused on anthropometric measurement and eachsurveyor had to practice both in the classroom and in the community before qualifying to jointhe team. Adequate attention was given in training on standardizing the instrument and keeprecord of the procedure and variation or error (if any). The team was trained on interviewtechniques, the format of questionnaires as well as on data recording and reviewingtechniques. The team leaders were trained for editing the questionnaires in the field and inquality assurance techniques. The training also covered basic introduction to nutrition such asdefinition of malnutrition, causes, classification and UNICEF framework, explanation on thesurvey and its methodology, and practical training on the important data collection procedures,anthropometric measurement techniques, recognition of the signs and symptoms ofmalnutrition including nutritional oedema.19
As a means to verify anthropometric skills of measurers, to detect differences amongmeasurers and identify their possible causes, anthropometric standardization test was carriedout during the third day of the training’ as the main purpose is qualifying measurers and eachfemale participant had to practice before qualifying to join the team. Ten children weremeasured once by the survey consultant and manager and each of the 18 female surveyors.Normally, each enumerator is supposed to measure 10 different children twice with a timeinterval between individual measures that means one child to be measured 38 times. However,after the children were measured 19 times (end of round one), the children were crying andrefused to take the second round. Each surveyor had managed only a single measurement ofeach child. As a result it was not possible to calculate both precision and accuracy of eachenumerator using ENA/SMART standardization exercise. However, the accuracy was analyzedbased on single measurement. The weak team members were identified and the commonmistakes made were identified and addressed. Extra training and support was given based onthe scores attained by each surveyor during the standardization test.Pre-testing of the questionnaire was done, in a village that is not part of the survey sample, inorder to provide practical training for the survey members on how to identify selectedhouseholds, how to fill questionnaire, complete interviewing households, demonstration ofmalnourished children and how to compile the data files. Data collection took place during June30 to July 7 for the Lowland community during July 8 to 14, 2012 for the Mountain community.3.6. Field supervision and quality assuranceThe survey consultant who was also the manager was responsible for the supervision of theassessment teams and for the overall coordination of the nutrition survey activities. Constantsupervision and monitoring of all field activities, editing, was emphasized. Concurrentcrosscheck of the data collected by interviewers was performed by the survey consultant in arandom sample of households.The team leaders were responsible for strictly following the day-to-day activities of measurersand interviewers. Team leaders were reviewed all questionnaires every day before the teamsleave a household so that any mistakes could be checked on the spot and necessary correctionbe made. Team leaders were responsible to verify the accuracy of the details before the teamsleave a household, thus minimizing possibility of incomplete data (missing variables) andoutliers. The survey consultant consulted team leaders for any erogenous or irregular data on adaily basis. Discussions were conducted in each day after the teams returned from field datacollection.20
Each weight scale was numbered and calibrated daily prior to data collection using a standardweight of 10 Kg to ensure the scale is sturdy, reliable and accurate. All the scales were accurateand no adjustment factors were required.Data entry of the completed questionnaires was done by professional statisticians on a dailybasis. Random check of the data entry of questionnaire (10%) was done by the surveyconsultant and manager using the Microsoft Excel programme, and consistency checks wererun to detect and correct data entry errors including re-entry and systematic data checking.Survey manuals were provided to the teams as part of the training, to ensure appropriateguidance in the survey implementation.3.7. Data collection methods 123.7.1. Anthropometric measurementsThe following data was collected to all children aged between 6 and 59 months.Age (in months) of the children is, in the first instance, established by an official documentstating his data of birth (birth certificate, immunization card, etc). In this case, the surveyorsverify that the child is above 6 months and below 60 months and record the exact date of birth.If the child does not have an official document mentioning his date of birth, the age of the childestimated in months with the help of a local calendar of events using religious, agricultural andseasonal events (Annex IV & V)Gender: Male children are recorded as ‘M’ and female as ‘F’.Height/Length: Height and length of children was measured using height boards and recordedto the nearest 0.1cm. Children less than 87cm are measured lying down and those more than87cm standing up. Before taking the height/length, caretakers were requested to take off shoes(if any). For children measured standing up, the measurers are trained to ensure that the child’shead, shoulder blades, buttocks, calves and heels are touching the board and that they arelooking straight ahead. Children measured lying down are placed in the middle of the boardwith the head touching the fixed end, the knees pressed down and the heels touching themovable base of the board.12 In the absence of emergency nutrition assessment guideline for <strong>Yemen</strong>, anthropometric measurement techniquesfollowed those outlined in the SMART methodology. Measuring Mortality, Nutritional Status, and Food Security inCrisis Situations. Version 1. April 2006.21
Weight was measured by using UNISCALES and recorded to the nearest 0.1kg. All children weremeasured without or with light clothing.Oedema is diagnosed by applying normal thumb pressure to the anterior surface of both feetfor three seconds. If an indentation remains after the pressure is removed, presence of edemais considered positive and a “Y” is entered on the data collection form. If the thumb imprintdoes not persist, or if the edema is not bilateral, the child is recorded as not having edema andan “N” is entered on the data collection form. The survey consultant has to check and verify allpositive or questionable cases of edema.Mid Upper Arm Circumference (MUAC) was measured on the left arm of all sampled 6-59months old children following all the 10 steps for measuring MUAC as recommended in theAnthropometric Indicators Measurement Guide 13. MUAC was recorded to the nearest 0.1cm.Vaccination and Vitamin A supplementation coverage: Measles coverage was assessed amongchildren 9-59 months by firstly checking the vaccination /MCH card. Where cards were notavailable, a verbal recall (yes, No or do not know) from the mother or caretaker was recorded.Polio immunization coverage was assessed among all among 6-59 months old children by firstlychecking the vaccination/MCH card where possible and a verbal recall by mothers/care takers.Vitamin A supplementation coverage was asked by demonstrating the blue capsule and askingmothers whether their child had received this capsule in the six month period prior to thesurvey.Morbidity: Retrospective morbidity information was collected on selected illness (diarrhea,fever, cough and suspected measles) within a 14 day recall period. Morbidity information relieson the mothers’ perception and memory of the child/children’s illness and is thereforeconsidered to be very subjective.Mosquito net: All the care takers’ were asked if the child sleep under mosquito net the nightprior to the survey.Programme registration: All mothers were asked if the child currently registered at a nutritioncenter.13 Anthropometric Indicators Measurement Guide. 2003 Revision. Bruce Cogill. Food and Nutrition TechnicalAssistance Project (FANTA). Academy for Educational Development22
3.7.2. Mortality DataThe SMART methodology was used to estimate mortality. Mortality was assessed in the entirepopulation of the selected households (Annex VI). Mortality data was collected regardless ofwhether or not there were any children under five years in a household. Information wascollected on all household members alive on the date of the interview, alive on the first day ofthe 90 day recall period, and individuals who were considered household members sometimebetween the first day of the recall and the interview. The current status was requested for eachindividual (alive, dead, or unknown). The cause of death was also recoded. Apart fromconsidering the number of people currently in the households, those who were present at thebeginning recall period, birth and deaths, the methods takes into account the number of peoplewho joined or left the households during the recall period. The number of days was calculatedfrom the beginning of the observation period to the midpoint of data collection, which variedbetween the two surveys.3.7.3. Household DataInformation on household composition- total number of family members, under-five and under6 month, head of household, marital status of head of household, source of household incomeand education level of caregiver was collected from each of the sampled households.Breastfeeding status and meal frequency for 6-24 months children collected through recall ofthe care takers’. Information on access to health services was assessed through recall of thecare takers’ using the household questionnaire. The information on main source of drinkingwater, water treatment practice, hand washing practice and type of toilet facility were allassessed through interviews with the mothers. Key information on food security situation wasalso gathered through household interview questionnaire (Annex VII)3.8. Ethical considerationsAll children that were diagnosed as severely or moderately malnourished based on Weight /Height, MUAC or with oedema were referred to the nearest OTP centre for treatment (referralslips were provided to each team leaders to facilitate the process (Annex VIII).3.9. Data AnalysisFor data entry, databases and entry screens were developed using Microsoft Excel. For dataanalysis, the data tables were converted to ENA software for SMART (version June 2011) fornutritional data analysis and spss version 16.0 for analysis of information on feeding practices,23
vaccination coverage, morbidity and other households variables. A p-value
4. RESULTSTable 3 shows the sample details and household interview response rates for the survey. A totalof 1,512 households were selected, of which 1,504 were interviewed, yielding a householdresponse rate of 99.5%.Table 3: <strong>Response</strong> rates and sample details for survey areas, Lahj governorate, July 2012Ecological Zone Lowland MountainousClusters in sample 40 36Households sampled 803 709<strong>Response</strong> rate 99.5 99.4Number of Households 799 705Number of Children (6-59 months) 803 7684.1. Demographics and socio-economic characteristics4.1.1. Household compositionInformation about the composition of household by sex of the head of the household andsize of the household is presented in Table 4. Among all the heads of households inMountainous areas, 94.3% were male, while only 5.7% were female. This percentagedecreases slightly for Lowland households with 92% male-headed and 7.8% female-headed.Households with 10 to 14 members account for 15.3% of Mountainous households,compared with 14.3% of Lowland households. Similarly, the proportion of 15 or moremember households is higher in Mountainous households (2.8%) than in Lowlandhouseholds (2.0%).The average household size in the Lowland and Mountain community are comparable atapproximately 7 members per household. Lowland community had an average of 6.87people per household and the Mountainous community had an average of 7.05 people perhousehold. The mountainous community had the most number of children per householdof the two surveys, including highest percentage of households under children under 6months old. The average number of under-fives was 1.19 and 1.09 in Mountainous andLowland areas, respectively.25
Table 4: Percent distribution of households by sex of head of household and by household size,according to ecological zone, Lahj governorate, July 2012LowlandMountainousEcological Zone% N % NSex of household headMale 92.2 737 94.3 665Female 7.8 62 5.7 40Number of family membersLess than 5 24.0 192 22.7 1605-9 59.7 477 52.2 41710-14 14.3 114 15.3 108More than 15 2.0 16 2.8 20Number of households 799 705Mean family size 6.87 7.05Mean number of under-fives 1.09 1.19Mean number of 6-59 months children 1.01 1.09Note: table is based on family members who are alive and living with the household on the date of the survey4.1.2. Characteristics of household headThe majority of household heads were married in both survey areas (95% in Mountain and 92%in Lowland). 5.9% In Lowland and 3.9 in Mountain were divorced, while 1.1% in Lowland and2.0% in Mountain were single at the time of the survey.A majority of the household heads were salaried. The proportion, however, significantly variedbetween Lowland and Mountainous locations (62.1% in Lowland as compared to 29.2% inMountain). The main source amongst the Lowland remains monthly salary wage, yet theMountainous areas show more diversity in source of income: remittance (25.8%) and causalwork (23.5%).26
Table 5: Percent distribution of household head by marital status and source of income, Lahjgovernorate, July 2012LowlandMountainousEcological Zone% N % NMarital statusMarried 92.0 735 94.0 663Widowed 5.9 47 3.9 27Divorced 1.0 8 0.1 1Single 1.1 9 2.0 14Primary source of incomeNon-qat agricultural products 2.4 19 3.5 25Livestock and livestock products 4.1 33 0.9 6fishery 1.6 13 0.1 1Trading 2.1 17 6.1 43Temporary work (Casual work) 13.9 111 23.5 166Monthly salary 62.1 496 29.2 206Remittance (from friends and4.5 36 25.8 182relatives)Craftsmanship 4.4 35 5.4 38Farming/sale/transport of qat 1.9 15 1.4 10Social insurance 1.1 9 1.3 9Other 1.9 15 2.7 194.1.3. Education level of child care giversThe overall education level of care givers was good in both survey locations (Table 6). InMountain community, 29.1% had basic education, 19.7% secondary education and a further20.1% had higher education. Less than a quarter (16.9%) was illiterate. Similarly in Lowlandcommunity, 24.2% had basic education, 23.5% secondary education and 19.8% had tertiaryeducation. Nearly a quarter were illiterate and one tenth can read and write.Table 6: Percent distribution of households by level of education of the caregivers’ by ecologicalzones, Lahj governorate, July 2012LowlandMountainousEcological Zone% N % NLevel of educationIlliterate 22.2 177 16.9 119Can read and write 10.4 83 14.2 100Basic education 24.2 193 29.1 205Secondary education 23.5 188 19.7 13927
Tertiary education (university,college, or institute)19.8 158 20.1 1424.2. Anthropometric results: children (based on WHO reference 2006)The prevalence of malnutrition is given in z-scores which are internationally recognized to bethe preferred method of reporting survey data.4.2.1. Anthropometric data qualityA total of 9 children were not measured in chosen households due to various reasons (out ofvillage in town, child sleeping and mother refused to wake child, child crying and motherrefused). 3 children were excluded due to incoherence in the data (1 child was excludedbecause the height was not recorded, 2 children were excluded because their ages were out ofrange).The survey collected data on the nutritional status of 1562 children between 6-59 months ofage (799 in Lowland and 763 in Mountain areas). A total of 27 children (20 children in theLowland sample and 7 children in the Mountian sample) were removed from the analysisbecause they were flagged by SMART based on extreme z-scores values (z-scores < -3 and > 3SD). Therefore, the final analyses are based on data from 1559 children in ages 6-59 months(797 children in Lowland and 762 children in Mountain)4.2.2. Age and sex distribution of the sample populationThe age and sex distribution of the sample population in the two surveys is illustrated in Table 7and Table 8. The boy to girl sex ratio was 1.0 in Lowland and 1.1 in Mountain, which is withinthe recommended range of 0.8-1.2 showing an unbiased selection of the study children.Similarly, the distribution of the sample children age groups did not also vary from the normalaccepted percentage, which also shows that the sample was unbiased. The 6-29: 30-59 monthratio in Mountainous sample is 0.99 which indicates that the sample was unbiased. The ideal is1.0. Slight bias was exhibited in the Lowland age distribution estimated at 0.91. It is within theacceptable range of 0.78-1.18 and was found to be acceptable.28
Table 7: Age and sex distribution of the sample population, Lowland ecological zone (n=797)AGE GROUP Boys Girls Total Ratio(months) no. % no. % no. % Boy:girl6-17 100 54.6 83 45.4 183 23.0 1.218-29 90 45.9 106 54.1 196 24.6 0.830-41 87 49.2 90 50.8 177 22.2 1.042-53 95 51.4 90 48.6 185 23.2 1.154-59 28 50.0 28 50.0 56 7.0 1.0Total 400 50.2 397 49.8 797 100.0 1.0Table 8: Age and sex distribution of the sample population, Mountainous ecological zone (n=762)AGE GROUP Boys Girls Total Ratio(months) no. % no. % no. % Boy:girl6-17 109 50.2 108 49.8 217 28.5 1.018-29 82 50.6 80 49.4 162 21.3 1.030-41 92 53.8 79 46.2 171 22.4 1.242-53 83 55.3 67 44.7 150 19.7 1.254-59 29 46.8 33 53.2 62 8.1 0.9Total 395 51.8 367 48.2 762 100.0 1.1In addition, skewness and kurtosis test of weight-for-height (WHZ) data show distributionbetween -1 to 1 and standard deviation of 1.1 of WHZ which also unbiased distribution of thesample children. The overall plausability score of the two surveys was 7%, which is consideredas good 14 .4.2.3. Acute Malnutrition4.2.3.1. Acute Malnutrition rates by sexThe prevalence of acute malnutrition in the survey areas is presented in Table 9. Prevalence ofglobal acute malnutrition (GAM) among Lowland households was found to be 23.0% (with 95%CI 19.4-27.1%) and severe acute malnutrition (SAM) of 4.5% (with 95% CI 2.9-7.0%). GAMamong Mountainous households was found to be 14.3% (with 95% CI 11.0-18.3%) and SAM of2.8% (with 95% CI 1.7-4.5%).The global acute malnutrition rate among Lowland households was significantly higher than theMountainous households (p=0.001) 15 . Although the severe acute malnutrition rates was higheramong Lowland households, the difference was not significan (p=0.156). There were no14 Refer Annex IX for plausability check results15 Comparison was made using Centers for Disease Control and Prevention (CDC) calculator for two surveys29
children with oedema in both in the Lowland and Mountainous ecological zones. Malnutritionwas presented as marasmas /wasting only. There was highly significant difference in theprevalence by sex among the Lowland communities. It was found that the prevalence of acutemalnutrition was higher among boys than girls in the Lowland communities (p=0.000). Similarly,the prevalence of malnutrition was found to be higher in boys than girls in Mountainouscommunities, but the difference was not found to be significant.Table 9: Prevalence of Acute Malnutrition/Wasting (6-59 months) by survey area and by sex, with 95%confidence intervalsLowland (%) Mountain (%)All Boys Girls All Boys GirlsGlobal Acute Malnutrition(
Figure 2 Acute Malnutrition of Lowland by ageFigure 3 Acute Malnutrition of Mountain by age4.2.4. Chronic MalnutritionThe stunting rate (HAZ) is a measure of chronic malnutrition while underweight (WAZ) ratemeasures both chronic and acute malnutrition. Both underweight and stunting rates rely onaccurate age records. In this survey, accurate records of a child’s age were not available forverification in almost half of the children (48% children in Lowland and 46% children inMountain had no exact birthday). Age estimation based on mother recall may not be accuratealthough a calendar of events was used to estimate the child’s age. Therefore, it should benoted that the stunting and underweight rates recorded in the survey might be subjected tomothers recall bias and care should be taken when interpreting the results. As shown in Table10, the stunting rate was 35.1% in Lowland community and 46.9% in Mountainous children. Theprevalence of global chronic malnutrition was not statistically different between boys and girls.Table 10: Prevalence of Chronic Malnutrition/Stunting (6-59 months) by survey area and by sex, with95% confidence intervalsLowland (%) Mountain (%)All Boys Girls All Boys GirlsGlobal Chronic Malnutrition(H/A
Figure 4 Chronic Malnutrition of Lowland by ageFigure 5 Chronic Malnutrition of Mountain by age4.2.5. UnderweightAmong children 6 to 59 months of age, 40% in Lowland households and 41% in Mountainoushouseholds were underweight (Table 11). There was little difference in the prevalence ofunderweight between boys and girls.Table 11: Prevalence of Underweight months) by survey area and by sex, with 95% confidence intervalsLowland (%) Mountain (%)Alln = 786Boysn = 394Girlsn = 392Alln = 757Boysn = 395Girlsn = 362Underweight(W/A
Figure 6 Underweight of Lowland by ageFigure 7 Underweight of Mountain by age4.2.6. Distribution of anthropometry results compared to international referenceThe distribution of malnutrition within the community populations sampled is very similar toone another. With reference to acute malnutrition, in Lowland community the samplepopulation is shifted to the left by -1.29 z-scores when compared with the reference with afairly even distribution. This indicates that the sample population is more malnourished thanthe reference population. The results are similar for Mountain community population with askewing to the left of -1.03 z-scores.Observed Z-score distributions (WHZ) compared to international reference(6-59 months), Lahj Lowland Community Survey, <strong>Yemen</strong> July 2012Observed Z-score distributions (WHZ) compared to internationalreference (6-59 months), Lahj Mountainous Survey, <strong>Yemen</strong> July 201233
With reference chronic malnutrition, the population distributions for Lowland and Mountainare shifted to the left by -1.54 and -1.93 z-scores when compared with the reference populationrespectively. This indicates that both communities’ populations are very stunted whencompared with the reference population.Observed Z-score distributions (HAZ) compared to international reference (6-59 months), Lahj Lowland Community Survey, <strong>Yemen</strong> July 2012Observed Z-score distributions (HAZ) compared to internationalreference (6-59 months), Lahj Mountainous Survey, <strong>Yemen</strong> July 2012With reference to underweight, the Lowland sample population is shifted to the left by -1.73 z-scores when compared with the reference population with a fairly even distribution. The resultsare identical for the Mountain population with a skewing to the left of -1.78 z-scores. Thisindicates that the sample populations are more malnourished than the reference population.34
Observed Z-score distributions (WAZ) compared to international reference (6-59 months), Lahj Lowland Community Survey, <strong>Yemen</strong> July 2012Observed Z-score distributions (WAZ) compared to internationalreference (6-59 months), Lahj Mountainous Survey, <strong>Yemen</strong> July 20124.3. MortalityA total of 12 deaths (9 in Lowland and 3 in Mountain) were recorded (Table 12). CMR (totaldeaths/10,000 people/day) was estimated at 0.18 (0.10-0.32) in Lowland communities and 0.06(0.02-0.20) in Mountainous communities. The under five mortality rates (U5MR) (deaths inchildren under five/10,000 children under five / day) were 0.25 (0.06-0.99) and 0.13 (0.02-0.99)in Lowland and Mountainous communities, respectively. Both the CMR and the U5MR arebelow the emergency thresholds of 1.14/10,000/day and 2.33/10,000/day respectively 16 .The cause of death for the under-five children was reported to be difficulty in breathing (1child) and unknown causes (2 children). None of the deaths were verified through medicalexaminations, but the causes of deaths were assessed using standard case definitions.Table 12: Prevalence of Chronic Malnutrition/Stunting (6-59 months) by survey area and bysex, with 95% confidence intervalsTotalUnder fivesNo. of reporteddeaths*CMR per10,000/dayNo. of reporteddeaths*U5MR per10,000/dayLowland 9 0.18 (0.10-0.32) 2 0.25 (0.06-0.99)Mountain 3 0.06 (0.02-0.20) 1 0.13 (0.02-0.99)*Within 3 month of the survey16 Emergency mortality thresholds by Sphere (2004)35
4.4. Population PyramidMortality data was collected from 1504 households containing more than 10,000 familymembers (1,729 under 5 years). Among the families of the surveyed population 15.8% inLowland and 16.2% in Mountainous areas were under five years old. The resulting populationpyramid for each zone is shown below.4.5. Feeding practices4.5.1. Breastfeeding by ageAs shown in Table 13, only 70% and 67.7% of children aged 6 to 24 months were still beingbreastfed in Lowland Zone and Mountainous Zone, respectively. The breast-feeding rate forchildren 6 to 11 months of age was 83.5% and 88.1% and this rate drops to 62.9% and 56.3% forchildren 12 to 24 months in Lowland and Mountain, respectively. The finding of the surveyclearly suggested that continued breastfeeding up to 24 months of age is not well practiced inLahj governorate.Table 13: Percent distribution of children born in the two years preceding the survey andstill breastfeeding, according to age, Lahj governorate, July 2012Lowland MountainousEcological ZoneN % N %Age in Months6 - 11 86 83.5 104 88.112 - 23 122 62.9 112 56.336
Table 13: Percent distribution of children born in the two years preceding the survey andstill breastfeeding, according to age, Lahj governorate, July 2012Lowland MountainousEcological ZoneN % N %Total 208 70.0 216 67.7Note: Still breastfeeding status refers to a "24-hour" period (yesterday and last night)4.5.2. Minimum meal frequency of childrenThe minimum meal frequency for infants is a proxy indicator for energy intake from foods otherthan breast milk. It is defined as 2 times for breastfed children 6 to 8 months of age, 3 times forbreastfed children aged 9 to 23 months and 4 times for non-breastfed children aged 6 to 23months. The results are being reported separately for breastfed (Table 14a) and non-breastfed(Table 14b) children.Table 14a: Percentage of still breast feeding children, 6 to 23 months old, who received theminimum* number of meals, Lahj governorate, July 2012LowlandMountainousEcological Zone% N % NAge Group6-11 51.9 42 56 53.812-17 59.6 28 41 56.918-23 61.8 42 25 62.5Total 57.1 112 122 56.5*Minimum defined as 2 times for breastfed infants 6-8 months, 3 times for breastfed infants 9-23 months, 4times for non-breastfed infants 6-23 monthsAmong those children 6 to 23 months of age and still breastfeeding (Table 14a), 57.1% inLowland and 56.5% in Mountain zones received the minimum number of meals. In bothecological zones, it was higher among the older children, with 61.8% and 62.5% of the 18 to 23months old children in Lowland and Mountain, respectively received the minimum number ofmeals. 51.9% and 53.8% of children 6 to 11 month of age, and 59.6% and 56.9% of the 12 to 17month olds in Lowland and Mountain respectively, received the minimum number of meals.37
Table 14b: Percentage of non breast feeding children, 6 to 23 months old, who received theminimum* number of meals, Lahj governorate, July 2012LowlandMountainousEcological Zone% N % NAge Group6-11 17.6 3 7.7 112-17 14.8 4 19 418-23 30.0 12 20 10Total 22.6 19 17.9 15*Minimum defined as 2 times for breastfed infants 6-8 months, 3 times for breastfed infants 9-23 months, 4times for non-breastfed infants 6-23 monthsAmong the children 6 to 23 months of age who were no longer breastfeeding (Table 14b), only22.6% in Lowland and 17.9% in Mountain have received the minimum number of meals fortheir age in the previous day. This finding has serious implications on the lack of maternalknowledge in regards to appropriate child feeding practices. Overall, the finding clearlyindicates a troublesome situation.4.6. Morbidity and Health seeking behavior4.6.1. Child MorbidityHigh prevalence of common childhood diseases was recorded in both the Lowland andMountainous Ecological zones (Table 15). Major diseases were cough, fever and diarrhoearelated, of which ARI and Fever were the most prevalent illness reported in Lowland andMountainous zones, respectively.For diarrhea, there was no important difference among the survey areas. Nearly 29% ofchildren in Mountainous zones had experienced diarrhea in the two weeks prior to the survey,while in the Lowland communities it was approximately 28%. The prevalence of ARI was higheramong the Lowland populations than the lowland populations. Nearly half of children (48.5%)in Lowland had experienced ARI in the two weeks prior to the survey, while in the Mountaincommunities it was approximately one third. The prevalence of Fever was also very high in theLowland population with over 42% of the children under 5 suffering in the two weeks prior tothe survey. The prevalence of Fever in the Mountainous populations was approximately 37%. Itshould be noted that the morbidity data collected are subjective in the sense that they arebased on the mother’s perception of illness without validation by medical personnel.38
Suspected measles 17 during the last month was 6.1% in Lowland Zone and 7.8% in MountainousZone.Table 15: Morbidity among children 6-59 months, Lahj governorate, July 2012Lowland MountainousEcological Zone% N % NMorbidityExperienced diarrhea during last 2 weeks 27.9 221 28.8 220Experienced cough with difficulty breathing during 48.5 385 33.9 260last 2 weeks (ARI)Any fever during last 2 weeks 42.8 339 37.3 286Suspected measles within one month prior toassessment6.1 48 7.8 604.6.2. Health careThe majority of the community populations surveyed seek for illness outside of the home(Table 16). In the Lowland zone 95.6% sought treatment outside of the home, while inMountain it was higher at 97.7%. In the Lowland community the majority (78.5%) of peoplesought treatment in a public health facility (hospital/clinic/health center); in addition treatmentin private clinics (13.6%) was common. Similarly in Mountain community the majority of peoplesought from a public health facility (78.9%); in addition treatment in private clinic (18.3%) wascommon. Only 2% do not seek for medical assistance during illness.The main reasons given for seeking medical assistance outside either public facilities or privateclinics are the high cost of the service, the physical distance to these services, and lack oftransportation. However, the finding suggested that the health seeking practices as reported bythe proportion of households seeking treatment from health facilities was generallyencouraging.17 The suspected measles is defined as having rash and fever in addition to at least one of: cough, sore throat, orconjunctivitis.39
Table 16: Health seeking behavior, Lahj governorate, July 2012Lowland MountainousEcological Zone% N % NWhere the health service is soughtNo medical help is sought 2.1 17 2.0 14Sought advice or treatment for illness outside the home 95.6 764 97.7 689Treatment sought:Public health facility (Hospital/clinic/health center) 78.5 627 78.9 556Private clinic 13.6 109 18.3 129Pharmacy 3.0 24 0.6 4Others 0.5 4Sleeping under mosquito netChildren slept under mosquito net last night 23.7 189 20.0 153Only less than a quarter of children slept under a mosquito net the night before the survey. Thepercentage is slightly higher in Lowland Zone (23.7%) than Mountainous Zone (20.0%).4.7. Food securityTable 17 presents a list of coping strategies used by surveyed households by ecological zones.The availability of credit from formal or informal moneylenders, community or family memberswas particularly important, as accessing credit can be an essential coping strategy forhouseholds whose sources of income are constrained and whose home production isinsufficient to meet consumption needs. Table 17 shows that both the Lowland and Mountaincommunities had significant access to credit. Borrowing money to purchase food or purchasefood in credit or mortgage is widely practiced (69.4% in Lowland and 67.8% in Mountain).43% of households in Lowland ecological zones have reduced the size of meals because ofscarcity of resources. The percentage of households reduced meals size was relatively lower forMountainous population when compared to Lowland (28.8%).More than one third of households in Lowland reportedly reduced the number of meals per dayover the past 4 weeks. Further, almost one quarter of households in Lowland areas reportedhaving to go to bed hungry in the 4 weeks prior to the survey. While in Mountainous zones, lessthan a quarter of the surveyed households reduced their consumption to less number of mealsin a day and sleeping hungry is practiced by nearly 14% of households. 25.2% and 17.2% ofhouseholds in Lowland and Mountain areas, respectively reduced the expenditure on educationor food to save money to purchase food, over the 4 weeks prior to the survey.40
The analysis of the information is indicative of the alarming rates of some degree of foodinsecurity in Lahj governorate, where the households in the Lowland ecological zones with thehighest levels of household food insecurity.Table 17: Household coping strategies, Lahj governorate, July 2012Lowland MountainousEcological Zone% N % NCoping strategiesReduce meal size 43.0 243 28.8 202Reduce number of meals 36.0 287 22.0 155Go to bed at night hungry 25.4 203 13.8 97Credit and loan liabilityCredit/mortage or borrow money to buy food 69.4 554 67.8 478Reduce expenditure on education to purchase food 25.2 201 17.2 1214.8. Water, Sanitation and Hygiene4.8.1. Household drinking water and safe water practicesTable 18 shows that among all households, the majority (72% in Mountain and 83% in Lowland)were using improved sources 18 of drinking water. Differences become apparent whencomparing Lowland with Mountain communities by type of improved water sources. Amongthe Lowland communities, the majority (30%) had water piped into the dwelling, while 12% hadit piped into the yard and 19.6% used open protected well source. Among the Mountainousareas, the majority (22%) were using covered rainwater collection tank, 16.7% water tanker andfurther 15.6% water piped into the house.Overall, few households treat water for drinking purposes (5.5% in Mountain and 2.8% inLowland). Of those households that do treat, most boil (51.3%) and few filter it through cleancloth (20.5%) in Mountainous areas, while In Lowland most filter the water through clean cloth(50.0%), with fewer households boiling the water (36.4%).18 Improved drinking water source is defined as being one of the following: piped into dwelling, piped into yard,protected well, protected spring, rainwater collection or bottled water.41
Table 18: Percent distribution of households by source and treatment of water, according toecological zones, Lahj governorate, July 2012Lowland MountainousEcological Zone% N % NWater sourceImproved water source 83.1 664 71.9 507Type of water sourcePiped water connected to home 26.9 215 15.6 110Piped water connected to yard 12.8 102 3.4 24Open, unprotected well 11.3 90 17.6 124Open, protected well 19.6 157 10.1 71Covered rainwater collection tank 0.3 2 22.0 155Open rainwater collection tank 0.1 1 3.4 24Water tanker 17.9 143 16.7 118Bottled water (Hadda, Shamlan, Kawthar, etc) 5.6 45 1.3 9Unprotected surface water (valley, running spring, etc) 1.9 15 6.8 48Protected spring water 0.0 0 2.8 20Other 3.6 29 0.3 2Water treatment for drinkingYes 2.8 22 5.5 39No 97.2 777 94.5 666Type of water treatmentBoil water before drinking 36.4 8 51.3 20Use chlorine or Clorox 0 0 5.1 2Filter through clean cloth 50.0 11 20.5 8Use ceramic or sand filter or similar filter method 9.1 2 17.9 7Other 4.5 1 5.1 24.8.2. Sanitation source and safe hygiene practicesTable 19 shows that there was a slight difference between Lowland households using animproved toilet facility 19 compared to Mountain households. In Mountain community less thanhalf of the population (41.7%) used improved toilet facility, whilst in Lowland, the proportion ofhouseholds using improve facility increases approximately to 51%. A high number ofhouseholds were using an open pit or latrine without slab in Lowland areas (40.8%) as inMountainous areas (45.0%). In Lowland areas, 16.4% of households were not using any facility;they reported using the open field.19 Improved toilet is defined as being one of the following: flush to piped sewer system, flush to septic tank, flush topit latrine or pit latrine with slab42
Hand washing practices among the communities surveyed was highest before and after eatingand after defecation with little difference between Lowland and Mountain ecological zones.Among the Lowland communities, more than two thirds (75.5%) of the people wash their handsafter eating, while 70.1% washed before eating and 61.3% after toilet use. Among theMountainous areas, 70.6% wash their hand before eating, 70.5% after eating and further 63.8%after using the toilet. Use of soap for hand washing in general was good. Mountainous areasreported slightly higher use of soap to wash hands (97.2%) than Lowland areas (92.7%).Table 19: Percent distribution of households by type of toilet/latrine facilities and hand washingpractices, according to ecological zones, Lahj governorate, July 2012Lowland MountainousEcological Zone% N % NToilet facilityImproved toilet facility 41.7 333 50.6 357Type of toilet facilityToilet - Flush/Pour flush 39.2 313 46.2 326Toilet - uncovered pit 40.8 326 45.0 317Toilet - simple dry covered pit 2.5 20 4.4 31Outdoors in the open air (in fields, for example) 16.4 133 4.4 31Other 0.9 7 0 0When do you wash your handsAfter using the toilet 63.8 510 61.3 432Before eating 70.6 564 70.1 494After eating 70.5 563 75.5 532Before cooking 51.2 409 53.1 374Before feeding the child 15.5 124 15.5 109After disposing of child’s waste 18.1 145 17.2 121After cleaning the livestock or poultry areas 17.8 142 20.4 144Substance used to wash handSoap 92.7 741 97.2 685Ashes, dust, limestone powder, tree leaves 5.5 44 1.4 104.9. Programme coverage4.9.1. ImmunizationThe availability of vaccination cards for registering each vaccination is very important forfollowing up the child’s health status and for accurately measuring the coverage by differentvaccinations. The data showed that the percentage of children who had a health card that wasseen by the interviewer does not indicate significant differences in the two ecological zones,43
ut it is noticeable that there is a higher rate of seen cards in the Mountain areas than in thelowland areas (57.1% compared to 52.2%). If measles vaccination (ever) by both mother’s recalland by documentation (vaccination card) is considered the level of immunization among thetwo ecological zones is comparable (approximately 86% in Mountainous and 89% in Lowland).Similarly, approximately 86% and 84% of children in Lowland and Mountain were received thirddose of Polio, respectively at the time of the survey.The last Measles/Polio vaccination campaign in Lahj governorate was conducted around 5months ago (March 2012) with a reported coverage of 97% measles and 99% Polio. Thereforethe current survey findings for Measles and Polio presented were slightly low. However, whileacknowledging factors such as missing children (vaccinated but not available during the survey)and mother recall bias (very few vaccination cards retained), the coverage estimate of 84 to 89percent during the survey can be considered agreeable. Considering the challenges faced byany outreach campaign in this vast governorate, this information may give some indication ofthe success of the immunization programme in reaching out to all population subgroups in Lahjgovernorate.Vitamin A supplementation coverage is lower than the measles coverage. Approximately 73.1%of population in the Low land ecological zone and 69.1% in the Mountain had received vitaminA capsule in the past 6 months prior to the survey. In general the Lowland populations had amarginally better coverage compared to the Mountain community. However, these coveragefigures of the current survey are surprisingly lower than the 87% coverage reported in the lastVitamin A supplementation campaign in Lahj governorate which was conducted in March 2012.However, when comparing data from various sources, consideration should be given todifferences in the sampling frame, design, sample size, representativeness of the sample, andselection methodology, as well as differences in the source of information, phrasing ofquestions, and reporting of data that could explain these differences.The vitamin A supplementation coverage in both Lowland and Mountain areas is considerablylower than the Sphere Standards recommendation of 95% coverage. Therefore, effort needs tobe made to improve the Vitamin A supplementation and strengthen the existing static healthservices. It is also suggested that mobile health teams, should be deployed to assist theoutreach efforts and improve Vitamin A supplementation coverage.44
Table 20: Percent distribution of children by vaccination and supplementation, Lahjgovernorate, July 2012Lowland MountainousEcological ZoneN % N %ImmunizationChildren (9-59 months) immunised against measles 1 661 89 612 86.3Children who have ever received polio vaccine 686 86.1 637 83.5SupplementationChildren who received vitamin A supplementation in last 6 582 73.1 526 69.1months1 Based on health cards and mothers' reports4.9.2. Nutrition Programme coverage informationThe number of children enrolled in the nearby therapeutic feeding program was only 3.78% and1.83% in Lowland and Mountainous zones, respectively. All the children suffering severe acutemalnutrition were subsequently referred to the nearby health centre with OTP. Currently, thereare no supplementary feeding programmes in Lahj governorate. The estimated coverage wasestimated as 0 % of children currently enrolled in SFP observed malnourished in need of SFP.This is seen as a gap in response needs.UNICEF has been supporting the MOPH to deliver static and mobile OTP programmes in Lahjgovernorate since December 2008. So far there is one TFC in Alhouta general hospital and 24OTP centres throughout the 15 districts. The therapeutic feeding programme in Lahjgovernorate was established at the end of 2008 with 16 OTP centres in 15 districts and scaledupto 23 OTP and 1 TFC in October 2011. Two UNICEF mobile nutrition teams (each consistingof Doctor and Nurse) were deployed in Lahj governorate in September 2010 and February 2011.They have the responsibility to treat and manage SAM cases through mobile OTP services aswell as delivering PHC. The third mobile team is expected to be deployed at the end of July2012. The UNICEF mobile teams mainly targeting the IDP located within the local communitiesof Althouta, Tuban, Almilah, Almiseymer and Tourulbaha districts.Save the Children provides PHC and Nutrition services to support outreach activities, using twoMobile Health Teams in Alhouta, Tuban, Almakatra, Kembeta. WHO provides PHC services inAlhouta and Tuban districts using two mobile teams. Lahj Health office, under CLP(Comprehensive Livelihood Programme), covers a wide range of interventions in parts of thegovernorate, from Reproductive Health and PHC services, to training of CHWs and TBAs usingtwo mobile teams. EU, under Reproductive Health Population Programme, delivers RH services45
(training, awareness creation) through outreach programme covering the whole 15 districts ofLahj governorate.However, it is suggested that coverage and linkage between these interventions is weak. Effortsneed to be made to link the nutrition intervention by sharing information. There is still a needto ensure that Mobile Health Teams providing PHC services are supported to identify, treat andmanage severe acute malnutrition. In addition, community mobilization efforts need to bestrengthened to improve early case finding and referral for OTP in the months ahead. Currently,no additional health or nutrition program is being implemented to support the health officestatic services in the governorate.ICRC provided full assistance to the IDP (shelter, water, sanitation, health, nutrition services)since the beginning of the displacement until March 2012. Since the phase out of the ICRCprogramme, no new programmes have been started in Lahj to support IDPs.Relief International, under Food For Peace programme, is supporting 8,000 vulnerablehouseholds in 4 districts (Alhota, Tuban, Tourulbaha and Almoqatra districts of Lahigovernorate) providing direct support (Food basket per family per month is consist of 50kgwheat flour, 10kg rice and 5 litre cooking oil) to improve access to staple food commodities andawareness creation on Nutrition, Food Pyramid, Hand Washing, Breast Feeding/ MotherFeeding/ Child Feeding/ Teenager Feeding and Healthy Cooking Habits and so far 4000 familiesattended educational sessions by trained Community Mobilizer.In July 2012 the first round of relief food distribution was took place in four districts reaching8000 households. It will be interesting to monitor the impact of these interventions in thetargeted districts and potentially scale up throughout the governorate as required.4.9.3. Presence of iodized salt in householdHousehold salt iodization is low (Table 21). Among all households, less than a quarter (24.5%)had salt with the recommended level of iodization.46
Table 21: Percent distribution of households with salt tested for level of iodization byecological zones, Lahj governorate, July 2012Iodine content of salt testedEcological ZoneNot iodised Inadequate(15 ppm)The test wasnot madeLowland 41.1 39.5 18.8 0.6Mountainous 37.2 30.1 31.2 1.4Total 39.3 35.1 24.6 1.05. DISCUSSION5.1. AnthropometryAnthropometric indicators used to measure child malnutrition include wasting, stunting, andunderweight. These indicators compare the growth of the child being measured with thegrowth of a well-nourished and healthy, ‘reference population’ of children of the same age(WHO/NCHS). The WHO 2006 Growth Reference was used in the analysis and interpretation ofthe results. Nutritional status can be negatively impacted by illness/infection and dietary intake.Within the household, conditions such as food security, clean water, safe sanitation facilities,hygiene practices, maternal care practices and access to health services can have an impactoverall on the nutrition situation.Wasting, or thinness, is an indicator of acute (short-term) malnutrition. It is calculated bycomparing the weight for height of a child with a reference population; a child is consideredwasted if her/his weight-for-height z-score is below -2SD of the reference population. Wastingis usually the result of recent food insecurity or infection/illness, such as diarrhea. It is oftenused to assess the severity of an emergency situation, with severe wasting being highlycorrelated with mortality.The level of global acute malnutrition (GAM) found in Lowland Zone is 23.0%, which classifies as‘critical’ as per the WHO categorization of the severity of the situation, while in theMountainous Zone, the GAM rate is 14.3%, which is classified as ‘serious’ according to theWHO categorization 20 . The GAM level among the Lowland households was significantly higherthan the Mountainous households (p0.05). Pockets of high nutritionalvulnerability were noted in both zones but higher significant in Mountainous Zone (P=0.002).20 According to WHO (2000), GAM rates of less than 5% are acceptable, GAM rates between 5 - 9.9% indicate thesituation is poor, GAM rates between 10-14.9% are serious, while GAM rates of 15% and above are critical47
The prevalence of acute malnutrition in Lowland ecological zone found in this survey is higherthan the national level (15.7% GAM and 4.4% for SAM according to IFPRI estimations based on2005-06 HBS data). Similarly, the levels of GAM and SAM in Lowland found in this survey arealso higher than the rates found by the WFP-CFSS 2011 survey findings that are 15.1% and 4.0%for GAM and SAM respectively. The levels of acute malnutrition in the Mountainous Zone arelower than the national ones of 2005/06 and the 2011 WFP-CFSS survey, but it’s worth notingthat the level of acute malnutrition in the Mountainous zone is identical to the national one of2003 (The national level of GAM of 2003 Family Health Survey is 14.3%). In regards tocomparison of the levels of malnutrition, it’s worth mentioning that due to methodologicaldifference, any direct comparison between the national levels and the SMART has to beinterpreted with caution. From the finding of this assessment, we can conclude that noprogress has been made in the last 10 years in reducing the prevalence of wasting in Lahjgovernorate, may be it has worsened as the findings of this assessment indicate a prevalencerate of 23.0% in Lowland communities. This has several implications especially with regards toaddressing nutritional problems and there is an urgent need for treatment and prevention ofacute malnutrition to improve the overall situation of children.The finding of this assessment revealed that the level of wasting among male children issignificantly higher than female children (p=0.000). This clearly indicates that male children inLahj governorate are more nutritionally disadvantages when compared with female children.This leads to an argument that child’s sex preference that favors female children is practiced bycare takers’ in Lahj governorate. The difference may be attributed to unmeasured factors suchas parental care-giving behaviors. In light of the fact that males are more likely to be wastedthan females in Lahj governorate, sex-related differences in diet and child care requires furtherresearch.According to WHO classification 21 , the prevalence of chronic malnutrition (i.e., stunting) inLowland community would be considered to be serious and in the Mountain community itwould be considered serious. The prevalence of Global stunting and Severe stunting found inthe Lowland (35.1% and 9.0%, respectively) is lower than the value reported for Lahggovernorate (42.4% and 16.5%) in WFP-CFSS 2011 survey; while the Global stunting rate foundfor the Mountainous zones (46.9%) is higher than that of the WFP-CFSS and severe stunting waslower. Although the level of stunting in the Mountainous zones was higher than the Lowlandzone, the difference was not statistically significant (p>0.05). Because stunting is a conditionthat develops over a long period, these high prevalences of stunting indicate that these21 According to WHO (2000), stunting rates of less than 20% are acceptable, stunting rates between 20.0-29.9%indicate the situation is poor, stunting rates between 30.0-39.9 are serious, stunting rates of 40% and aboveindicates critical situation48
populations have had long-term nutritional problems. WHO (1998) has proposed that the goalfor reducing stunting be: ‘the prevalence of stunted children in any country (and with in specificsubgroups) should be less than 20% by the year 2020....’. Yet, the problem of chronicmalnutrition in Lahj governorate is worrisome. The stunting rates especially in MountainousZone clearly indicate the need for an integrated response to reduce the prevalence.The prevalence of underweight in both zones is very high; well the WHO ‘critical’ levelsthresholds of 30%. The underweight prevalence in Lahj governorate found in this survey ishigher than the 34.9% which was found in the findings of the WFP-CFSS 2011 survey. Nosignificant different is noted in underweight between the two zones. Weight-for-age is primarilya composite of height-for-age and weight-for-height, and these very high prevalence estimateslikely indicate that these populations have had long-term nutrition problems.5.2. MortalityBoth crude and under five mortality rates were well below emergency thresholds of1.14/10,000/day and 2.33/10,000/day respectively. The low mortality rate may be a reflectionof the high health seeking behaviors; it is also probable that these households suffered morechild deaths but not reported. While the child mortality rate was low, it is difficult to commenton the cause of child mortality given that from the three under-five deaths, cause of death wasreported as unknown for the two cases.5.3. Morbidity and Health Care PracticesThe prevalence of morbidity in the survey samples was high. Major diseases were cough, feverand diarrhoea related. The data show that 42.8% and 37.3% children in the Lowland andMountainous zones, respectively were reported to have suffered from high fever during thetwo weeks prior to the survey, while those who suffered from cough is 48.5% in Lowland and33.9% in Mountainous zone. The survey data also indicate that there were 27.9% and 28.8% ofchildren in lowland and Mountain, respectively reported to have had diarrhea episode in thetwo weeks preceding the interview.The finding of this survey is close with the 2003 Family Health Survey 22 except cough. In theMountainous zone, cough morbidity prevalence found in this assessment (33.9%) is lower thanthe national prevalence of 42% while the prevalence in the Lowland is found in the survey(48.5%) is slightly higher than the national prevalence of 42%.22 According to the 2003 Family Health Survey: the prevalence of fever, cough and diarrhea was 40%, 42% and29.6%, respectively49
Analysis was made to test whether morbidity factors affect malnutrition. The analysis revealsthat the proportion of wasted children in Lowland zones was slightly higher for childrensuffered from diarrhea within the two weeks before the survey, but the association was notstatistically significant (X 2 :3.441, p=0.064 Lowland). No significant association was observedbetween diarrhea and wasting in Mountainous zones (X 2 :0.005, p=0.945). The only significanteffect found for diarrhoea two weeks prior to the survey was on underweight in Lowland zone(X 2 : 4.23, P=0.04). Significant association was found between the incidence of cough within thetwo weeks preceding the survey and all the three nutritional indices in Mountainous zone(WAZ-X 2 :11.232, p=0.001; HAZ-X 2 :5.627, p=0.018; WHZ-X 2 :4.150, p=0.042). This clearly suggeststhat programmes aiming to address malnutrition in the Mountainous zone should consider theprovision of appropriate and adequate health service to address the incidence of cough. On thecontrary, no significant association was found between cough and all the three nutritionalindices in the Lowland zone. The analysis also showed that the incidence of fever within thetwo weeks prior to the survey significantly associated with underweight in both zones(Lowland-X 2 :4.756, p=0.029; Mountain-X 2 :6.062, p=0.014). The prevalence of stunting wassignificantly high among those who had fever in the two weeks before the survey in theMountainous zone (X 2 : 3.874, p=0.049). Although high stunting observed in children with feverin the Lowland, the association was not statistically significant (X 2 :1.018, p=0.313). No effectwas observed for fever two weeks prior to the survey on the prevalence of GAM in both zones.Health seeking practices as reported by mothers with sick children was encouraging, with a highproportion of mothers’ sought treatment from public health facilities. This may be because themajority of the care gives have attended some level of schooling hence the supposition can bemade that these populations had greater awareness on the importance of appropriate healthcare during illness. However, the limitation of some centres is their accessibility: astransportation costs are high, visiting a health care provider is time consuming and expensive aswell; so some mothers practice treatment at home and resorting to other alternatives forcurative services.5.4. Feeding PracticesOnly 70% and 67.7% of children aged 6 to 24 months were still being breastfed in Lowland Zoneand Mountainous Zone, respectively. The breast-feeding rate for children 6 to 11 months of agewas 83.5% and 88.1% and this rate drops to 62.9% and 56.3% for children 12 to 24 months inLowland and Mountain, respectively. Continuation of the breastfeeding gradually declined withage and continued breastfeeding up to 24 months of age is a casue of concern in Lahjgovernorate. Accortding to the 2003 Family anf Health survey finding, most of the children in50
<strong>Yemen</strong> (97%) are normally breast-fed for some time. In addition to that, adhering to therecommendation of continued breastfed until 24 months of age is important to help protectbabies from dangerous illnesses.A mother who has the appropriate knowledge about nutrition is better able to provideappropriate care to the child. If her knowledge is inadequate or wrong, it can lead toinappropriate child caring practices. The finding of this assessment led to the realization thatlow maternal knowledge on the importance of continued breastfeeding is one of the areas ofconcern that needs appropriate intervention as these factors have direct and indirect effect onthe health and nutrition status of children and mothers. Therefore, it is important that mothersin Lahj governorate receive information on appropriate caring practices for the child, such ascomplementary and breastfeeding practices. In addition, the key areas that require dueattention include the concept of continuation of breastfeeding during and after illness.However, in reference with the scale and severity of the nutritional problem in the surveyedarea, the health and nutrition education activity alone is inadequate to address the issue ofmalnutrition in the area.5.5. Water, Sanitation and HygieneThe quality of the household drinking water source and the type of toilet facility the householduses is commonly used as a socio-economic status proxy. In addition, they are both useful fortheir relationship to health outcomes (diarrheal illness, etc). The time taken to collect drinkingwater is important in assessing the general welfare of the household. What a household does totreat drinking water, the method of waste disposal and hygiene practices are indicators of ahousehold’s knowledge and practices about appropriate and safe health behaviors.Water and sanitation levels are high among both the Lowland and Mountainous communitiessampled. Utilization of safe drinking water, as well as access to sufficient quantities of water, ishigh especially among the Lowland community.Sanitation practices are also high with approximately 92-97% of respondents using soap whenwashing hands with a correspondingly high practice of washing hands before and after eating.There was no correlation between poor hand washing practices and poor malnutrition ratesfound in Lowland. Similarly, there was no significant association between poor hand washingpractices and poor malnutrition found in Mountainous zone except stunting and hand washingbefore meal.51
In the mountain, significantly low proportion of stunting were found among children inhouseholds where caretakers reported practicing hand washing before meal (X 2 :10.298,p=0.001). This result may suggest that children in households where caretakers not practicinghand washing before meal suffered from longer and repeated episodes of childhood illnessesincluding diarrhea which is detrimental to their long-term nutritional status. It is, therefore,important to share and act on information about the importance of hand washing using soapbefore meal.The proportion of households defecating in the open field was also high, especially in Lowlandzone suggesting the need for active campaign for behavioral change communication. Hygienepromotion is a key intervention contributing to health and eventually better nutrition wellbeingof the population5.6. Education of caregiversEducation is one of the most important resources that enable women to provide appropriatecare for their children, which is an important determinant of children’s growth anddevelopment. Many studies show a decreased incidence of malnutrition among young childrenwith an increase in the level of mothers' education. However, there was not significantassociation found between education level of care givers’ and all the nutrition indices in Lahjsurvey.5.7. Cross Cutting Issues (Gender)Highly significant (p=0.000) gender disparity has been observed in the prevalence of acutemalnutrition between boys and girls. The prevalence of acute malnutrition in Lowland zone wassignificantly higher among boys than girls. Therefore, sex-related parental care giving behaviorneeds further exploration.6. CONCLUSIONOf the two ecological surveyed, Lowland presented a critical nutrition situation with GAM at23.0% and SAM estimated at 4.5%. The Mountainous zone presented a serious nutritionsituation with GAM and SAM estimates of 14.3% and 2.8%, respectively and in the presence ofaggravating factors such as acute food insecurity, suboptimal vitamin A supplementationcoverage, and childhood morbidity considered as high.52
Many communities in both Mountain and Lowland ecological zones are extremely isolated andaccess to basic services for health, water and markets is extremely low. The malnutritionreported was found to be highly aggravated, suggesting that parts of the governorate are invery poor shape and need specific support immediately to firstly understand more fully thecauses for this high malnutrition in children and secondly to suggest ways to address thesituation, providing equitable health and nutrition support immediately in the worst affectedareas. Teams’ observation of the locality and household condition reported seeing several thinchildren and thin mothers in some parts of the villages. Considering the high prevalence ofmoderate cases, it is suggested that unless immediate intervention started to dramaticallyimprove and salvage the situation, there would be a further deterioration and a rise in the levelof severe malnutrition in the months ahead. This will subsequently cause further deteriorationin the nutrition and health situation among the most vulnerable children, especially in theworst affected areas of the governorate.7. RECOMMENDATIONSImmediate recommendations• Convene a multi-sectoral meeting at governorate level to develop a joint action planidentifying responsible partners, and setting a time frame to act on therecommendations made for improving the nutrition situation.• Expand and scale-up the current CMAM services to more health facilities to increasecoverage and to reach more malnourished children. Currently, only 25 OTP centres arefunctional within 25 health facilities among the 219 functional public health facilities inLahj governorate which reveals the coverage is still very low. The CMAM service in theexisting health facilities must also be strengthened through capacity building of the newhealth staffs on CMAM procedures, RUTF supply and stock management, datamanagement and reporting, and refresh training to the already trained personnel• Allocate budget for joint monitoring and supportive supervision field visit of the OTPand TFC sites at a three month interval with the aim of assessing the quality of patientcare, outcomes of patients enrolled into the program and program ownership by thegovernorate and district government. The supportive supervision should also be seen asan opportunity to identify challenges, gaps and constraints of the programmeimplementation.• Consider deploying additional mobile health teams to strengthen and compliment theprimary health care services delivered at static health facilities. It is essential that allmobile health teams are trained and equipped to treat and manage severe acutemalnutrition. Ensure that critically and seriously affected villages are added to the53
current list of areas where mobile health teams are working. It is also suggested thatNGO-supported health/nutrition teams should be encouraged given the high immediateneed that currently exists in several districts in the governorate.• Review the strategy for community outreach component of the CMAM programming inthe governorate and strengthened the community mobilization efforts to improve earlycase finding and referral for OTP in the months ahead.• Based on the anthropometric findings overall, there is a need for emergency reliefdistribution targeting vulnerable households with acute food shortage.• The prevalence of malnutrition with the context of multiple aggravating factorswarrants supplementary feeding. Provide supplementary food under a SFP targeting themost vulnerable in the community, pregnant and lactating women (PLW) and childrenunder-five providing 2 months blanket supplementary feeding distribution (in Lowland)to prevent further malnutrition among the community, followed by 4 months targetedsupplementary feeding for moderately malnourished PLW and under-five to cap a rise inmoderate malnutrition and prevent an increase in severe acute malnutrition in childrenin the months ahead. It is suggested that the modalities of the TSFP will be mobile andlinked to the mobile health teams PHC/TFP services.• Establish a mobile targeted supplementary feeding programme to cap a rise inmoderate malnutrition and prevent an increase in severe acute malnutrition. Immediateinvestigation is needed and an appropriate immediate response for the 11 villages listedwhere malnutrition rates were found to be very high (Alebi, Alkhodad, Beeromer,ToorAlborook, and Mehwali villages in Lowland ecological zone; Al-arsh, Al-hada, Al-Shaiba, Al-Makhaira, Wadi Albeer and Al-Sha'bain villages in Mountainous zone.• As a preparedness measure, enhance capacity to manage severe acute malnutritionwith medical complications by establishing TFCs in locations with high need.• Improve the infant feeding practices with focus on preventing early cessation ofbreastfeeding, continuation of breastfeeding, re-lactation (for those ceased) and propercomplementary feeding.• In areas that are considered malaria endemic, strengthen the support for ITNdistribution and awareness raising campaigns to promote effective utilization of bednets.• In villages where suspected measles cases were reported (Annex X), particularlyBarakan, Shalem, Othara in Mountainous zone and Alrakb in Lowland zone, furtherinvestigation is needed to determine the existence of measles outbreak and the scale ofthe population at risk before a supplementary immunisation activity can be planned for.54
Medium term• As part of the effort to tackle the staggering level of acute and chronic malnutrition,there is a need for an integrated strategy to short term, medium term and longer termprogrammes addressing both the acute and chronic malnutrition. Therefore, anintegrated health and nutrition package (Immunization, Micronutrient supplementation,IYCF, CMAM) complimented with programmes aimed at improving household foodsecurity, water and sanitation need to be implemented in Lahj governorate in acoordinated way to bring down malnutrition, particularly in the remote villages withlittle access to facilities and high levels of malnutrition,• Closely monitor the food security situation and develop a contingency plan to provideprompt emergency relief as appropriate.• Establish a nutrition surveillance system to monitor the situation to act as an earlywarning system and as a referral mechanism for malnourished children.• Promote salt iodization programmes.• Improve vaccination coverage by enhancing the governorate’s mobile health serviceinitiative and implement SPHERE standards with special focus to vitamin Asupplementation as well.• Improve management of ARI and Diarrhea in the communities with focus on preventivemeasures and possible curative responses.• WASH campaign to promote safe hygiene and caring practices• Improve already ‘satisfactory’ sanitation facilities and practices through healtheducation and disciplined camp management.• Implement programmes that will promote self-sufficiency and household food security.Food-for-training activities, food-for-work programmes, and agricultural rehabilitationare recommended as means of increasing employment opportunities and providing amechanism by which households can increase their immediate access to food.• A follow-up survey should be done after 6 months to assess the change in status of thepopulations and effect of health and nutrition interventions on malnutrition prevalence,morbidity and mortality• Develop the capacity of a multi disciplinary team in Lahj governorate to execute futuresurveys, analyse and interpret nutrition, food security and health information and toplan appropriate timely emergency response for the districts in the governorate.Longer term• Scale up WASH projects to improve access to safe water and sanitary latrines• Develop strategies and test innovative initiatives to diversify income generation55
opportunities• Support infrastructure development (roads, communication systems), especially inMountainous zone• Develop an integrated (Nutrition, Health, Food security) early warning system for eachecological zone in the governorate• Health indicators - define thresholds for normal, alert, high risk, emergency• Defined key FS indicators for each ecological zone and set thresholds biannually• Further research is needed to understand why the level of acute malnutrition amongboys is significantly higher than girls56
ANNEXESAnnex I: Clusters Selected for Lahj Lowland Ecological ZoneDistrict Village Cluster NumberAlHwata Aldubba 1AlHwata Alebi 2AlHwata Masawa 3Tuban Saber 4Tuban Amjerba 5Tuban Alwaht 6Tuban Alkhodad 7Tuban Alnoba 8Tuban Oberlasloom 9Tuban Beer Haidra 10Tuban Harran dyan 11Tuban Beeromer 12Tuban Alquraishi 13Tuban Hashed 14Toor Albaha Habeel Alsabt 15Toor Albaha Toor Ma'akem 16Toor Albaha Almokait 17Toor Albaha Alhwaida 18Toor Albaha AlMojailba 19AlMadhareba Ras Alara Alboroda 20AlMadhareba Ras Alara Howaireb 21AlMadhareba Ras Alara Ma'amer 22AlMadhareba Ras Alara Alraia 23AlMadhareba Ras Alara Almonaikem 24AlMadhareba Ras Alara Amatef 25AlMusaimeer Almusaimeer 26AlMusaimeer Alfosail 27AlMusaimeer Aldoraija 28AlMelah Alrakb 29AlMelah Althemra 30Radfan Alhabelin 31Radfan Alhamra 32Radfan Aljabha 33Radfan Albareda 34Habeel Jabr Alkharoof 35Habeel Jabr Rahwat Amria 36Toor Albaha Toor Alborook 37Alkabaita Alsehr 38Alkabaita Alsofaila 39Alkabaita Mehwali 4057
Annex II: Clusters Selected for Lahj Mountain Ecological ZoneDistrict Village Cluster No.Al-Had Al-Farda 1Al-Had Al-koma'ala 2Al-Had Al-Majadeer 3Al-Had Shamsan 4Al-Had Barakan 5Yafea Al-Kern 6Yafea Al Ahmed 7Yafea Dhaisra 8Yafea Al-Kadem 9Yafea October 10Yafea Al-Dhahra 11Yafea Mankal 12Al-Meflehi othara 13Al-Meflehi Al-Malkaf 14Al-Meflehi Al-Maseel 15Yafea Marfad 16Yahr Dhalem 17Yahr Al-arsh 18Yahr aden Shopa 19Halmeen Habeel Al-raida 20Halmeen Asfal Shattan 21Halmeen Akabat ahmed 22Al-Makatera Al-Hiar 23Al-Makatera Al-Amook 24Al-Makatera Al-Kama Aloia 25Al-Makatera Al-hada 26Al-Makatera Al-seer 27Habeel Jabr Al-Shaiba 28Radfan Al-Abadia 29Al-Melah Lassat 30Al-Kabaita Al-Makhaira 31Al-Kabaita Al-A'ajool 32Al-Kabaita Al-Kdakeda 33Al-Kabaita Wadi Albeer 34Al-Kabaita Aykoa Al-Fahais 35Al-Kabaita Al-Sha'bain 3658
Annex III: Random Number Table172 337 568 471 34 147 190 565 414 490 669 626280 756 648 550 178 768 573 142 504 323 315 659735 295 769 451 699 4 465 797 95 80 176 381144 683 180 722 50 677 3 387 339 801 104 554311 515 313 758 195 680 121 710 757 761 520 197562 338 46 524 429 367 549 370 31 244 285 601148 647 720 276 206 68 29 200 642 379 242 150436 327 501 586 587 595 443 298 372 742 149 89334 245 417 281 704 211 427 495 257 390 686 221744 278 508 217 795 755 182 413 333 208 561 506498 538 738 728 399 479 536 205 301 266 283 174207 103 152 256 641 19 774 269 602 26 596 709535 86 650 480 743 663 156 14 540 141 575 165133 533 450 682 473 268 212 181 47 135 448 610558 691 28 362 55 407 353 331 378 79 17 658734 633 254 628 324 424 214 127 557 386 226 467351 118 637 5 679 196 151 397 405 675 544 355420 406 640 40 784 542 329 203 199 61 638 408570 164 693 163 98 360 308 239 499 23 251 672291 497 462 286 670 56 455 794 157 388 700 525712 439 20 66 651 358 723 263 724 357 249 449433 289 531 472 717 421 309 13 618 63 681 290580 778 137 72 401 377 664 609 319 803 741 47659 432 532 160 571 676 412 701 796 560 516 136107 630 347 27 18 604 24 617 243 307 404 620487 671 130 502 261 325 112 541 335 170 25 125517 466 665 188 84 629 201 345 799 235 37 74445 657 128 468 267 303 435 461 447 452 314 503227 494 101 229 430 232 694 344 608 695 491 167246 241 522 739 96 732 383 764 483 363 611 6032 306 727 264 453 798 485 559 537 566 11 69849 614 57 599 218 299 316 15 198 760 32 528105 297 442 543 191 591 62 168 762 8 253 716660 398 346 684 392 713 44 771 527 785 790 6077 223 507 371 102 403 438 10 434 731 336 341481 592 510 486 92 78 318 441 530 791 534 209446 343 234 162 193 789 376 73 482 340 292 143589 440 454 714 514 489 703 600 612 624 754 330240 215 668 270 48 210 293 352 800 518 553 740745 250 705 16 274 300 123 192 279 171 183 639736 463 115 428 65 87 692 546 184 213 645 1691 320 770 262 305 458 622 131 375 631 132 53271 459 342 122 780 615 574 582 288 719 753 477721 783 393 99 636 726 781 284 259 750 786 35054 394 475 69 154 779 385 576 422 60 488 590748 737 389 470 690 569 30 787 258 38 77 6788 93 219 763 707 792 41 139 416 456 90 41859
Annex IV: Local calendar of events, Lahj Nutrition Survey, July 2012حتى تاريخTo تاريخFromمنمواليدBirth مواليدBirth مواليدBirth مواليدBirth مواليدBirth مواليدBirth2012 2011 2010 2009 2008 2007شهرMonth يومDay شهرMonth يومDayالعمر بالأشهر Ageby Monthsالعمربالأشهر Age byMonthsالعمربالأشهر Age byMonthsالعمر بالأشهر Age byMonthsالعمر بالأشهر Ageby Months1 1 31 1 6 18 30 42 541 2 28 2 5 17 29 41 531 3 31 3 4 16 28 40 521 4 30 4 3 15 27 39 511 5 31 5 2 14 26 38 501 6 30 6 1 13 25 37 4912 24 36 48 اقل من شهر 1 7 31 7العمر بالأشهر Age byMonths1 8 31 8 11 23 35 47 591 9 30 9 10 22 34 46 581 10 31 10 9 21 33 45 571 11 30 11 8 20 32 44 561 12 31 12 7 19 31 43 5560
Annex V: Reference Table for Age Estimation, Lahj Nutrition Survey, July 2012Year 2007The date fromThe date toDay Month year Day Month year Age by months30 Aug 2007 30 July 2007 5930 Sep 2007 30 Aug 2007 5828 Oct 2007 30 Sep 2007 5730 Nov 2007 28 Oct 2007 5630 Dec 2007 30 Nov 2007 55Year 2008The date fromThe date toDay Month year Day Month year Age by months30 Jan 2008 30 Dec 2007 5428 Feb 2008 30 Jan 2008 5330 Mar 2008 28 Feb 2008 5230 Apr 2008 30 Mar 2008 5130 May 2008 30 Apr 2008 5030 Jun 2008 30 May 2008 4930 Jul 2008 30 Jun 2008 4830 Aug 2008 30 Jul 2008 4730 Sep 2008 30 Aug 2008 4630 Oct 2008 30 Sep 2008 4530 Nov 2008 30 Oct 2008 4430 Dec 2008 30 Nov 2008 43Year 2009The date fromThe date toDay Month year Day Month year Age by months30 Jan 2009 Dec 2008 4230 Feb 2009 Jan 2009 4130 Mar 2009 Feb 2009 4030 Apr 2009 Mar 2009 3930 May 2009 Apr 2009 3830 Jun 2009 May 2009 3730 Jul 2009 Jun 2009 3630 Aug 2009 Jul 2009 3530 Sep 2009 Aug 2009 3430 Oct 2009 Sep 2009 3330 Nov 2009 Oct 2009 3230 Dec 2009 Nov 2009 3161
Year 2010The date fromThe date toDay Month year Day Month year Age by months30 Jan 2010 30 Dec 2009 3028 Feb 2010 30 Jan 2010 2930 Mar 2010 28 Feb 2010 2830 Apr 2010 30 Mar 2010 2730 May 2010 30 Apr 2010 2630 Jun 2010 30 May 2010 2530 Jul 2010 30 Jun 2010 2430 Aug 2010 30 Jul 2010 2330 Sep 2010 30 Aug 2010 2230 Oct 2010 30 Sep 2010 2130 Nov 2010 30 Oct 2010 2030 Dec 2010 30 Nov 2010 19Year 2011The date fromThe date toDay Month year Day Month year Age by months30 Jan 2011 30 Dec 2010 1828 Feb 2011 30 Jan 2011 1730 Mar 2011 28 Feb 2011 1630 Apr 2011 30 Mar 2011 1530 May 2011 30 Apr 2011 1430 Jun 2011 30 May 2011 1330 Jul 2011 30 Jun 2011 1230 Aug 2011 30 Jul 2011 1130 Sep 2011 30 Aug 2011 1030 Oct 2011 30 Sep 2011 930 Nov 2011 30 Oct 2011 830 Dec 2011 30 Nov 2011 7Year 2012The date fromThe date toDay Month year Day Month year Age by months30 Jan 2011 30 Dec 2011 628 Feb 2011 30 Jan 2012 530 Mar 2011 30 Feb 2012 430 Apr 2011 30 Mar 2012 330 May 2012 30 Apr 2012 230 Jun 2012 30 May 2012 162
Annex VI: RETROSPECTIVE MORTALITY FORMSurvey Date: ____/____/2012 District surveyed: __________ Sub-district: __________________Village/neighborhood: ___________ Cluster number: ____________ Team number: ____________Survey zone (stratum): _______________ Household questionnaire number: _______________No.Name(optional)Sex(M, F)Age inyears ordate ofbirthJoinedwithin the90 dayperiodLeftwithin the90 dayperiodBornwithin the90 dayperiodDiedwithin the90 dayperiodCauseofdeathPlaceofdeath123456789101112131415161718192021222324Important: All individuals present in the household should be recorded, whether joining or leaving the household,and whether born or died within the 90 day period from commencement of the survey.Symbols for causes of death1 = diarrheal disease 5 = malnutrition2 = fever 6 = violence / impacts of conflicts3 = measles 7 = other (specify)4 = respiration disordersSymbols for places of death1 = at the current location2 = during emigration3 = at a different residence4 = other (specify)63
Annex VII: Household QuestionnaireRepublic of <strong>Yemen</strong>Ministry of Public Health and PopulationOffice of Public Health and Population, Lahj GovernorateNutritional Status and Mortality Survey – Lahj Governorate – July 2012Household Questionnaire (Form 1)First: Explain to the residents of the household (adults) about the survey and inform them of the agencyconducting the survey and survey staff (team members). Then request their verbal agreement to participate in thesurvey.1. Yes.Consent2. No. Go to the end.Date of interviewday month yearØ 2 Ø 1 2District Ozla (Sub-district) Village or neighborhoodname Name nameName of head of householdSurvey teamnumberHousehold andanthropometric dataNameSignature……….………Mortality dataTeam leaderIndicate which situation applies:1. Absence of household upon first visit which necessitated a second visit2. Absence of child upon first visit which necessitated a second visit ** If the child is not present, all data should be filled in except anthropometric measurements and edemawhich should be completed only if the child is present.Note: The data inside the cover is for field and administrative use by the team members.64
To be filled by the Team Leader (for data input purposes)Repeated absence of the household even after the second visit (1=yes, 2=no)Consent (1=yes, 2=no)Team NumberHouseholdQuestionnaire NumberDate of Interview day Month yearØ 2 Ø 1 2Is the region urban (1) or rural (2)?Village or neighborhoodSub-district codecode numbernumberDistrict codeGovernorate codenumberSurvey zone (stratum)Cluster numbernumberStratum number is (1) for Mountainous Zone and (2) for Lowland Zone2 5………………………………………………………………………………………………………………………………………………….………Desk workName day month Year SignatureData entryReviewOther encodingRemarks:………………………………………………………………………………………………………………………………………………………………………………………………………………………………………………………………………………………………………………………………………………………………………………………………………………………………………………………………………………………………………………………………65
Q001: Household data (only those who are alive and living together continuously)H001aNumber of household members (only those who are alive andliving with the household on the date of the survey)QuantityH001bNumber of children under five (only those who are alive and livingwith the household on the date of the survey)QuantityH001cNumber of children under six months (only those who are aliveand living with the household on the date of the survey)QuantityQ002 – Q003: Head of household dataH002Gender of the head of household1. Male2. FemaleSocial status of the head of household1. Married and living with partnerH0032. Married and not living with partner for at least six months ormore.3. Widow/widower4. Divorced5. Angered and separated6. SingleQ004: Household caretaker dataH004Education level of household caretaker1. Illiterate.2. Can read and write (literate).3. Basic education.4. Secondary education.5. Tertiary education (university, college, or institute).66
Q005: Household income sourceWhat is the primary source of income for the household?1. Non-qat agricultural products2. Livestock and livestock products3. fishery4. Trading5. Temporary work (Casual work)H0056. Monthly salary7. Remittance (from emigrants)8. Craftsmanship9. Farming/sale/transport of qat1Ø. Donation (from friends and relatives)11. Social insurance12. Other: specify -Q006 – Q012: Water, environmental sanitation, and hygiene dataWhat is the main source of drinking water in your home? (choose one only)1. Piped water connected to home.2. Piped water connected to yard.3. Open, unprotected well.4. Open, protected well.H0065. Covered rainwater collection tank.6. Open rainwater collection tank.7. Water delivery truck.8. Bottled water (Hadda, Shamlan, Kawthar, etc.)9. Unprotected surface water (valley, running spring, etc.)1Ø. Protected spring water.11. Other: specify -Do you treat the water before drinking?Go toH007a1. Yes2. No H0083. Don’t know. H00867
H007bWhat is themain method used to treat drinking water?Choose only one.1. Boil water before drinking.2. Use chlorine or Clorox.3. Filter through clean cloth.4. Use ceramic or sand filter or similar filter method.5. Let water settle before drinking.6. Use of alum crystal to disinfect.7. Other.H008Note: Investigate availability of storage for drinking water. Is the water containerclean (no algae seen)?1. Yes.2. No.H009What is used for defecation? Choose one of the following.Verify existence offacilities and practices.1. Toilet – equipped with flush mechanism to wash water down.2. Toilet – uncovered pit.3. Toilet – simple dry covered pit.4. Outdoors in the open air (in fields, for example).5. Other: specify -68
H010When do you clean your hands with soap, ashes, dust, tree leaves, or any othermaterial? Place a check mark for each answer said by the respondent. Do not givethe respondent any choices for the answer.a. After using the toilet. 1. Yes2. Nob. Before eating. 1. Yes2. Noc. After eating. 1. Yes2. Nod. Before cooking. 1. Yes2. Noe. Before feeding the child. 1. Yes2. Nof. After disposing of child’s waste. 1. Yes2. Nog. After cleaning the livestock or poultry areas. 1. Yes2. Noh. Any other answers: Specify -Note: With regard to hand-washing, confirm the use of the following:H011a. Water. 1. Yes2. Nob. Soap. 1. Yes2. Noc. Ashes, dust, limestone powder, tree leaves. 1. Yes2. NoWhere do you obtain health care if someone in the household gets sick?Go toH012a1. No medical help is sought.2. Personal medicines.3. Traditional healer.4. Shaykh.5. Pharmacy.6. Private clinic. C0137. Public health facility. C01369
H012bWhy don’t you seek health services at a health facility or clinic when someone getssick?1. High cost.2. Facility is distant and transportation is not available.3. Not enough time.4. We do not have confidence in the nearby services.5. Other: specify -Q013 – Q017: The food security situation part (to be answered for the situation in the past 30 days)H013Over the past 30 days, did you or any HH member use to reduce the size of mealsbecause of the scarcity of resources?1. Yes2. NoH014Over the past 30 days, did you or any HH member use to reduce the number ofmeals because of the scarcity of resources?1. Yes2. NoH015Over the past 30 days, did you or any HH member go the bed in night hungrybecause of not enough food?1. Yes2. NoH016Over the past 30 days, did the HH borrow food, borrow money to purchase food orpurchase food in credit or mortgage?1. Yes2. NoH017Over the past 30 days, did the HH reduce the expenditure on education or food tosave money to purchase food?1. Yes70
2. NoQ018: Situation of salt iodizationH018Use the rapid test reagent to check the iodization status of the salt HH was usedyesterday?1. Not iodized.2. Below 15 ppm.3. 15 ppm and above.4. The test was not made.71
Q019 – Q025: Nutritional and Immunization Status of Children ages 6-59 months within the householdChildno.Child’s firstnameC019 C020a C020b C021 C022aFor children 24Age of child in months. months or less.Date of birth.If the child is older than Is the child stillIf the date is recorded, skip24 months, go to breastfeeding?C020b)question C023.1 = yes2 = noChild’sgender1 = male2 = female1. day mo. YearFor children 24 months orless. How many timeshave you fed the child inthe past 24 hours?Do not include number oftimes breastfed.2. day mo. Year3. day mo. Year4. day mo. Year5. day mo. year6. day mo. year7. day mo. year72
Childno. (asabove)Child’s gender1 = male2 = femaleChild’s age(in months)C022b C023 C024 C025For children 24 months orless. How many times haveyou fed the child milk in thelast 24 hours?Do not include number oftimes breastfed.Has the child beengiven Vitamin A inthe past six months?(Show sample.)1 = yes2 = no3 = don’t knowHas the child beengiven vaccinationsfor Pentavalent 3and Polio 3?1 = yes2 = noFor children nine monthsand older. Has the childbeen immunized againstmeasles (shot in left arm)?1 = yes, shown on card2 = yes, from memory3 = don’t know4 = has not been immunized1.2.3.4.5.6.7.73
Q026 – Q035: Anthropometric measurements and childhood diseases of children aged 6 – 59 years in the householdChildno. (asabove)1.Child’sgender1 = male2 = femaleChild’s age(in months)Weight (kg)88.8 = refused99.9 = not presentC026 C027 C028 C029Bilateral edema (inboth legs).Height (cm)1 = yes888.8 = refused2 = no999.9 = not present8 = refused9 = not presentMiddle upper armcircumference (cm)88.8 = refused99.9 = not present2.• • •3.• • •4.• • •5.• • •6.• • •7.• • •• • •74
Childno. (asabove)1.Child’sgender1 = male2 = femaleChild’s age(in months)C030 C031 C032 C033 C034 C035Symptoms similar toCough orFever in measles in past month Did the childdifficultythe past (skin rash + fever + sleep underbreathing intwo cough or throat mosquito netthe past twoweeks infection orlast night?weeks1 = yes conjunctivitis)1 = yes1 = yes2 = no 1 = yes2 = no2 = no2 = noDiarrheawithin thepast twoweeks1 = yes2 = noIs the child currentlyregistered at anutrition center?1 = SFP2 = TFC/SC3 = OTP4 = other5 = not registered2.3.4.5.6.7.75
Annex VIII: Referral Form for the Malnourished Children76
Annex IX: Assessments Quality ChecksLahj Lowland Ecological Zone: Overall Data QualityLahj Mountain Ecological Zone: Overall Data Quality77
Annex X: Suspected measles cases reportedLowland ecological zoneMountainous ecological zoneDistrict Village name No. of cases reported District Village No. of cases reportedAlMelah Alrakb 6 Al-Had Barakan 13AlMadhareba RasMa'amerAlara4 Yahr Dhalem 5Habeel Jabr Rahwat Amria 4 Al-Meflehi Othara 5Toor Albaha Toor Alborook 3 Al-Kabaita Al-Makhaira 4Tuban Harran dyan 3 Al-Makatera Al-Amook 3Radfan Albareda 3 Al-Kabaita Al-Sha'bain 3Alkabaita Alsehr 3 Al-Melah Lassat 3TubanSaberHabeel Alraida33 HalmeenAlHwata Aldubba 2 Yafea Al-Kern 3Toor Albaha Almokait 2 Al-Melah Lassat 2AlMusaimeer Alfosail 2 Yafea Dhaisra 2Tuban Alnoba 2 Yafea October 2Alkabaita Alsofaila 2 Yafea Al-Dhahra 2Tuban Oberlasloom 1 Habeel Jabr Al-Shaiba 2Tuban Amjerba 1 Yafea Mankal 1Tuban Alkhodad 1 Al-Makatera Al-seer 1Toor Albaha AlMojailba 1 Halmeen Asfal Shattan 1Toor Albaha Habeel Alsabt 1 Al-Had Al-Majadeer 1Radfan Alhamra 1 Yafea Marfad 1Tuban Beer Haidra 1 Al-Kabaita Al-A'ajool 1AlMadhareba RasAlborodaAlara1 Yahr Al-arsh 1Habeel Jabr Alkharoof 1 Al-Kabaita Al-Kdakeda 178