Download - Yemen Humanitarian Response | YEMEN
Download - Yemen Humanitarian Response | YEMEN
Download - Yemen Humanitarian Response | YEMEN

You also want an ePaper? Increase the reach of your titles
YUMPU automatically turns print PDFs into web optimized ePapers that Google loves.
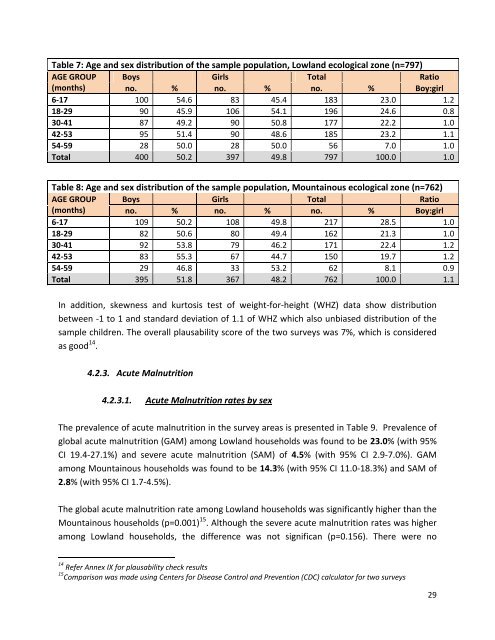
Table 7: Age and sex distribution of the sample population, Lowland ecological zone (n=797)AGE GROUP Boys Girls Total Ratio(months) no. % no. % no. % Boy:girl6-17 100 54.6 83 45.4 183 23.0 1.218-29 90 45.9 106 54.1 196 24.6 0.830-41 87 49.2 90 50.8 177 22.2 1.042-53 95 51.4 90 48.6 185 23.2 1.154-59 28 50.0 28 50.0 56 7.0 1.0Total 400 50.2 397 49.8 797 100.0 1.0Table 8: Age and sex distribution of the sample population, Mountainous ecological zone (n=762)AGE GROUP Boys Girls Total Ratio(months) no. % no. % no. % Boy:girl6-17 109 50.2 108 49.8 217 28.5 1.018-29 82 50.6 80 49.4 162 21.3 1.030-41 92 53.8 79 46.2 171 22.4 1.242-53 83 55.3 67 44.7 150 19.7 1.254-59 29 46.8 33 53.2 62 8.1 0.9Total 395 51.8 367 48.2 762 100.0 1.1In addition, skewness and kurtosis test of weight-for-height (WHZ) data show distributionbetween -1 to 1 and standard deviation of 1.1 of WHZ which also unbiased distribution of thesample children. The overall plausability score of the two surveys was 7%, which is consideredas good 14 .4.2.3. Acute Malnutrition4.2.3.1. Acute Malnutrition rates by sexThe prevalence of acute malnutrition in the survey areas is presented in Table 9. Prevalence ofglobal acute malnutrition (GAM) among Lowland households was found to be 23.0% (with 95%CI 19.4-27.1%) and severe acute malnutrition (SAM) of 4.5% (with 95% CI 2.9-7.0%). GAMamong Mountainous households was found to be 14.3% (with 95% CI 11.0-18.3%) and SAM of2.8% (with 95% CI 1.7-4.5%).The global acute malnutrition rate among Lowland households was significantly higher than theMountainous households (p=0.001) 15 . Although the severe acute malnutrition rates was higheramong Lowland households, the difference was not significan (p=0.156). There were no14 Refer Annex IX for plausability check results15 Comparison was made using Centers for Disease Control and Prevention (CDC) calculator for two surveys29