Tellabs Financial Performance: 4th Quarter Earnings 2010
Tellabs Financial Performance: 4th Quarter Earnings 2010
Tellabs Financial Performance: 4th Quarter Earnings 2010
Create successful ePaper yourself
Turn your PDF publications into a flip-book with our unique Google optimized e-Paper software.
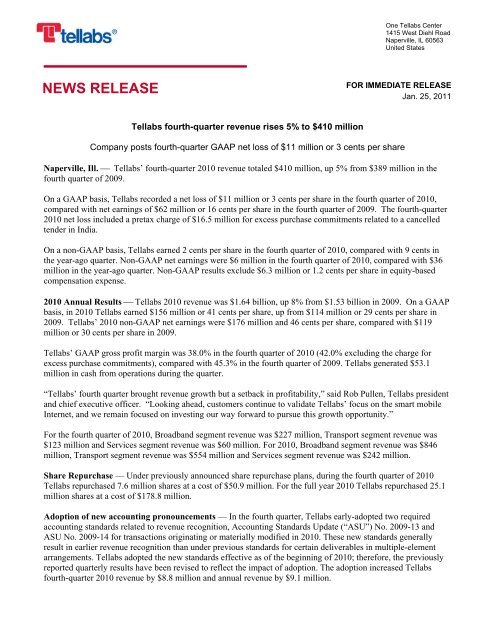
One <strong>Tellabs</strong> Center1415 West Diehl RoadNaperville, IL 60563United StatesNEWS RELEASEFOR IMMEDIATE RELEASEJan. 25, 2011<strong>Tellabs</strong> fourth-quarter revenue rises 5% to $410 millionCompany posts fourth-quarter GAAP net loss of $11 million or 3 cents per shareNaperville, Ill. ⎯ <strong>Tellabs</strong>’ fourth-quarter <strong>2010</strong> revenue totaled $410 million, up 5% from $389 million in thefourth quarter of 2009.On a GAAP basis, <strong>Tellabs</strong> recorded a net loss of $11 million or 3 cents per share in the fourth quarter of <strong>2010</strong>,compared with net earnings of $62 million or 16 cents per share in the fourth quarter of 2009. The fourth-quarter<strong>2010</strong> net loss included a pretax charge of $16.5 million for excess purchase commitments related to a cancelledtender in India.On a non-GAAP basis, <strong>Tellabs</strong> earned 2 cents per share in the fourth quarter of <strong>2010</strong>, compared with 9 cents inthe year-ago quarter. Non-GAAP net earnings were $6 million in the fourth quarter of <strong>2010</strong>, compared with $36million in the year-ago quarter. Non-GAAP results exclude $6.3 million or 1.2 cents per share in equity-basedcompensation expense.<strong>2010</strong> Annual Results ⎯ <strong>Tellabs</strong> <strong>2010</strong> revenue was $1.64 billion, up 8% from $1.53 billion in 2009. On a GAAPbasis, in <strong>2010</strong> <strong>Tellabs</strong> earned $156 million or 41 cents per share, up from $114 million or 29 cents per share in2009. <strong>Tellabs</strong>’ <strong>2010</strong> non-GAAP net earnings were $176 million and 46 cents per share, compared with $119million or 30 cents per share in 2009.<strong>Tellabs</strong>’ GAAP gross profit margin was 38.0% in the fourth quarter of <strong>2010</strong> (42.0% excluding the charge forexcess purchase commitments), compared with 45.3% in the fourth quarter of 2009. <strong>Tellabs</strong> generated $53.1million in cash from operations during the quarter.“<strong>Tellabs</strong>’ fourth quarter brought revenue growth but a setback in profitability,” said Rob Pullen, <strong>Tellabs</strong> presidentand chief executive officer. “Looking ahead, customers continue to validate <strong>Tellabs</strong>’ focus on the smart mobileInternet, and we remain focused on investing our way forward to pursue this growth opportunity.”For the fourth quarter of <strong>2010</strong>, Broadband segment revenue was $227 million, Transport segment revenue was$123 million and Services segment revenue was $60 million. For <strong>2010</strong>, Broadband segment revenue was $846million, Transport segment revenue was $554 million and Services segment revenue was $242 million.Share Repurchase — Under previously announced share repurchase plans, during the fourth quarter of <strong>2010</strong><strong>Tellabs</strong> repurchased 7.6 million shares at a cost of $50.9 million. For the full year <strong>2010</strong> <strong>Tellabs</strong> repurchased 25.1million shares at a cost of $178.8 million.Adoption of new accounting pronouncements — In the fourth quarter, <strong>Tellabs</strong> early-adopted two requiredaccounting standards related to revenue recognition, Accounting Standards Update (“ASU”) No. 2009-13 andASU No. 2009-14 for transactions originating or materially modified in <strong>2010</strong>. These new standards generallyresult in earlier revenue recognition than under previous standards for certain deliverables in multiple-elementarrangements. <strong>Tellabs</strong> adopted the new standards effective as of the beginning of <strong>2010</strong>; therefore, the previouslyreported quarterly results have been revised to reflect the impact of adoption. The adoption increased <strong>Tellabs</strong>fourth-quarter <strong>2010</strong> revenue by $8.8 million and annual revenue by $9.1 million.
First-<strong>Quarter</strong> 2011 Guidance — The following statements are forward-looking statements that are based oncurrent expectations and involve risks and uncertainties, some of which are set forth below. We expect firstquarter2011 revenue to be in a range from $315 million to $335 million. We expect non-GAAP gross margin tobe 40%, plus or minus two points, depending on product mix. We expect first-quarter non-GAAP operatingexpense to be down slightly, in the high $140 millions. <strong>Tellabs</strong>’ first-quarter non-GAAP gross margin excludesapproximately $1 million, and non-GAAP operating expense excludes approximately $6 million, in equity-basedcompensation expense. We expect a first-quarter non-GAAP tax rate of about 32%.<strong>Tellabs</strong> believes that the presentation of non-GAAP financial information provides important supplementalinformation to management and investors regarding financial and business trends relating to the company'sfinancial results. More detailed information, including year-over-year segment comparisons, non-GAAPreconciliation tables and the reasons management believes non-GAAP measures provide useful information toinvestors can be found in the Results of Operations section of this news release.Simultaneous Webcast and Teleconference Replay — <strong>Tellabs</strong> will host an investor teleconference at 7:30 a.m.Central Standard Time today to discuss its fourth-quarter results and provide its outlook for the first quarter of2011. Internet users can hear a simultaneous webcast of the teleconference at http://www.tellabs.com; click on thewebcast icon. A taped replay of the call will be available beginning at approximately 10:30 a.m. Central StandardTime today, until 10:30 p.m. Central Standard Time on Thursday, Jan. 27, at 800-642-1687. (Outside the UnitedStates, call 706-645-9291.) When prompted, enter the <strong>Tellabs</strong> conference ID number: 35817258. A podcast of thecall will be available at http://www.tellabs.com/news/feeds/ later today.About <strong>Tellabs</strong> — <strong>Tellabs</strong> helps customers succeed through innovation. That’s why 43 of the top 50 globaltelecom service providers choose our mobile, optical and business solutions. We help telecom service providers,independent operating companies, MSO/cable TV companies, enterprises and government agencies get ahead byadding revenue, reducing expenses and optimizing networks. With wireless and wireline networks in more than90 countries, we enrich people’s lives by innovating the way the world connects. <strong>Tellabs</strong> (Nasdaq: TLAB) ispart of the NASDAQ Global Select Market, Ocean Tomo 300 Patent Index, the S&P 500 and several corporateresponsibility indexes including FTSE4Good and eight FTSE KLD indexes. http://www.tellabs.comForward-Looking Statements — This news release, which includes the Results of Operations discussion thatfollows, contains forward-looking statements, including but not limited to the next-quarter 2011 guidance andcost savings information contained in this release, that involve risks and uncertainties. Actual results may differfrom the results discussed in the forward-looking statements. Factors that might cause such a difference include,but are not limited to, risks associated with: the competitive landscape, including pricing and margin pressures,the response of customers and competitors, industry consolidation, the integration of a new business, theintroduction of new products, the entrance into new markets, the ability to secure necessary resources, the abilityto realize anticipated savings under our cost-reduction initiatives, and overall negative economic conditionsgenerally and disruptions in credit and capital markets, including specific impacts of these conditions on thetelecommunications industry. In light of these factors investors are advised not to rely on forward-lookingstatements in deciding whether to buy, sell or hold the company’s securities. The company undertakes noobligation to revise or update these forward-looking statements to reflect events or circumstances after today or toreflect the occurrence of unanticipated events.MEDIA CONTACT: George Stenitzer, +1.630.798.3800, george.stenitzer@tellabs.comINVESTOR CONTACT: Tom Scottino, +1.630.798.3602, tom.scottino@tellabs.com<strong>Tellabs</strong> ® and® are trademarks of <strong>Tellabs</strong> or its affiliates in the United States and/or other countries. Anyother company or product names mentioned herein may be trademarks of their respective companies.
TELLABS, INC.CONSOLIDATED STATEMENTS OF OPERATIONSFourth <strong>Quarter</strong>YearIn millions, except per-share data 12/31/10 1/1/10 12/31/10 1/1/10UnauditedUnauditedRevenueProducts $ 350.3 $ 324.6 $ 1,400.0 $ 1,295.4Services 60.2 64.7 242.3 230.3Total revenue 410.5 389.3 1,642.3 1,525.7Cost of RevenueProducts 212.4 170.5 689.3 709.2Services 42.3 42.6 163.4 150.7Total cost of revenue 254.7 213.1 852.7 859.9Gross Profit 155.8 176.2 789.6 665.8Gross profit as a percentage of revenue 38.0% 45.3% 48.1% 43.6%Gross profit as a percentage of revenue - products 39.4% 47.5% 50.8% 45.3%Gross profit as a percentage of revenue - services 29.7% 34.2% 32.6% 34.6%Operating ExpensesResearch and development 82.9 67.1 299.7 268.7Sales and marketing 46.8 42.0 179.3 165.9General and administrative 26.7 24.8 100.4 101.4Intangible asset amortization 6.1 6.6 27.0 24.6Restructuring and other charges - 0.6 9.5 11.7Total operating expenses 162.5 141.1 615.9 572.3Operating (Loss) <strong>Earnings</strong> (6.7) 35.1 173.7 93.5Operating (loss) earnings as a percentage of revenue -1.6% 9.0% 10.6% 6.1%Other (Expense) IncomeInterest income, net 3.4 4.5 12.6 19.3Other (expense) income, net (4.5) (0.9) 5.2 0.4Total other (expense) income (1.1) 3.6 17.8 19.7(Loss) <strong>Earnings</strong> Before Income Tax (7.8) 38.7 191.5 113.2Income tax (expense) benefit (3.1) 23.4 (35.9) 0.4Net (Loss) <strong>Earnings</strong> $ (10.9) $ 62.1 $ 155.6 $ 113.6Weighted Average Shares OutstandingBasic 365.9 385.5 378.1 392.5Diluted 365.9 387.9 382.7 394.2Net (Loss) <strong>Earnings</strong> Per ShareBasic $ (0.03) $ 0.16 $ 0.41 $ 0.29Diluted $ (0.03) $ 0.16 $ 0.41 $ 0.29Cash Dividends Per Share $ 0.02 $ -$ 0.08 $ -
TELLABS, INC.CONSOLIDATED BALANCE SHEETS12/31/10 1/1/10In millions, except share dataUnauditedAssetsCurrent AssetsCash and cash equivalents $ 208.8 $ 154.0Investments in marketable securities 925.7 950.8Total cash, cash equivalents and marketable securities 1,134.5 1,104.8Other marketable securities 213.6 252.8Accounts receivable, net of allowances of $1.3 and $1.4 342.6 334.2InventoriesRaw materials 30.3 24.0Work in process - 3.8Finished goods 132.0 99.9Total inventories 162.3 127.7Income taxes 14.8 24.2Miscellaneous receivables and other current assets 45.0 54.4Total Current Assets 1,912.8 1,898.1Property, Plant and EquipmentLand 20.8 21.2Buildings and improvements 204.2 199.6Equipment 422.8 415.9Total property, plant and equipment 647.8 636.7Accumulated depreciation (378.5) (366.1)Property, plant and equipment, net 269.3 270.6Goodwill 204.9 207.2Intangible Assets, Net of Amortization 96.7 123.2Other Assets 119.2 123.7Total Assets $ 2,602.9 $ 2,622.8Liabilities and Stockholders' EquityCurrent LiabilitiesAccounts payable $ 123.4 $ 71.5Accrued compensation 97.2 82.0Restructuring and other charges 7.7 9.8Income taxes 88.4 80.8Loan related to other marketable securities 213.6 252.8Deferred revenue 43.0 31.3Other accrued liabilities 89.8 81.2Total Current Liabilities 663.1 609.4Long-Term Restructuring Liabilities 3.1 7.2Income Taxes 28.1 41.9Other Long-Term Liabilities 47.1 49.4Stockholders' EquityPreferred stock: authorized 5,000,000 shares of $0.01 par value;no shares issued and outstanding - -Common stock: authorized 1,000,000,000 shares of $0.01 par value;501,744,627 and 497,734,039 shares issued 5.0 5.0Additional paid-in capital 1,547.9 1,511.2Treasury stock, at cost: 139,243,079 and 113,457,637 shares (1,222.1) (1,037.9)Retained earnings 1,422.1 1,296.8Accumulated other comprehensive income 108.6 139.8Total Stockholders' Equity 1,861.5 1,914.9Total Liabilities and Stockholders' Equity $ 2,602.9 $ 2,622.8
TELLABS, INC.CONSOLIDATED STATEMENTS OF CASH FLOWSYear12/31/10 1/1/10In millionsUnauditedOperating ActivitiesNet earnings $ 155.6 $ 113.6Adjustments to reconcile net earnings to net cashprovided by operating activities:Depreciation and amortization 77.3 75.3Loss on disposal of property, plant and equipment 0.3 0.8Equity-based compensation 27.0 20.7Deferred income taxes 18.1 (9.2)Net gains on investments in marketable securities (12.2) (4.7)Excess tax benefits from equity-based compensation (1.6) (0.3)Restructuring and other charges 9.5 11.7Other-than-temporary impairment charges on investments 3.8 0.4Net changes in assets and liabilities:Accounts receivable (17.9) 8.8Inventories (35.5) 56.4Miscellaneous receivables and other current assets 10.6 9.4Other assets (4.1) 0.1Accounts payable 52.7 (21.4)Restructuring and other charges (13.0) (21.1)Deferred revenue 11.9 (3.7)Other accrued liabilities 25.6 2.8Income taxes (16.8) (10.9)Other long-term liabilities (2.5) 1.0Net Cash Provided by Operating Activities288.8 229.7Investing ActivitiesCapital expenditures (55.6) (45.9)Proceeds on disposals of property, plant and equipment 0.1 1.0Payments for purchases of investments (2,217.7) (1,112.2)Proceeds from sales and maturities of investments 2,245.1 946.2Payments for acquisition, net of cash acquired - (164.7)Net Cash Used for Investing Activities(28.1) (375.6)Financing ActivitiesProceeds from issuance of common stock under stock plans 8.0 1.7Repurchase of common stock (184.2) (85.5)Excess tax benefits from equity-based compensation 1.6 0.3Dividends Paid (30.3) -Net Cash Used for Financing Activities(204.9) (83.5)Effect of Exchange Rate Changes on CashNet Increase (Decrease) in Cash and Cash EquivalentsCash and Cash Equivalents - Beginning of YearCash and Cash Equivalents - End of Year(1.0) 7.354.8 (222.1)154.0 376.1$ 208.8 $ 154.0
RESULTS OF OPERATIONSWe operate in three business segments: Broadband, Transport and Services. For the fourth quarter of <strong>2010</strong>, revenue grew to $410.5million, up 5.4% from $389.3 million in the fourth quarter of 2009. For the year <strong>2010</strong>, revenue grew to $1,642.3 million, up 7.6%from $1,525.7 million in 2009. In the three-month period, increased revenue in the Broadband segment offset lower revenue in theTransport and Services segments. For the year <strong>2010</strong>, revenue increased in all three segments.Consolidated gross profit margin in the fourth quarter of <strong>2010</strong> was 38.0%, compared with 45.3% in the year-ago quarter. Grossmargin included a charge of $16.5 million for excess purchase commitments. Excluding this charge, consolidated gross margin for thefourth quarter of <strong>2010</strong> was 42.0%. For the year <strong>2010</strong>, consolidated gross margin grew to 48.1%, up 4.5 percentage points from 43.6%in 2009. Products and services gross margins decreased in the three-month period. For the year <strong>2010</strong>, products gross marginsimproved and services margins declined.Operating expenses in the fourth quarter of <strong>2010</strong> were $162.5 million, compared with $141.1 million in the year-ago quarter. For theyear <strong>2010</strong>, operating expenses were $615.9 million, compared with $572.3 million in 2009.Operating loss in the fourth quarter of <strong>2010</strong> was $6.7 million, compared with operating earnings of $35.1 million in the year-agoquarter. For the year <strong>2010</strong>, operating earnings grew to $173.7 million, up $80.2 million from $93.5 million in 2009.Net loss for the fourth quarter of <strong>2010</strong> was $10.9 million or $0.03 per share (basic and diluted), compared with net earnings of $62.1million or $0.16 per share (basic and diluted) in the year-ago quarter. Net earnings for the year <strong>2010</strong> grew to $155.6 million or $0.41per share (basic and diluted), up 37.0% from $113.6 million or $0.29 per share (basic and diluted) in 2009.Revenue (in millions)Fourth <strong>Quarter</strong>Year<strong>2010</strong> 2009 Change <strong>2010</strong> 2009 ChangeProducts $350.3 $324.6 7.9% $1,400.0 $1,295.4 8.1%Services 60.2 64.7 (7.0)% 242.3 230.3 5.2%Total revenue $410.5 $389.3 5.4% $1,642.3 $1,525.7 7.6%Products revenue grew year-over-year in both the three-month period and the year <strong>2010</strong>. Services revenue decreased in the threemonthperiod and increased in the year <strong>2010</strong>.In the fourth quarter of <strong>2010</strong>, we early adopted two new required accounting standards related to revenue recognition: AccountingStandards Update (ASU) 2009-13, Multiple-Deliverable Revenue Arrangements, and ASU 2009-14, Certain Revenue ArrangementsThat Include Software Elements. These new standards generally result in earlier revenue recognition than under previous standards forcertain deliverables in multiple-element arrangements. We adopted these standards effective as of the beginning of <strong>2010</strong>; therefore,the previously reported quarterly results have been revised to reflect the impact of the adoption. Revenue and net earnings in the fourthquarter of <strong>2010</strong> increased by $8.8 million and $0.5 million, respectively. For the year <strong>2010</strong>, revenue and net earnings increased by$9.1 million and $0.5 million, respectively. We adopted these standards in the fourth quarter of <strong>2010</strong> because we were entering intoseveral multi-year agreements. We believe the new rules best reflect the economics of those agreements over time.In the fourth quarter of <strong>2010</strong>, we agreed with a North American customer to add a data product to other <strong>Tellabs</strong> products already soldto that customer through a distributor. This helps the customer better manage inventory and deployment schedules. As a result, werecognized $20.8 million in revenue in the fourth quarter of <strong>2010</strong> that otherwise would have been recognized in the first quarter of2011.On a geographic basis, revenue from customers in North America (United States and Canada) was $240.5 million (or 59% of totalrevenue) in the fourth quarter of <strong>2010</strong>, compared with $255.4 million (or 66% of total revenue) in the year-ago quarter. For the year<strong>2010</strong>, North American revenue grew to $1,142.6 million (or 70% of total revenue), up 13.7% from $1,005.3 million (or 66% of totalrevenue) in 2009. The decrease in revenue for the three-month period was driven primarily by lower revenue for data and digitalcross-connect systems from a major North American carrier. The increase in revenue for the year <strong>2010</strong> was driven primarily by higherrevenue for data and digital cross-connect systems from the same customer.Revenue from customers outside North America grew to $170.0 million (or 41% of total revenue) in the fourth quarter of <strong>2010</strong>, up27.0% from $133.9 million (or 34% of total revenue) in the year-ago quarter. For the year <strong>2010</strong>, revenue from customers outsideNorth America was $499.7 million (or 30% of total revenue), compared with $520.4 million (or 34% of total revenue) in 2009. Theincrease in revenue for the three-month period was driven primarily by higher revenue from data products in the Europe, Middle Eastand Africa region. The decline in revenue for the year <strong>2010</strong> was driven primarily by lower revenue from data products in the AsiaPacific region.
In the fourth quarter of <strong>2010</strong>, revenue from our growth portfolio (the <strong>Tellabs</strong> ® 6300 Managed Transport System, the <strong>Tellabs</strong> ® 7100Optical Transport System, the <strong>Tellabs</strong> ® 7300 Metro Ethernet Switching Series, the <strong>Tellabs</strong> ® 8600 Managed Edge System, the <strong>Tellabs</strong> ®8800 Multiservice Router Series, the <strong>Tellabs</strong> ® SmartCore ® 9100 Platform, and professional services) grew to $231.4 million (or 56%of total revenue), up 22.8% from $188.5 million (or 48% of total revenue) in the year-ago quarter. Our core portfolio (the <strong>Tellabs</strong> ®5000 series of digital cross-connect systems, the <strong>Tellabs</strong> ® 8100 Managed Access System, the <strong>Tellabs</strong> ® 8000 Intelligent NetworkManager, the <strong>Tellabs</strong> ® 3000 Series of voice-enhancement products, the <strong>Tellabs</strong> Access products and deployment, training and supportservices) accounted for $179.1 million (or 44% of total revenue), compared with $200.8 million (or 52% of total revenue) in the yearagoquarter.For the year <strong>2010</strong>, growth portfolio revenue grew to $914.3 million (or 56% of total revenue), up 29.4% from $706.4 million (or 46%of total revenue) in 2009. The balance of our revenue came from our core portfolio, which contributed $728.0 million of revenue in<strong>2010</strong>, compared with $819.3 million in 2009.Gross MarginFourth <strong>Quarter</strong>Year<strong>2010</strong> 2009% PointChange <strong>2010</strong> 2009% PointChangeProducts 39.4% 47.5% (8.1) 50.8% 45.3% 5.5Services 29.7% 34.2% (4.5) 32.6% 34.6% (2.0)Consolidated 38.0% 45.3% (7.3) 48.1% 43.6% 4.5The decline in products gross margin for the three-month period was driven by lower revenue from digital cross-connect and managedaccess systems, higher revenue from optical transport systems, and a $16.5 million charge for excess purchase commitments. The$16.5 million pretax charge relates to excess purchase commitments for a large tender in India that was subsequently cancelled by thecustomer. Excluding this charge, gross margin for the fourth quarter of <strong>2010</strong> was 42.0%. The increase in products gross margin for theyear <strong>2010</strong> was driven primarily by higher level of revenue from higher-margin digital cross-connect systems and data products.Services gross margin declined in three-month period as a result of the overall lower level of services revenue. For the year <strong>2010</strong>, thedecline in services gross margin was driven by the higher level of lower-margin deployment services.Operating Expenses (in millions) Fourth <strong>Quarter</strong> Percent of Revenue<strong>2010</strong> 2009 Change <strong>2010</strong> 2009Research and development $ 82.9 $ 67.1 $15.8 20.2% 17.2%Sales and marketing 46.8 42.0 4.8 11.4% 10.8%General and administrative 26.7 24.8 1.9 6.5% 6.4%Subtotal 156.4 133.9 22.5 38.1% 34.4%Intangible asset amortization 6.1 6.6 (0.5)Restructuring and other charges - 0.6 (0.6)Total operating expenses $162.5 $141.1 $21.4YearPercent of Revenue<strong>2010</strong> 2009 Change <strong>2010</strong> 2009Research and development $299.7 $268.7 $31.0 18.2% 17.6%Sales and marketing 179.3 165.9 13.4 10.9% 10.9%General and administrative 100.4 101.4 (1.0) 6.1% 6.6%Subtotal 579.4 536.0 43.4 35.3% 35.1%Intangible asset amortization 27.0 24.6 2.4Restructuring and other charges 9.5 11.7 (2.2)Total operating expenses $615.9 $572.3 $43.6Operating expenses increased during the fourth quarter and the year <strong>2010</strong>, compared with the year-ago periods, due primarily tohigher research and development for growth products for the mobile internet as well higher sales and marketing costs associated withexpansion into growth markets outside North America. Restructuring and other charges of $9.5 million in <strong>2010</strong> are primarily due toseverance, facility- and asset-related charges.
Other (Expense) Income (in millions)Fourth <strong>Quarter</strong>Year<strong>2010</strong> 2009 Change <strong>2010</strong> 2009 ChangeInterest income, net $ 3.4 $4.5 $(1.1) $12.6 $19.3 $(6.7)Other (expense) income, net (4.5) (0.9) (3.6) 5.2 0.4 4.8Total other (expense) income $(1.1) $3.6 $(4.7) $17.8 $19.7 $(1.9)Interest income, net, declined due to lower yields during the fourth quarter and the year <strong>2010</strong>, compared with the year-ago periods.Other (expense) income, net, decreased in the fourth quarter of <strong>2010</strong>, compared with the fourth quarter of 2009, primarily due to the$3.8 million write-down of a long-term equity investment in the fourth quarter of <strong>2010</strong>, compared with the $0.4 million write-down oflong-term equity investments in partnerships and start-up technology companies in the fourth quarter of 2009. For the year <strong>2010</strong>,other (expense) income, net, was higher compared with 2009, primarily due to additional gains taken on fixed income investmentsduring <strong>2010</strong>.Income TaxesIn the fourth quarter of <strong>2010</strong>, income tax expense was $3.1 million, compared with a benefit of $23.4 million in the year-ago quarter.Income tax expense increased by $24.2 million due to the absence of a tax benefit recognized in the fourth quarter of 2009 from therelease of a valuation allowance recorded in accounting for the acquisition of WiChorus, Inc. (WiChorus). Tax expense also increasedby approximately $7.0 million due to the difference between our estimated and actual effective tax rate caused by changes in earningsmix, offset by a benefit of $3.0 million from the reinstatement of the U.S. research and development credit.In the year <strong>2010</strong>, income tax expense was $35.9 million, compared with a benefit of $0.4 million in 2009. The increase in income taxresults from an increase in pretax income, and reflects the absence of a $24.2 million tax benefit recorded in the fourth quarter of 2009from the release of a valuation allowance recorded in accounting for the acquisition of WiChorus.SegmentsSegment Revenue (in millions)Fourth <strong>Quarter</strong>Year<strong>2010</strong> 2009 Change <strong>2010</strong> 2009 ChangeBroadband $227.0 $191.4 18.6% $ 846.0 $ 785.8 7.7%Transport 123.3 133.2 (7.4)% 554.0 509.6 8.7%Services 60.2 64.7 (7.0)% 242.3 230.3 5.2%Total revenue $410.5 $389.3 5.4% $1,642.3 $1,525.7 7.6%Segment Profit* (in millions)Fourth <strong>Quarter</strong>Year<strong>2010</strong> 2009 Change <strong>2010</strong> 2009 ChangeBroadband $33.8 $ 44.4 (23.9)% $229.4 $185.7 23.5%Transport 23.5 44.5 (47.2)% 191.8 139.4 37.6%Services 18.5 22.6 (18.1)% 81.2 81.8 (0.7)%Total segment profit $75.8 $111.5 (32.0)% $502.4 $406.9 23.5%* We define segment profit as gross profit less research and development expenses. Segment profit excludes sales and marketingexpenses, general and administrative expenses, the amortization of intangibles, restructuring and other charges, and the impact ofequity-based compensation.BroadbandRevenueRevenue from the Broadband segment was $227.0 million in the fourth quarter of <strong>2010</strong>, up 18.6% from $191.4 million in the year-agoquarter. For the year <strong>2010</strong>, Broadband segment revenue was $846.0 million, up 7.7% from $785.8 million in 2009. The Broadbandsegment includes data products, managed access products and access products. In the three-month period, increased revenue from dataand access products offset lower revenue from managed access products. In the full-year period, increased revenue from data productsoffset lower revenue from access and managed access products.
Data product revenue grew to $119.9 million in the fourth quarter of <strong>2010</strong>, up 32.5% from $90.5 million in the year-ago quarter. Forthe year <strong>2010</strong>, data revenue grew to $520.4 million, up 52.2% from $342.0 million in 2009. We are participating in large networkbuilds in North America and internationally. The increase in data revenue for the three-month period was driven primarily by multiplecarriers in the Europe, Middle East and Africa region, which offset lower data revenue in North America. The increase in data revenuefor the year <strong>2010</strong> was driven primarily by a major North American customer.Access revenue was $69.6 million in the fourth quarter of <strong>2010</strong>, up 25.0% from $55.7 million in the year-ago quarter. For the year<strong>2010</strong>, access revenue was $198.1 million, compared with $274.4 million in 2009. In the three-month period, increased revenue fromsingle-family optical network terminal (ONT) units offset decreased revenue from other access products. Access revenue declined inthe year <strong>2010</strong> as several key customers continued to transition to alternate network architectures.Managed access revenue was $37.5 million in the fourth quarter of <strong>2010</strong>, compared with $45.2 million in the year-ago quarter. For theyear <strong>2010</strong>, managed access revenue was $127.5 million, compared with $169.4 million in 2009. In the three-month period, higherrevenue from SDH transport systems was offset by lower revenue from managed access systems. For the year <strong>2010</strong>, revenue fromboth managed access systems and SDH transport systems declined as customers around the world continued to migrate to InternetProtocol (IP) and Ethernet data products.Segment ProfitBroadband segment profit was $33.8 million in the fourth quarter of <strong>2010</strong>, compared with $44.4 million in the year-ago quarter. Forthe year of <strong>2010</strong>, Broadband segment profit grew to $229.4 million, up 23.5% from $185.7 million in 2009. The decline in Broadbandsegment profit for the three-month period was driven by the $16.5 million charge for excess purchase commitments. The level ofmanaged access and access product revenue and higher research and development expenses for data products.TransportRevenueRevenue from the Transport segment was $123.3 million in the fourth quarter of <strong>2010</strong>, compared with $133.2 million in the year-agoquarter. For the year <strong>2010</strong>, Transport segment revenue grew to $554.0 million, up 8.7% from $509.6 million in 2009. In the threemonthperiod, increased revenue from optical transport systems was offset by lower revenue from digital cross-connect systems. Forthe year <strong>2010</strong>, revenue from both optical transport and digital cross-connect systems increased.Segment ProfitTransport segment profit was $23.5 million in the fourth quarter of <strong>2010</strong>, compared with $44.5 million in the year-ago quarter. Forthe year <strong>2010</strong>, Transport segment profit grew to $191.8 million, up 37.6% from $139.4 million in 2009. The decrease in segmentprofit in the three-month period was driven primarily by lower revenue from higher-margin digital cross-connect systems and higherrevenue from lower margin optical transport systems. The increase in segment profit for the year <strong>2010</strong> was driven primarily by thehigher level of revenue from both digital cross-connect and optical transport systems.ServicesRevenueRevenue from the Services segment was $60.2 million in the fourth quarter of <strong>2010</strong>, compared with $64.7 million in the year-agoquarter. For the year <strong>2010</strong>, Services segment revenue grew to $242.3 million, up 5.2% from $230.3 million in 2009. The decrease insegment revenue in the three-month period was driven primarily by lower deployment, professional services and training revenueglobally. The increase in segment revenue for the year <strong>2010</strong> was driven primarily by increased deployment revenue on a global basis.Segment ProfitServices segment profit was $18.5 million in the fourth quarter of <strong>2010</strong>, compared with $22.6 million in the year-ago quarter. For theyear <strong>2010</strong>, Services segment profit was $81.2 million, compared with $81.8 million in 2009. The decrease in segment profit for bothperiods was driven by higher costs.<strong>Financial</strong> Condition, Liquidity & Capital ResourcesOur principal source of liquidity remained cash, cash equivalents and marketable securities of $1,134.5 million as of December 31,<strong>2010</strong>, which decreased by $35.4 million during the quarter and increased by $29.7 million since year-end 2009. The increase in cash,cash equivalents and marketable securities for the full year <strong>2010</strong> reflects $288.8 million in cash generated from operating activities,partially offset by cash used to repurchase our common stock, distributions of cash dividends and normal capital expenditures.During the fourth quarter of <strong>2010</strong>, we distributed $7.4 million to our stockholders through our quarterly cash dividend andrepurchased 7.6 million shares of common stock at a cost of $50.9 million. During the year <strong>2010</strong>, we distributed $30.3 millionthrough quarterly cash dividends and repurchased 25.1 million shares of common stock at a cost of $178.8 million. We provide noassurances as to future repurchases of common stock or declarations or payments of cash dividends.
We believe that our investments are highly liquid instruments. We may rebalance the portfolio from time to time, which may affect itsduration, credit structure and future income.Based on historical performance and current forecasts, we believe the company’s cash, cash equivalents and marketable securities willsatisfy working capital needs, capital expenditures and other liquidity requirements related to existing operations for the next 12months. Future available sources of working capital, including cash, cash equivalents, and marketable securities, cash generated fromfuture operations, short-term or long-term financing, equity offerings or any combination of these sources, should allow us to meet ourlong-term liquidity needs. Current policy is to use cash, cash equivalents and marketable securities to fund business operations, toexpand business, potentially through acquisitions, to repurchase common stock and to pay a cash dividend.GAAP Sequential ComparisonsWe believe that comparing some quarterly Statement of Operations data on a sequential basis provides important supplementalinformation to management and investors regarding financial and business trends relating to our financial results. Commonlycompared sequential comparisons of GAAP data include total revenue, segment revenue and profit, our geographic revenue split andthe split between our growth and core portfolios.Comparing our fourth-quarter <strong>2010</strong> results with the third quarter of <strong>2010</strong>:For the fourth quarter of <strong>2010</strong>, total revenue was $410.5 million, compared with $429.8 million in the prior quarter. On a sequentialbasis, revenue growth in the Broadband segment was offset by lower revenue in the Transport segment and essentially flat revenue inthe Services segment. Revenue concentration from our major customers decreased in the fourth quarter of <strong>2010</strong>, compared with theprior quarter.Total Broadband revenue for the fourth quarter of <strong>2010</strong> was $227.0 million, compared with $199.2 million in the prior quarter.Within the Broadband segment, data revenue grew to $119.9 million, up 8.0% from $111.0 million in the prior quarter. Higherrevenue for data products from customers outside North America offset lower revenue from data customers in North America.Access revenue grew to $69.6 million, up 20.0% from $58.0 million in the prior quarter, driven primarily by an increase in revenuefrom single family optical-network terminating (ONT) units. Managed access revenue grew to $37.5 million, up 24.2% compared with$30.2 million in the prior quarter, as increased revenue from SDH transport systems offset lower revenue from managed accesssystems. Broadband segment profit for the fourth quarter of <strong>2010</strong>, driven by the $16.5 million charge for excess purchasecommitments, was $33.8 million, compared with $48.7 million in the prior quarter.Transport segment revenue for the fourth quarter of <strong>2010</strong> was $123.3 million, compared with $170.1 million in the prior quarter,primarily as a result of decreased revenue from digital cross-connect systems and a slight decreased in revenue from optical transportsystems. Transport segment profit for the fourth quarter of <strong>2010</strong>, driven primarily by lower level of revenue, was $23.5 million,compared with $71.6 million in the prior quarter.Services segment revenue for the fourth quarter of <strong>2010</strong> was $60.2 million, compared with $60.5 million in the prior quarter. Servicessegment profit for the fourth quarter of <strong>2010</strong>, driven by higher costs, was $18.5 million, compared with $22.5 million in the priorquarter.North American revenue for the fourth quarter of <strong>2010</strong> was $240.5 million (or 59% of total revenue) compared with $297.9 million(or 69% of total revenue) in the prior quarter. Outside North America, revenue in the fourth quarter of <strong>2010</strong> grew to $170.0 million (or41% of total revenue), up 28.9% from $131.9 million (or 31% of total revenue) in the prior quarter.Growth portfolio revenue for the fourth quarter of <strong>2010</strong> grew to $231.4 million (or 56% of total revenue), up 3.1% compared with$224.4 million (or 52% of total revenue) in the prior quarter. In the fourth quarter of <strong>2010</strong>, core portfolio revenue was $179.1 million(or 44% of total revenue), compared with $205.4 million (or 48% of total revenue) in the prior quarter.Non-GAAP <strong>Financial</strong> Measures and ComparisonsWe believe that comparing some quarterly non-GAAP financial measures on a sequential basis provides important supplementalinformation to management and investors regarding financial and business trends relating to our financial results. Commonlycompared non-GAAP financial data includes gross profit as a percentage of revenue, operating expenses, operating earnings, netearnings and net earnings per share. A complete reconciliation between non-GAAP financial measures and the GAAP financialmeasures, along with an explanation of why we believe non-GAAP measures to be of value to management and investors, is containedin the Reconciliation of Non-GAAP Adjustments section of this news release.Comparing our fourth-quarter <strong>2010</strong> results with the third quarter of <strong>2010</strong>:Non-GAAP gross profit margin for the fourth quarter of <strong>2010</strong> was 38.2%, compared with 50.5% in the prior quarter. Primary driversfor the decline in gross profit margin include the lower level of transport revenue, primarily digital-cross-connect systems, the fourthquarterinventory charge, the higher level of international data revenue and the lower services margin.
Non-GAAP operating expenses for the fourth quarter of <strong>2010</strong>, driven by higher research and development, sales and marketing andgeneral and administrative spending, were $151.1 million, compared with $137.6 million in the prior quarter.Non-GAAP operating earnings for the fourth quarter of <strong>2010</strong>, driven by lower revenue and gross margin and higher operatingexpenses, were $5.7 million, compared with $79.2 million in the prior quarter.Driven primarily by the overall decrease in revenue and gross margin and higher operating expenses, non-GAAP net earnings in thefourth quarter of <strong>2010</strong> were $5.7 million or $0.02 per share (basic and diluted), compared with $58.8 million or $0.16 per basic shareand $0.15 per diluted share in the prior quarter.
TELLABS, INC.RECONCILIATION OF NON-GAAP ADJUSTMENTS (1)(Unaudited)Fourth <strong>Quarter</strong> <strong>2010</strong> Fourth <strong>Quarter</strong> 2009In millions, except per-share data As Reported Adjustments Non-GAAP As Reported Adjustments Non-GAAPRevenueProducts $ 350.3 $ - $ 350.3 $ 324.6 $ - $ 324.6Services 60.2 - 60.2 64.7 - 64.7Total revenue 410.5 - 410.5 389.3 - 389.3Cost of RevenueProducts (a) 212.4 (0.4) 212.0 170.5 (0.3) 170.2Services (a) 42.3 (0.6) 41.7 42.6 (0.5) 42.1Total cost of revenue 254.7 (1.0) 253.7 213.1 (0.8) 212.3Gross Profit 155.8 1.0 156.8 176.2 0.8 177.0Gross profit as a percentage of revenue 38.0% 0.2% 38.2% 45.3% 0.2% 45.5%Gross profit as a percentage of revenue - products 39.4% 0.1% 39.5% 47.5% 0.1% 47.6%Gross profit as a percentage of revenue - services 29.7% 1.0% 30.7% 34.2% 0.7% 34.9%Operating ExpensesResearch and development (a) 82.9 (1.9) 81.0 67.1 (1.5) 65.6Sales and marketing (a) 46.8 (1.2) 45.6 42.0 (1.0) 41.0General and administrative (a), (b) 26.7 (2.2) 24.5 24.8 (3.5) 21.3Intangible asset amortization (c) 6.1 (6.1) - 6.6 (6.6) -Restructuring and other charges (d) - - - 0.6 (0.6) -Total operating expenses 162.5 (11.4) 151.1 141.1 (13.2) 127.9Operating (Loss) <strong>Earnings</strong> (6.7) 12.4 5.7 35.1 14.0 49.1Operating (loss) earnings as a percentage of revenue -1.6% 3.0% 1.4% 9.0% 3.6% 12.6%Other (Expense) IncomeInterest income, net 3.4 - 3.4 4.5 - 4.5Other (expense) income, net (e) (4.5) 3.8 (0.7) (0.9) 0.4 (0.5)Total other (expense) income (1.1) 3.8 2.7 3.6 0.4 4.0(Loss) <strong>Earnings</strong> Before Income Tax (7.8) 16.2 8.4 38.7 14.4 53.1Income tax (expense) benefit (f) (3.1) 0.4 (2.7) 23.4 (40.4) (17.0)Net (Loss) <strong>Earnings</strong> $ (10.9) $ 16.6 $ 5.7 $ 62.1 $ (26.0) $ 36.1Weighted Average Shares OutstandingBasic 365.9 365.9 385.5 385.5Diluted 365.9 369.6 387.9 387.9Net (Loss) <strong>Earnings</strong> Per ShareBasic $ (0.03) $ 0.05 $ 0.02 $ 0.16 $ (0.07) $ 0.09Diluted $ (0.03) $ 0.05 $ 0.02 $ 0.16 $ (0.07) $ 0.09(1) Reconciliation of non-GAAP AdjustmentsIn addition to reporting financial results in accordance with U.S. generally accepted accounting principles (GAAP), <strong>Tellabs</strong>, Inc. has provided non-GAAPfinancial measures as additional information for its operating results. These measures have not been prepared in accordance with GAAP and may be differentfrom measures used by other companies. Whenever we use non-GAAP financial measures, we designate these measures, which exclude the effect of certaincharges, as “adjusted” and provide a reconciliation of non-GAAP financial measures to the most closely applicable GAAP financial measure. The non-GAAPfinancial measures eliminate certain items of expenses and losses from cost of revenue, operating expenses, other income and expenses, and income taxes.Management believes that this presentation allows investors to better evaluate the current operational and financial performance of our business and facilitatecomparisons to historical results of operations. Management uses these measures for reviewing our financial results and for business planning and performancemanagement. Management discloses this information publicly along with a reconciliation of the comparable GAAP amounts, to provide access to the detail andgeneral nature of adjustments made to GAAP financial results. While some of these excluded items have been periodically reported in our statements ofoperations, including significant restructuring and other charges, their occurrence in future periods depends on future business and economic factors, amongother evaluation criteria, and the occurrence of such events and factors may frequently be beyond the control of management.
TELLABS, INC.RECONCILIATION OF NON-GAAP ADJUSTMENTS (1)(Unaudited)Year <strong>2010</strong> Year 2009In millions, except per-share data As Reported Adjustments Non-GAAP As Reported Adjustments Non-GAAPRevenueProducts $ 1,400.0 $ - $ 1,400.0 $ 1,295.4 $ - $ 1,295.4Services 242.3 - 242.3 230.3 - 230.3Total revenue 1,642.3 - 1,642.3 1,525.7 - 1,525.7Cost of RevenueProducts (a) 689.3 (2.0) 687.3 709.2 (1.6) 707.6Services (a) 163.4 (2.3) 161.1 150.7 (2.2) 148.5Total cost of revenue 852.7 (4.3) 848.4 859.9 (3.8) 856.1Gross Profit 789.6 4.3 793.9 665.8 3.8 669.6Gross profit as a percentage of revenue 48.1% 0.2% 48.3% 43.6% 0.3% 43.9%Gross profit as a percentage of revenue - products 50.8% 0.1% 50.9% 45.3% 0.1% 45.4%Gross profit as a percentage of revenue - services 32.6% 0.9% 33.5% 34.6% 0.9% 35.5%Operating ExpensesResearch and development (a) 299.7 (8.3) 291.4 268.7 (5.9) 262.8Sales and marketing (a) 179.3 (5.1) 174.2 165.9 (4.2) 161.7General and administrative (a), (b) 100.4 (9.1) 91.3 101.4 (8.5) 92.9Intangible asset amortization (c) 27.0 (27.0) - 24.6 (24.6) -Restructuring and other charges (d) 9.5 (9.5) - 11.7 (11.7) -Total operating expenses 615.9 (59.0) 556.9 572.3 (54.9) 517.4Operating <strong>Earnings</strong> 173.7 63.3 237.0 93.5 58.7 152.2Operating earnings as a percentage of revenue 10.6% 3.9% 14.4% 6.1% 3.8% 10.0%Other IncomeInterest income, net 12.6 - 12.6 19.3 - 19.3Other income, net (e) 5.2 3.8 9.0 0.4 0.4 0.8Total other income 17.8 3.8 21.6 19.7 0.4 20.1<strong>Earnings</strong> Before Income Tax 191.5 67.1 258.6 113.2 59.1 172.3Income tax (expense) benefit (f) (35.9) (46.9) (82.8) 0.4 (53.4) (53.0)Net <strong>Earnings</strong> $ 155.6 $ 20.2 $ 175.8 $ 113.6 $ 5.7 $ 119.3Weighted Average Shares OutstandingBasic 378.1 378.1 392.5 392.5Diluted 382.7 382.7 394.2 394.2Net <strong>Earnings</strong> Per ShareBasic $ 0.41 $ 0.05 $ 0.46 $ 0.29 $ 0.01 $ 0.30Diluted $ 0.41 $ 0.05 $ 0.46 $ 0.29 $ 0.01 $ 0.30(1) Reconciliation of non-GAAP AdjustmentsIn addition to reporting financial results in accordance with U.S. generally accepted accounting principles (GAAP), <strong>Tellabs</strong>, Inc. has provided non-GAAPfinancial measures as additional information for its operating results. These measures have not been prepared in accordance with GAAP and may be differentfrom measures used by other companies. Whenever we use non-GAAP financial measures, we designate these measures, which exclude the effect of certaincharges, as “adjusted” and provide a reconciliation of non-GAAP financial measures to the most closely applicable GAAP financial measure. The non-GAAPfinancial measures eliminate certain items of expenses and losses from cost of revenue, operating expenses, other income and expenses, and income taxes.Management believes that this presentation allows investors to better evaluate the current operational and financial performance of our business and facilitatecomparisons to historical results of operations. Management uses these measures for reviewing our financial results and for business planning and performancemanagement. Management discloses this information publicly along with a reconciliation of the comparable GAAP amounts, to provide access to the detail andgeneral nature of adjustments made to GAAP financial results. While some of these excluded items have been periodically reported in our statements ofoperations, including significant restructuring and other charges, their occurrence in future periods depends on future business and economic factors, amongother evaluation criteria, and the occurrence of such events and factors may frequently be beyond the control of management.
TELLABS, INC.RECONCILIATION OF NON-GAAP ADJUSTMENTS (1)(Unaudited)Fourth <strong>Quarter</strong> <strong>2010</strong> Third <strong>Quarter</strong> <strong>2010</strong>In millions, except per-share data As Reported Adjustments Non-GAAP As Revised Adjustments Non-GAAPRevenueProducts $ 350.3 $ - $ 350.3 $ 369.3 $ - $ 369.3Services 60.2 - 60.2 60.5 - 60.5Total revenue 410.5 - 410.5 429.8 - 429.8Cost of RevenueProducts (a) 212.4 (0.4) 212.0 175.6 (0.6) 175.0Services (a) 42.3 (0.6) 41.7 38.6 (0.6) 38.0Total cost of revenue 254.7 (1.0) 253.7 214.2 (1.2) 213.0Gross Profit 155.8 1.0 156.8 215.6 1.2 216.8Gross profit as a percentage of revenue 38.0% 0.2% 38.2% 50.2% 0.3% 50.5%Gross profit as a percentage of revenue - products 39.4% 0.1% 39.5% 52.5% 0.1% 52.6%Gross profit as a percentage of revenue - services 29.7% 1.0% 30.7% 36.2% 1.0% 37.2%Operating ExpensesResearch and development (a) 82.9 (1.9) 81.0 76.3 (2.3) 74.0Sales and marketing (a) 46.8 (1.2) 45.6 43.5 (1.4) 42.1General and administrative (a) 26.7 (2.2) 24.5 24.0 (2.5) 21.5Intangible asset amortization (c) 6.1 (6.1) - 6.1 (6.1) -Restructuring and other charges (d) - - - - - -Total operating expenses 162.5 (11.4) 151.1 149.9 (12.3) 137.6Operating (Loss) <strong>Earnings</strong> (6.7) 12.4 5.7 65.7 13.5 79.2Operating (loss) earnings as a percentage of revenue -1.6% 3.0% 1.4% 15.3% 3.1% 18.4%Other (Expense) IncomeInterest income, net 3.4 - 3.4 2.4 - 2.4Other (expense) income, net (e) (4.5) 3.8 (0.7) 4.8 - 4.8Total other (expense) income (1.1) 3.8 2.7 7.2 - 7.2(Loss) <strong>Earnings</strong> Before Income Tax (7.8) 16.2 8.4 72.9 13.5 86.4Income tax (expense) benefit (f) (3.1) 0.4 (2.7) (16.1) (11.5) (27.6)Net (Loss) <strong>Earnings</strong> $ (10.9) $ 16.6 $ 5.7 $ 56.8 $ 2.0 $ 58.8Weighted Average Shares OutstandingBasic 365.9 365.9 376.3 376.3Diluted 365.9 369.6 379.8 379.8Net (Loss) <strong>Earnings</strong> Per ShareBasic $ (0.03) $ 0.05 $ 0.02 $ 0.15 $ 0.01 $ 0.16Diluted $ (0.03) $ 0.05 $ 0.02 $ 0.15 $ - $ 0.15(1) Reconciliation of non-GAAP AdjustmentsIn addition to reporting financial results in accordance with U.S. generally accepted accounting principles (GAAP), <strong>Tellabs</strong>, Inc. has provided non-GAAPfinancial measures as additional information for its operating results. These measures have not been prepared in accordance with GAAP and may be differentfrom measures used by other companies. Whenever we use non-GAAP financial measures, we designate these measures, which exclude the effect of certaincharges, as “adjusted” and provide a reconciliation of non-GAAP financial measures to the most closely applicable GAAP financial measure. The non-GAAPfinancial measures eliminate certain items of expenses and losses from cost of revenue, operating expenses, other income and expenses, and income taxes.Management believes that this presentation allows investors to better evaluate the current operational and financial performance of our business and facilitatecomparisons to historical results of operations. Management uses these measures for reviewing our financial results and for business planning and performancemanagement. Management discloses this information publicly along with a reconciliation of the comparable GAAP amounts, to provide access to the detail andgeneral nature of adjustments made to GAAP financial results. While some of these excluded items have been periodically reported in our statements ofoperations, including significant restructuring and other charges, their occurrence in future periods depends on future business and economic factors, amongother evaluation criteria, and the occurrence of such events and factors may frequently be beyond the control of management.
Footnotes to reconciliation of non-GAAP adjustments:(a) The adjustments to cost of revenue, research and development, sales and marketing, and general and administrative expenses reflect equity-basedcompensation expense. We exclude these measures when reviewing financial results and for business planning and performance management. Webelieve that the exclusion of equity-based compensation expense allows for more accurate comparisons of operating results to our peer companies. Inaddition, we believe this non-cash GAAP measure is not indicative of our fundamental operating performance.(b) We excluded certain expenses resulting from the acquisition and integration of WiChorus, Inc. in the fourth quarter of 2009 to evaluate ourcontinuing operational performance. For the fourth quarter and full year of 2009, the adjustments were $1.8 million in general and administrativeexpenses. Although these expenses are reflected in our GAAP financials, they may limit the comparability of our on-going operations with prior andfuture periods.(c) We exclude amortization of intangible assets resulting from acquisitions to evaluate our continuing operational performance. The amortization ofpurchased intangible assets associated with acquisitions results in recording expense in our GAAP financial statements that were already expensed bythe acquired company before the acquisition and for which we have not expended cash. We believe this non-cash GAAP measure is not indicative ofour fundamental operating performance. Accordingly, we analyze the performance of operations without regard to such expenses.(d) We exclude restructuring and other charges because we believe that they occur outside of the ordinary course of and are not related directly to theunderlying performance of our fundamental business operations. We exclude these measures when reviewing financial results and for businessplanning and performance management. Although these events are reflected in our GAAP financials, these transactions may limit the comparability ofour fundamental operations with prior and future periods.(e) The $3.8 million adjustments to Other (expense) income in the fourth quarter and full year of <strong>2010</strong> reflects a loss on the write-down of a long-termequity investment in a start-up technology company. The $0.4 million adjustment to Other income in the fourth quarter and full year of 2009 reflects aloss on the write-down of long-term equity investments in partnerships and start-up technology companies. We exclude write-downs and gains on salesof long-term equity investments in partnerships and start-up technology companies because we believe that they are not related directly to the underlyingperformance of our working capital assets.(f) We calculate a separate tax expense and effective tax rate for GAAP and for non-GAAP purposes. For <strong>2010</strong>, for non-GAAP purposes, we use a32% effective tax rate which represents the projected, long term effective tax rate on non-GAAP pretax income. For the fourth quarter and the full yearof 2009, our tax adjustments take into account the impact of (i) the effect on our global effective tax rate across multiple jurisdictions at differing taxrates; and (ii) the valuation allowance maintained against domestic deferred tax assets, which is included in GAAP expense but excluded from non-GAAP expense.


