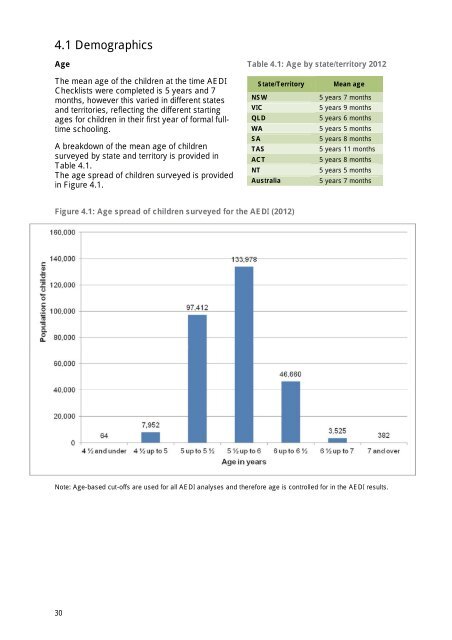
4.1 DemographicsAge Table 4.1: Age by state/territory <strong>2012</strong>The mean age <strong>of</strong> the children at the time AEDIChecklists were completed is 5 years and 7months, however this varied <strong>in</strong> different statesand territories, reflect<strong>in</strong>g the different start<strong>in</strong>gages for children <strong>in</strong> their first year <strong>of</strong> formal fulltimeschool<strong>in</strong>g.A breakdown <strong>of</strong> the mean age <strong>of</strong> childrensurveyed by state and territory is provided <strong>in</strong>Table 4.1.The age spread <strong>of</strong> children surveyed is provided<strong>in</strong> Figure 4.1.State/TerritoryNSWVICQLDWASATASACTNT<strong>Australia</strong>Mean age5 years 7 months5 years 9 months5 years 6 months5 years 5 months5 years 8 months5 years 11 months5 years 8 months5 years 5 months5 years 7 monthsFigure 4.1: Age spread <strong>of</strong> children surveyed for the AEDI (<strong>2012</strong>)Note: Age-based cut-<strong>of</strong>fs are used for all AEDI analyses and therefore age is controlled for <strong>in</strong> the AEDI results.30
Indigenous and Language Background Other Than English childrenThe <strong>Australia</strong>n population is one <strong>of</strong> the most culturally and l<strong>in</strong>guistically diverse <strong>in</strong> the worldand this is represented <strong>in</strong> the children surveyed for the AEDI. The number <strong>of</strong> Indigenous andchildren with a language background other than English (LBOTE*) by state and territory isprovided <strong>in</strong> Table 4.2. These groups are not mutually exclusive as shown <strong>in</strong> Table 4.2. Forexample, it is possible for children to be both Indigenous and have LBOTE status.Table 4.2: Indigenous and Language Background Other Than English (LBOTE*) childrenby state/territory (<strong>2012</strong>)<strong>Australia</strong> NSW VIC QLD WA SA TAS ACT NTIndigenous 15,490 4,988 946 4,513 2,207 827 472 117 1,420(5.3%) (5.3%) (1.4%) (7.3%) (6.9%) (4.4%) (7.3%) (2.4%) (40.9%)LBOTE* 3,070 230 32 950 591 258 4 12 993Non-LBOTE12,420 4,758 914 3,563 1,616 569 468 105 427274,483(94.7%)89,584(94.7%)66,985(98.6%)57,080(92.7%)29,951(93.1%)18,094(95.6%)5,958(92.7%)4,781(97.6%)2,050(59.1%)LBOTE* 52,419 23,758 14,278 5,599 4,422 2,750 258 950 404Non<strong>in</strong>digenousNon-LBOTETotalLBOTETotal Non-LBOTE222,064 65,826 52,707 51,481 25,529 15,344 5,700 3,831 1,64655,489(19.1%)234,484(80.9%)23,988(25.4%)70,584(74.6%)14,310(21.1%)53,621(78.9%)6,549(10.6%)55,044(89.4%)5,013(15.6%)27,145(84.4%)3,008(15.9%)15,913(84.1%)262(4.1%)6,168(95.9%)962(19.6%)3,936(80.4%)1,397(40.3%)2,073(59.7%)Total 298,973 94,572 67,931 61,593 32,158 18,921 6,430 4,898 3,470* See relevant def<strong>in</strong>ition <strong>of</strong> terms.4.2 Language diversity <strong>of</strong> <strong>Australia</strong>s childrenIndigenous childrenAcross <strong>Australia</strong>, teachers reported a total <strong>of</strong> 15,490 Indigenous children, which represents5.3 per cent <strong>of</strong> all children surveyed. Indigenous Cultural Consultants completed the AEDIChecklist collaboratively with the childs classroom teacher for 5,466 children (35.3 per cent<strong>of</strong> all Indigenous children surveyed).Indigenous Cultural Consultants were recruited from various pr<strong>of</strong>essions <strong>in</strong>clud<strong>in</strong>g Aborig<strong>in</strong>aland Islander education workers, Aborig<strong>in</strong>al early years liaison <strong>of</strong>ficers, Aborig<strong>in</strong>al education<strong>of</strong>ficers, Aborig<strong>in</strong>al education workers, Aborig<strong>in</strong>al and Islander education <strong>of</strong>ficers, Aborig<strong>in</strong>alteachers aides, assistant teachers, home liaison <strong>of</strong>ficers, <strong>in</strong>clusion support <strong>of</strong>ficers andliteracy support <strong>of</strong>ficers.Teachers reported that 3,070 Indigenous children (19.8 per cent <strong>of</strong> all Indigenous children)speak languages other than English <strong>in</strong> the home. There is diversity <strong>in</strong> the languages spokenby Indigenous children, with 109 different traditional languages to English reported. Of these83 traditional languages were reported as be<strong>in</strong>g the ma<strong>in</strong> language other than Englishspoken at home. An overview <strong>of</strong> the ma<strong>in</strong> languages other than English spoken byIndigenous children is provided <strong>in</strong> Table 4.3. The complete list <strong>of</strong> languages can be found atwww.aedi.org.au.31