A Snapshot of Early Childhood Development in Australia 2012
A Snapshot of Early Childhood Development in Australia 2012
A Snapshot of Early Childhood Development in Australia 2012

You also want an ePaper? Increase the reach of your titles
YUMPU automatically turns print PDFs into web optimized ePapers that Google loves.
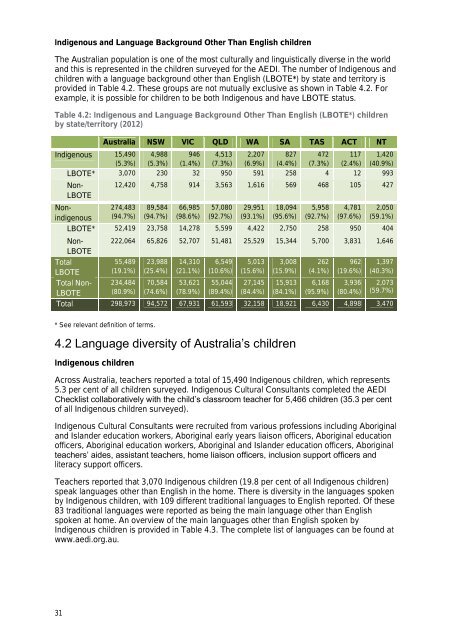
Indigenous and Language Background Other Than English childrenThe <strong>Australia</strong>n population is one <strong>of</strong> the most culturally and l<strong>in</strong>guistically diverse <strong>in</strong> the worldand this is represented <strong>in</strong> the children surveyed for the AEDI. The number <strong>of</strong> Indigenous andchildren with a language background other than English (LBOTE*) by state and territory isprovided <strong>in</strong> Table 4.2. These groups are not mutually exclusive as shown <strong>in</strong> Table 4.2. Forexample, it is possible for children to be both Indigenous and have LBOTE status.Table 4.2: Indigenous and Language Background Other Than English (LBOTE*) childrenby state/territory (<strong>2012</strong>)<strong>Australia</strong> NSW VIC QLD WA SA TAS ACT NTIndigenous 15,490 4,988 946 4,513 2,207 827 472 117 1,420(5.3%) (5.3%) (1.4%) (7.3%) (6.9%) (4.4%) (7.3%) (2.4%) (40.9%)LBOTE* 3,070 230 32 950 591 258 4 12 993Non-LBOTE12,420 4,758 914 3,563 1,616 569 468 105 427274,483(94.7%)89,584(94.7%)66,985(98.6%)57,080(92.7%)29,951(93.1%)18,094(95.6%)5,958(92.7%)4,781(97.6%)2,050(59.1%)LBOTE* 52,419 23,758 14,278 5,599 4,422 2,750 258 950 404Non<strong>in</strong>digenousNon-LBOTETotalLBOTETotal Non-LBOTE222,064 65,826 52,707 51,481 25,529 15,344 5,700 3,831 1,64655,489(19.1%)234,484(80.9%)23,988(25.4%)70,584(74.6%)14,310(21.1%)53,621(78.9%)6,549(10.6%)55,044(89.4%)5,013(15.6%)27,145(84.4%)3,008(15.9%)15,913(84.1%)262(4.1%)6,168(95.9%)962(19.6%)3,936(80.4%)1,397(40.3%)2,073(59.7%)Total 298,973 94,572 67,931 61,593 32,158 18,921 6,430 4,898 3,470* See relevant def<strong>in</strong>ition <strong>of</strong> terms.4.2 Language diversity <strong>of</strong> <strong>Australia</strong>s childrenIndigenous childrenAcross <strong>Australia</strong>, teachers reported a total <strong>of</strong> 15,490 Indigenous children, which represents5.3 per cent <strong>of</strong> all children surveyed. Indigenous Cultural Consultants completed the AEDIChecklist collaboratively with the childs classroom teacher for 5,466 children (35.3 per cent<strong>of</strong> all Indigenous children surveyed).Indigenous Cultural Consultants were recruited from various pr<strong>of</strong>essions <strong>in</strong>clud<strong>in</strong>g Aborig<strong>in</strong>aland Islander education workers, Aborig<strong>in</strong>al early years liaison <strong>of</strong>ficers, Aborig<strong>in</strong>al education<strong>of</strong>ficers, Aborig<strong>in</strong>al education workers, Aborig<strong>in</strong>al and Islander education <strong>of</strong>ficers, Aborig<strong>in</strong>alteachers aides, assistant teachers, home liaison <strong>of</strong>ficers, <strong>in</strong>clusion support <strong>of</strong>ficers andliteracy support <strong>of</strong>ficers.Teachers reported that 3,070 Indigenous children (19.8 per cent <strong>of</strong> all Indigenous children)speak languages other than English <strong>in</strong> the home. There is diversity <strong>in</strong> the languages spokenby Indigenous children, with 109 different traditional languages to English reported. Of these83 traditional languages were reported as be<strong>in</strong>g the ma<strong>in</strong> language other than Englishspoken at home. An overview <strong>of</strong> the ma<strong>in</strong> languages other than English spoken byIndigenous children is provided <strong>in</strong> Table 4.3. The complete list <strong>of</strong> languages can be found atwww.aedi.org.au.31