a description of the biographical characteristics of process
a description of the biographical characteristics of process
a description of the biographical characteristics of process

Create successful ePaper yourself
Turn your PDF publications into a flip-book with our unique Google optimized e-Paper software.
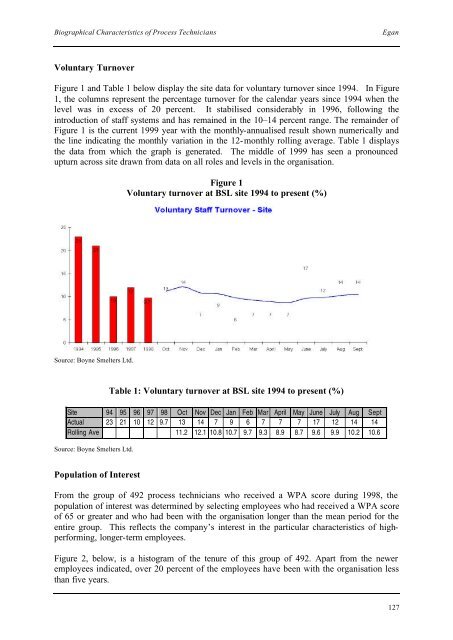
Biographical Characteristics <strong>of</strong> Process TechniciansEganVoluntary TurnoverFigure 1 and Table 1 below display <strong>the</strong> site data for voluntary turnover since 1994. In Figure1, <strong>the</strong> columns represent <strong>the</strong> percentage turnover for <strong>the</strong> calendar years since 1994 when <strong>the</strong>level was in excess <strong>of</strong> 20 percent. It stabilised considerably in 1996, following <strong>the</strong>introduction <strong>of</strong> staff systems and has remained in <strong>the</strong> 10–14 percent range. The remainder <strong>of</strong>Figure 1 is <strong>the</strong> current 1999 year with <strong>the</strong> monthly-annualised result shown numerically and<strong>the</strong> line indicating <strong>the</strong> monthly variation in <strong>the</strong> 12-monthly rolling average. Table 1 displays<strong>the</strong> data from which <strong>the</strong> graph is generated. The middle <strong>of</strong> 1999 has seen a pronouncedupturn across site drawn from data on all roles and levels in <strong>the</strong> organisation.Figure 1Voluntary turnover at BSL site 1994 to present (%)Source: Boyne Smelters Ltd.Table 1: Voluntary turnover at BSL site 1994 to present (%)Site 94 95 96 97 98 Oct Nov Dec Jan Feb Mar April May June July Aug SeptActual 23 21 10 12 9.7 13 14 7 9 6 7 7 7 17 12 14 14Rolling Ave 11.2 12.1 10.8 10.7 9.7 9.3 8.9 8.7 9.6 9.9 10.2 10.6Source: Boyne Smelters Ltd.Population <strong>of</strong> InterestFrom <strong>the</strong> group <strong>of</strong> 492 <strong>process</strong> technicians who received a WPA score during 1998, <strong>the</strong>population <strong>of</strong> interest was determined by selecting employees who had received a WPA score<strong>of</strong> 65 or greater and who had been with <strong>the</strong> organisation longer than <strong>the</strong> mean period for <strong>the</strong>entire group. This reflects <strong>the</strong> company’s interest in <strong>the</strong> particular <strong>characteristics</strong> <strong>of</strong> highperforming,longer-term employees.Figure 2, below, is a histogram <strong>of</strong> <strong>the</strong> tenure <strong>of</strong> this group <strong>of</strong> 492. Apart from <strong>the</strong> neweremployees indicated, over 20 percent <strong>of</strong> <strong>the</strong> employees have been with <strong>the</strong> organisation lessthan five years.127