MICRO AND SMALL ENTERPRISES IN LEBANON
MICRO AND SMALL ENTERPRISES IN LEBANON
MICRO AND SMALL ENTERPRISES IN LEBANON
You also want an ePaper? Increase the reach of your titles
YUMPU automatically turns print PDFs into web optimized ePapers that Google loves.
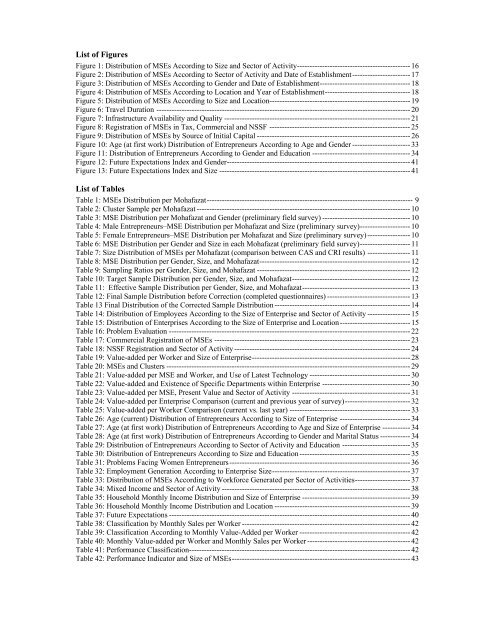
List of FiguresFigure 1: Distribution of MSEs According to Size and Sector of Activity--------------------------------------------- 16Figure 2: Distribution of MSEs According to Sector of Activity and Date of Establishment----------------------- 17Figure 3: Distribution of MSEs According to Gender and Date of Establishment------------------------------------ 18Figure 4: Distribution of MSEs According to Location and Year of Establishment---------------------------------- 18Figure 5: Distribution of MSEs According to Size and Location-------------------------------------------------------- 19Figure 6: Travel Duration ----------------------------------------------------------------------------------------------------- 20Figure 7: Infrastructure Availability and Quality -------------------------------------------------------------------------- 21Figure 8: Registration of MSEs in Tax, Commercial and NSSF -------------------------------------------------------- 25Figure 9: Distribution of MSEs by Source of Initial Capital ------------------------------------------------------------- 26Figure 10: Age (at first work) Distribution of Entrepreneurs According to Age and Gender ----------------------- 33Figure 11: Distribution of Entrepreneurs According to Gender and Education --------------------------------------- 34Figure 12: Future Expectations Index and Gender------------------------------------------------------------------------- 41Figure 13: Future Expectations Index and Size ---------------------------------------------------------------------------- 41List of TablesTable 1: MSEs Distribution per Mohafazat---------------------------------------------------------------------------------- 9Table 2: Cluster Sample per Mohafazat ------------------------------------------------------------------------------------- 10Table 3: MSE Distribution per Mohafazat and Gender (preliminary field survey) ----------------------------------- 10Table 4: Male Entrepreneurs–MSE Distribution per Mohafazat and Size (preliminary survey)-------------------- 10Table 5: Female Entrepreneurs–MSE Distribution per Mohafazat and Size (preliminary survey) ----------------- 10Table 6: MSE Distribution per Gender and Size in each Mohafazat (preliminary field survey)-------------------- 11Table 7: Size Distribution of MSEs per Mohafazat (comparison between CAS and CRI results) ----------------- 11Table 8: MSE Distribution per Gender, Size, and Mohafazat------------------------------------------------------------ 12Table 9: Sampling Ratios per Gender, Size, and Mohafazat ------------------------------------------------------------- 12Table 10: Target Sample Distribution per Gender, Size, and Mohafazat----------------------------------------------- 12Table 11: Effective Sample Distribution per Gender, Size, and Mohafazat------------------------------------------- 13Table 12: Final Sample Distribution before Correction (completed questionnaires) --------------------------------- 13Table 13 Final Distribution of the Corrected Sample Distribution------------------------------------------------------ 14Table 14: Distribution of Employees According to the Size of Enterprise and Sector of Activity ----------------- 15Table 15: Distribution of Enterprises According to the Size of Enterprise and Location---------------------------- 15Table 16: Problem Evaluation ------------------------------------------------------------------------------------------------ 22Table 17: Commercial Registration of MSEs ------------------------------------------------------------------------------ 23Table 18: NSSF Registration and Sector of Activity ---------------------------------------------------------------------- 24Table 19: Value-added per Worker and Size of Enterprise--------------------------------------------------------------- 28Table 20: MSEs and Clusters ------------------------------------------------------------------------------------------------- 29Table 21: Value-added per MSE and Worker, and Use of Latest Technology ---------------------------------------- 30Table 22: Value-added and Existence of Specific Departments within Enterprise ----------------------------------- 30Table 23: Value-added per MSE, Present Value and Sector of Activity ----------------------------------------------- 31Table 24: Value-added per Enterprise Comparison (current and previous year of survey)-------------------------- 32Table 25: Value-added per Worker Comparison (current vs. last year) ------------------------------------------------ 33Table 26: Age (current) Distribution of Entrepreneurs According to Size of Enterprise ---------------------------- 34Table 27: Age (at first work) Distribution of Entrepreneurs According to Age and Size of Enterprise ----------- 34Table 28: Age (at first work) Distribution of Entrepreneurs According to Gender and Marital Status ------------ 34Table 29: Distribution of Entrepreneurs According to Sector of Activity and Education --------------------------- 35Table 30: Distribution of Entrepreneurs According to Size and Education -------------------------------------------- 35Table 31: Problems Facing Women Entrepreneurs------------------------------------------------------------------------ 36Table 32: Employment Generation According to Enterprise Size------------------------------------------------------- 37Table 33: Distribution of MSEs According to Workforce Generated per Sector of Activities---------------------- 37Table 34: Mixed Income and Sector of Activity --------------------------------------------------------------------------- 38Table 35: Household Monthly Income Distribution and Size of Enterprise ------------------------------------------- 39Table 36: Household Monthly Income Distribution and Location ------------------------------------------------------ 39Table 37: Future Expectations ------------------------------------------------------------------------------------------------ 40Table 38: Classification by Monthly Sales per Worker ------------------------------------------------------------------- 42Table 39: Classification According to Monthly Value-Added per Worker -------------------------------------------- 42Table 40: Monthly Value-added per Worker and Monthly Sales per Worker ----------------------------------------- 42Table 41: Performance Classification---------------------------------------------------------------------------------------- 42Table 42: Performance Indicator and Size of MSEs----------------------------------------------------------------------- 43


