

MICRO AND SMALL ENTERPRISES IN LEBANON
MICRO AND SMALL ENTERPRISES IN LEBANON
MICRO AND SMALL ENTERPRISES IN LEBANON

You also want an ePaper? Increase the reach of your titles
YUMPU automatically turns print PDFs into web optimized ePapers that Google loves.
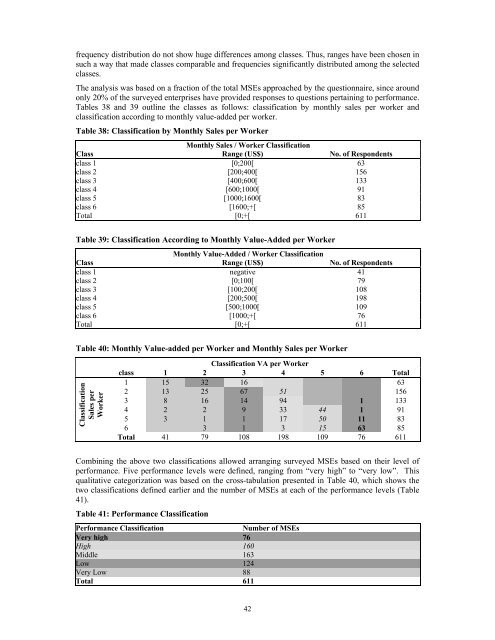
frequency distribution do not show huge differences among classes. Thus, ranges have been chosen insuch a way that made classes comparable and frequencies significantly distributed among the selectedclasses.The analysis was based on a fraction of the total MSEs approached by the questionnaire, since aroundonly 20% of the surveyed enterprises have provided responses to questions pertaining to performance.Tables 38 and 39 outline the classes as follows: classification by monthly sales per worker andclassification according to monthly value-added per worker.Table 38: Classification by Monthly Sales per WorkerMonthly Sales / Worker ClassificationClass Range (US$) No. of Respondentsclass 1 [0;200[ 63class 2 [200;400[ 156class 3 [400;600[ 133class 4 [600;1000[ 91class 5 [1000;1600[ 83class 6 [1600;+[ 85Total [0;+[ 611Table 39: Classification According to Monthly Value-Added per WorkerMonthly Value-Added / Worker ClassificationClass Range (US$) No. of Respondentsclass 1 negative 41class 2 [0;100[ 79class 3 [100;200[ 108class 4 [200;500[ 198class 5 [500;1000[ 109class 6 [1000;+[ 76Total [0;+[ 611Table 40: Monthly Value-added per Worker and Monthly Sales per WorkerClassificationSales perWorkerClassification VA per Workerclass 1 2 3 4 5 6 Total1 15 32 16 632 13 25 67 51 1563 8 16 14 94 1 1334 2 2 9 33 44 1 915 3 1 1 17 50 11 836 3 1 3 15 63 85Total 41 79 108 198 109 76 611Combining the above two classifications allowed arranging surveyed MSEs based on their level ofperformance. Five performance levels were defined, ranging from “very high” to “very low”. Thisqualitative categorization was based on the cross-tabulation presented in Table 40, which shows thetwo classifications defined earlier and the number of MSEs at each of the performance levels (Table41).Table 41: Performance ClassificationPerformance ClassificationNumber of MSEsVery high 76High 160Middle 163Low 124Very Low 88Total 61142


