

MICRO AND SMALL ENTERPRISES IN LEBANON
MICRO AND SMALL ENTERPRISES IN LEBANON
MICRO AND SMALL ENTERPRISES IN LEBANON

Create successful ePaper yourself
Turn your PDF publications into a flip-book with our unique Google optimized e-Paper software.
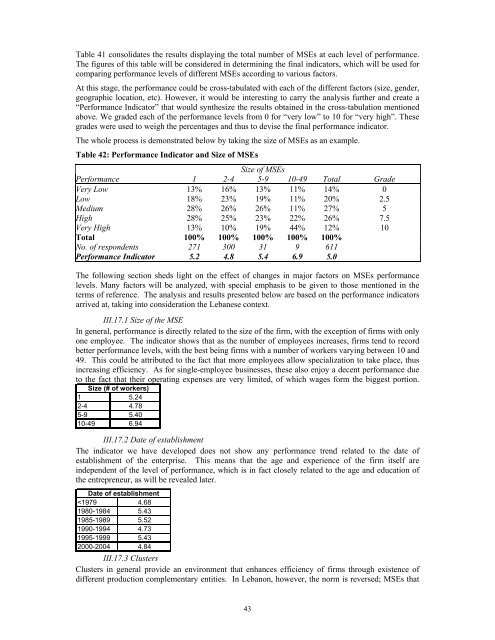
Table 41 consolidates the results displaying the total number of MSEs at each level of performance.The figures of this table will be considered in determining the final indicators, which will be used forcomparing performance levels of different MSEs according to various factors.At this stage, the performance could be cross-tabulated with each of the different factors (size, gender,geographic location, etc). However, it would be interesting to carry the analysis further and create a“Performance Indicator” that would synthesize the results obtained in the cross-tabulation mentionedabove. We graded each of the performance levels from 0 for “very low” to 10 for “very high”. Thesegrades were used to weigh the percentages and thus to devise the final performance indicator.The whole process is demonstrated below by taking the size of MSEs as an example.Table 42: Performance Indicator and Size of MSEsSize of MSEsPerformance 1 2-4 5-9 10-49 Total GradeVery Low 13% 16% 13% 11% 14% 0Low 18% 23% 19% 11% 20% 2.5Medium 28% 26% 26% 11% 27% 5High 28% 25% 23% 22% 26% 7.5Very High 13% 10% 19% 44% 12% 10Total 100% 100% 100% 100% 100%No. of respondents 271 300 31 9 611Performance Indicator 5.2 4.8 5.4 6.9 5.0The following section sheds light on the effect of changes in major factors on MSEs performancelevels. Many factors will be analyzed, with special emphasis to be given to those mentioned in theterms of reference. The analysis and results presented below are based on the performance indicatorsarrived at, taking into consideration the Lebanese context.III.17.1 Size of the MSEIn general, performance is directly related to the size of the firm, with the exception of firms with onlyone employee. The indicator shows that as the number of employees increases, firms tend to recordbetter performance levels, with the best being firms with a number of workers varying between 10 and49. This could be attributed to the fact that more employees allow specialization to take place, thusincreasing efficiency. As for single-employee businesses, these also enjoy a decent performance dueto the fact that their operating expenses are very limited, of which wages form the biggest portion.Size (# of workers)1 5.242-4 4.785-9 5.4010-49 6.94III.17.2 Date of establishmentThe indicator we have developed does not show any performance trend related to the date ofestablishment of the enterprise. This means that the age and experience of the firm itself areindependent of the level of performance, which is in fact closely related to the age and education ofthe entrepreneur, as will be revealed later.Date of establishment


