Background Information - Computer Science 101 - West Virginia ...
Background Information - Computer Science 101 - West Virginia ...
Background Information - Computer Science 101 - West Virginia ...

Create successful ePaper yourself
Turn your PDF publications into a flip-book with our unique Google optimized e-Paper software.
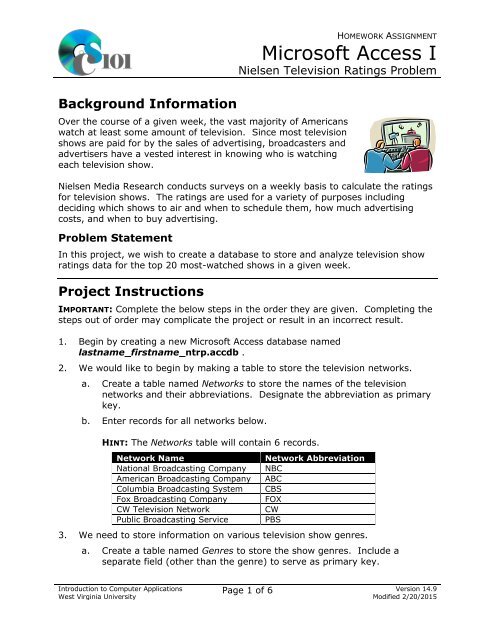
<strong>Background</strong> <strong>Information</strong>HOMEWORK ASSIGNMENTMicrosoft Access INielsen Television Ratings ProblemOver the course of a given week, the vast majority of Americanswatch at least some amount of television. Since most televisionshows are paid for by the sales of advertising, broadcasters andadvertisers have a vested interest in knowing who is watchingeach television show.Nielsen Media Research conducts surveys on a weekly basis to calculate the ratingsfor television shows. The ratings are used for a variety of purposes includingdeciding which shows to air and when to schedule them, how much advertisingcosts, and when to buy advertising.Problem StatementIn this project, we wish to create a database to store and analyze television showratings data for the top 20 most-watched shows in a given week.Project InstructionsIMPORTANT: Complete the below steps in the order they are given. Completing thesteps out of order may complicate the project or result in an incorrect result.1. Begin by creating a new Microsoft Access database namedlastname_firstname_ntrp.accdb .2. We would like to begin by making a table to store the television networks.a. Create a table named Networks to store the names of the televisionnetworks and their abbreviations. Designate the abbreviation as primarykey.b. Enter records for all networks below.HINT: The Networks table will contain 6 records.Network NameNational Broadcasting CompanyAmerican Broadcasting CompanyColumbia Broadcasting SystemFox Broadcasting CompanyCW Television NetworkPublic Broadcasting ServiceNetwork AbbreviationNBCABCCBSFOXCWPBS3. We need to store information on various television show genres.a. Create a table named Genres to store the show genres. Include aseparate field (other than the genre) to serve as primary key.Introduction to <strong>Computer</strong> Applications<strong>West</strong> <strong>Virginia</strong> UniversityPage 1 of 6 Version 14.9Modified 2/20/2015
HOMEWORK ASSIGNMENTMicrosoft Access INielsen Television Ratings Problemb. Enter records into the Genres table corresponding to the below genres.HINT: The Genres table will contain 6 records.ComedyDramaSportsRealityActionNews4. There is nothing to do for this step. Please proceed to the next step.5. To finish adding our dataset, we must store information about the shows.a. Create a table named Shows to store information on each of our shows(listed below under Step 5b). Some requirements for this table appearbelow.IMPORTANT: Completely define the Shows table before entering records.i. For the primary key, use an AutoNumber-type field to store an IDnumber.ii.Create a text field to store the abbreviation for the show’s network(e.g., “FOX” for the show Family Guy).iii.iv.For the network abbreviation, create a relationship to the primarykey of the Networks table to indicate which network airs each show.Enforce referential integrity and enable cascade updates, but do notenable cascade deletes.Provide a field to store the name of the television show.Using a lookup field to the Genres table, allow the user to specifythe show genre. The user should be able to select the full name ofthe genre (e.g., “Drama”) from the lookup field dropdown list.Enable data integrity, restricting deletes, on the relationship createdby the Lookup Wizard.v. Provide a fixed-type number field with 1 decimal place to store theshow’s rating.vi.vii.Provide a field formatted as a percentage with 1 decimal place tostore the show’s viewer share.Include a standard-type number field with no decimal places tostore the number of viewers.Introduction to <strong>Computer</strong> Applications<strong>West</strong> <strong>Virginia</strong> UniversityPage 2 of 6 Version 14.9Modified 2/20/2015
HOMEWORK ASSIGNMENTMicrosoft Access INielsen Television Ratings Problemviii. Create a lookup field that will allow us to specify the day that theshow aired. You must provide the possible values shown below:ix.◊◊◊◊◊◊◊SundayMondayTuesdayWednesdayThursdayFridaySaturdayCreate a date/time field to store the start time of the show.Represent the time in the medium time format (e.g., “10:22 PM”).b. Enter the below show data into your Shows table as appropriate. Thebelow information is from the week ending February 15, 2015 [1].HINT: The Shows table will contain 20 records.Ntwk Show Genre Rtng Share Viewers Day TimeNBC SNL: 40th Anniversary Comedy 12.5 20.0% 14,522,000 Sun 8:00pmCBS NCIS Drama 11.6 19.0% 13,506,000 Tue 8:00pmCBS NCIS: New Orleans Drama 10.1 16.0% 11,737,000 Tue 9:00pmFOX Empire Drama 7.4 12.0% 8,578,000 Wed 9:00pmCBS Blue Bloods Drama 7.3 14.0% 8,489,000 Fri 10:00pmCBS Scorpion Drama 7.2 11.0% 8,424,000 Mon 9:00pmCBS The Big Bang Theory Comedy 6.9 12.0% 8,088,000 Thu 8:00pmNBC SNL: 40th Red Carpet Reality 6.6 11.0% 7,638,000 Sun 7:00pmCBS NCIS: Los Angeles Drama 6.5 11.0% 7,512,000 Tue 9:00pmCBS 60 Minutes News 6.4 11.0% 7,446,000 Sun 7:00pmFOX American Idol Reality 6.3 11.0% 7,387,000 Wed 8:00pmCBS Hawaii Five-0 Drama 6.3 11.0% 7,286,000 Fri 9:00pmCBS Mom Comedy 6.3 10.0% 7,340,000 Thu 8:30pmABC Scandal Drama 6.3 10.0% 7,359,000 Thu 9:00pmCBS Criminal Minds Drama 6.2 10.0% 7,249,000 Wed 9:00pmCBS Person Of Interest Action 6.1 11.0% 7,154,000 Tue 10:00pmABC Modern Family Comedy 5.9 10.0% 6,883,000 Wed 9:00pmCBS Two And A Half Men Comedy 5.9 10.0% 6,905,000 Thu 9:00pmABC How To Get Away With Drama 5.8 10.0% 6,737,000 Thu 10:00pmMurderCBS Mike & Molly Comedy 5.8 9.0% 6,704,000 Mon 8:30pmIntroduction to <strong>Computer</strong> Applications<strong>West</strong> <strong>Virginia</strong> UniversityPage 3 of 6 Version 14.9Modified 2/20/2015
HOMEWORK ASSIGNMENTMicrosoft Access INielsen Television Ratings Problem6. Create separate queries to provide the information requested below. Nameeach query after the step in which it appears (e.g., name the query in Step 6aas Query6A ).HINT: Run your queries to test them. Make sure that they display all and onlythe records that you would expect to appear.a. Create a query that lists all show names, their full network name, fullgenre name, ratings, viewer shares, number of viewers, air day and airtime.Sort by ratings and then by viewer share, both in descending order.HINT: This query will show 20 records and 8 fields.b. Create a query that lists show names, their full network name, ratingsand the number of viewers.Only display shows with a rating of at least 5.0 but not more than 7.0.Sort by network and then by rating, both in ascending order.HINT: This query will show 14 records and 4 fields.c. Create a query that lists each genre name, the count of shows within thatgenre, and the total number of viewers for that genre.Your results must include all genres, even if they have no shows.Format the total number of viewers as a standard-type number with nodecimal places. Sort by the total number of viewers in descending order.HINT: This query will show 6 records and 3 fields.d. Create a query that displays each full network name and the average ofthe ratings for that network’s shows.Format the average rating as a fixed-type number with 2 decimal places.Sort by the full network name in ascending order.HINT: This query will show 4 records and 2 fields.Introduction to <strong>Computer</strong> Applications<strong>West</strong> <strong>Virginia</strong> UniversityPage 4 of 6 Version 14.9Modified 2/20/2015
HOMEWORK ASSIGNMENTMicrosoft Access INielsen Television Ratings Probleme. Create a query that lists all shows with their names, ratings, viewershares, and number of viewers. You must also create a calculated fieldthat estimates the total number of households watching, which can bedetermined from the rating value.You can calculate the number of households watching using the formula:([Shows. Rating] ∗ 1156000)Format the number of households as a standard-type number with nodecimal places. Sort by the number of viewers and then by the number ofhouseholds, both in descending order.HINT: This query will show 20 records and 5 fields.7. Using the Form Wizard, create a form with subform. The main form shoulddisplay the full network name. The subform must display a datasheet with allShows table fields.Name the main form NetworkData and the subform NetworkDataSubform .8. Using the Report Wizard, create a report to show the results of Query6A.Display all fields from the query.View by genre and sort by show name in ascending order. Use a steppedlayout and landscape page orientation. Name the report ShowSummary.Ensure the full widths of all columns are visible on the report.9. Create a table named AnalysisQuestions . This table will need to be able tostore which question is being answered and your answer to that question ineach record.Answer four of the five below questions, one question per record. Specificallyindicate the question you are answering for each record.a. How does Nielsen select the participants who track their viewing so thatthe ratings can be generated? Do you think the method used givesaccurate results for the number of viewers for the shows?b. In looking at the top 20 shows listed, only two of the shows aired onFriday and none were on Saturday. Why do you think this might be thecase?c. In addition to overall viewer figures, Nielsen tracks viewers by variousdemographics including age and gender. Why might one want to use thisdemographic information? For example, why might it matter if a showhas many female teenage viewers but few male viewers in their forties?Introduction to <strong>Computer</strong> Applications<strong>West</strong> <strong>Virginia</strong> UniversityPage 5 of 6 Version 14.9Modified 2/20/2015
HOMEWORK ASSIGNMENTMicrosoft Access INielsen Television Ratings Problemd. Four times a year, advertising rates are set based on ratings recordedduring “sweeps” periods. Do you think that measuring viewers just atcertain times of the year like this gives accurate overall results? Why orwhy not?e. Average television show ratings have been decreasing over time. Whatare some possible causes for this?10. Run the Compact and Repair Database utility on your database.Curriculum <strong>Information</strong>Project TypeMicrosoft Access databaseRelationship to GEC Objective 2In addition to providing basic research and data analysis skills, this assignmentallows students to explore the economics of mass media and how changingtechnologies can have a financial impact on advertising.Relationship to GEC Objective 4Most individuals watch at least some amount of television each week. Thisassignment helps expose students to how networks determine which shows remainon the air and how advertisers choose when to purchase advertising.Grading RubricThis project will be worth 50 points and will be graded based upon the followingcomponents. The instructor may adjust the below values as he or she feelsappropriate:Steps 2a-b 4 points total Steps 6a-e 3.5 points eachSteps 3a-b 4 points total Step 7 3 pointsStep 5a 5 points Step 8 3 pointsStep 5b 3.5 points Steps 9a-e (pick 4 of 5) 2.5 points eachReferences[1] D. Vasquez, “This week’s broadcast ratings,” Media Life Magazine, Feb. 18,2015. Available: http://www.medialifemagazine.com/this-weeks-broadcastratings/.Accessed: Feb. 20, 2015.Introduction to <strong>Computer</strong> Applications<strong>West</strong> <strong>Virginia</strong> UniversityPage 6 of 6 Version 14.9Modified 2/20/2015