Performance of Generating Plant - World Energy Council
Performance of Generating Plant - World Energy Council
Performance of Generating Plant - World Energy Council
Create successful ePaper yourself
Turn your PDF publications into a flip-book with our unique Google optimized e-Paper software.
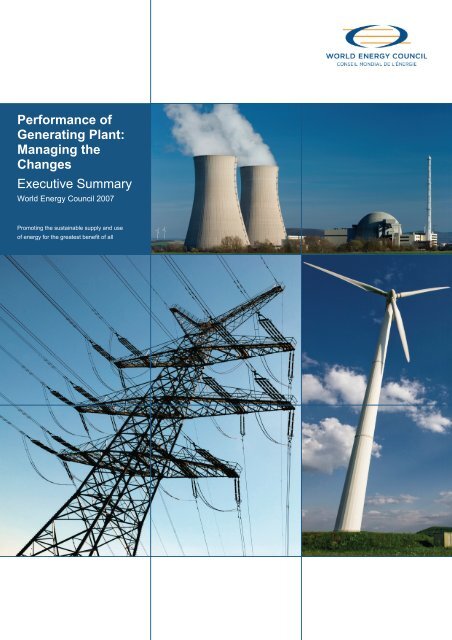
<strong>Performance</strong> <strong>of</strong><strong>Generating</strong> <strong>Plant</strong>:Managing theChangesExecutive Summary<strong>World</strong> <strong>Energy</strong> <strong>Council</strong> 2007Promoting the sustainable supply and use<strong>of</strong> energy for the greatest benefit <strong>of</strong> all
<strong>Performance</strong> <strong>of</strong><strong>Generating</strong> <strong>Plant</strong>:Managing the ChangesOfficers <strong>of</strong> the <strong>World</strong> <strong>Energy</strong> <strong>Council</strong>André CailléChair, <strong>World</strong> <strong>Energy</strong> <strong>Council</strong>Majid Al-MoneefVice Chair, Special Responsibility for Gulf States & Central AsiaFrancisco Barnés de CastroVice Chair, North AmericaAsger Bundgaard-JensenVice Chair, FinanceAlioune FallVice Chair, AfricaNorberto Franco de MedeirosVice Chair, Latin America/CaribbeanC.P. JainChair, Studies CommitteeYounghoon David KimVice Chair, Asia Pacific & South Asia<strong>Performance</strong> <strong>of</strong> <strong>Generating</strong> <strong>Plant</strong>: Managing the ChangesExecutive Summary<strong>World</strong> <strong>Energy</strong> <strong>Council</strong> 2007Copyright © 2007 <strong>World</strong> <strong>Energy</strong> <strong>Council</strong>All rights reserved. All or part <strong>of</strong> this publication may be used orreproduced as long as the following citation is included on eachcopy or transmission: ‘Used by permission <strong>of</strong> the <strong>World</strong> <strong>Energy</strong><strong>Council</strong>, London, www.worldenergy.orgPublished 2007 by:<strong>World</strong> <strong>Energy</strong> <strong>Council</strong>Regency House 1-4 Warwick StreetLondon W1B 5LT United KingdomISBN: 0 946121 31 1The full report is available on the <strong>World</strong> <strong>Energy</strong> <strong>Council</strong> websiteat www.worldenergy.org.Marie-José NadeauChair, Communications & Outreach CommitteeChicco TestaChair, Rome Congress 2007Johannes TeyssenVice Chair, EuropeElias Velasco GarciaChair, Special Responsibility for Investment in InfrastructureRon WoodChair, Programme CommitteeZhang GuobaoVice Chair, AsiaGerald DoucetSecretary General
2<strong>Performance</strong> <strong>of</strong> <strong>Generating</strong> <strong>Plant</strong>: Managing the Changes Executive Summary <strong>World</strong> <strong>Energy</strong> <strong>Council</strong> 2007market perspectives result in mixed goals,objectives, and priorities for power generatingutilities. Varying business models, varying riskpr<strong>of</strong>iles, and different “obligations to serve” allfurther complicate the issue.What are the key metrics? Technical?Commercial? Environmental? Or evensustainability? The Committee’s work suggeststhat all play a major role in measuring andimproving plant performance. As the globalpower markets continue to “evolve” worldwide,plant performance is becoming increasinglyimportant. However, areas <strong>of</strong> concern andmeans for measuring or reporting performanceare far from clear or consistent, and the situationis quite fragmented:• The fact that power markets andregulated frameworks co-exist essentiallyresults in a lack <strong>of</strong> standards or practicesfor measuring performance. There arelarge variations in structure and focuswithin the different markets globally.• The definition or scope <strong>of</strong> performancealso varies widely and can cover a range<strong>of</strong> issues including reliability/availability,capacity, efficiency, cost-effectiveness,environmental performance, and marketperformance (e.g. commercial availability,value/risk pr<strong>of</strong>ile, etc.).• Collection and analysis <strong>of</strong> performancedata is becoming a real challenge due tocompetitive pressures, variations inmarkets, technologies and costsstructures.• New drivers geared toward pr<strong>of</strong>itability,cost control, environmental stewardshipand market economics are shifting thefocus away from traditional measures <strong>of</strong>technical excellence such as availability,reliability, forced outage rate, and heatrate.In the future, shifts in generation mix will furtherimpact plant reliability and performance asdifferent technologies are introduced forenvironmental control and power generation.This will likely lead to a situation wheregeneration mix will simultaneously be impactedby further environmental controls applied toaging plant at the same time as different cleantechnologies (e.g. renewables, IGCC, CarbonCapture) are initially deployed.The continued assessment <strong>of</strong> the industry andits trends suggests that while “commercial”metrics are currently the best means foraddressing performance, specialised processesand tools are needed to support comparison <strong>of</strong>performance across facilities. Such capabilitiesare necessary to be able to relate commercial totechnical performance objectives.• For a generator within an evolving market,a means to consider what optimalperformance objectives should be, givencommercial realities, role <strong>of</strong> the plant inthe market, etc.• For comparison <strong>of</strong> performance <strong>of</strong>“similar” units across markets, whichallows to consider differences in value
<strong>Performance</strong> <strong>of</strong> <strong>Generating</strong> <strong>Plant</strong>: Managing the Changes Executive Summary <strong>World</strong> <strong>Energy</strong> <strong>Council</strong> 20073• associated with specific performancemetrics.• To provide means to investigate whetherit is possible to employ such analytics to“normalise” plant performance acrossmarkets to promote benchmarking andidentify “top <strong>of</strong> the class” performance.• Means to extend this framework toconsider other forms <strong>of</strong> metrics or indices.For example, significant new work isbeing undertaken for measuringenvironmental performance and/orsustainability metrics.To address this, the PGP Committee hasdeveloped a new computer-based tool toevaluate and compare plant performancemetrics. A series <strong>of</strong> case studies have beenconducted to illustrate how to better apply andleverage both peer group data as well as thebroader set <strong>of</strong> indicators. The model also fullydocuments and provides a basis <strong>of</strong> calculationsfor all major current performance indicators.Overview <strong>of</strong> the PGP Technical &Commercial <strong>Performance</strong> ModelThe model provides means to analyse manyfacilities, even for technologies that the userdoes not fully understand. It provides a mediumfor analysing and presenting a thoroughavailability and economic comparison for variousfacilities, technologies, markets, and obligations.It serves as an educational tool to facilitate thequick comparison <strong>of</strong> plants that are difficult tocompare side-by-side.How to leverage plant performance data?The PGP Committee has developed aTechnical & Commercial Power <strong>Plant</strong><strong>Performance</strong> Evaluation Model to help theevaluation process.The model allows comparing variousperformance metrics across the plants including:• Commercial Availability• Traditional Availability• Capacity• Capability• Revenue• Costs• Pr<strong>of</strong>itability (or Operating Margin)In order to attain these comparisons, there mustbe a simulation engine to model the systemsthat generates these comparison metrics. Withthis in mind, the following models for each planthave been integrated into the PGP model:• Market Model• Demand Model• Capacity Model• Availability Model• Financial ModelIf a comparison against a certain planttechnology is desired, but knowledge <strong>of</strong> this type<strong>of</strong> plant is limited, then the model facilitates thecomparison by providing a library <strong>of</strong> typicalplants from which to choose and populate the
4<strong>Performance</strong> <strong>of</strong> <strong>Generating</strong> <strong>Plant</strong>: Managing the Changes Executive Summary <strong>World</strong> <strong>Energy</strong> <strong>Council</strong> 2007Figure 1 Calculator modelling data flowSource: WECinputs. This makes it easier to quickly load plantdata for comparison and is particularly usefulwhen comparing against an unknowntechnology, or to speed up the input process, byeasily pre-populating the model with inputs froma similar technology, before refining data to theexact scenario desired.Figure 1 outlines the flow <strong>of</strong> information throughthe modelling tool. The first column contains theinputs necessary to feed the models. Thesecond column contains the models thatsimulate the plants and their markets. The thirdcolumn contains all comparisons that aregenerated to easily contrast the plants side-byside.<strong>Generating</strong> <strong>Plant</strong>Unavailability Factors andAvailability StatisticsThe evaluation <strong>of</strong> power plant performance isone <strong>of</strong> the most important tasks at any powerstation. Without its availability records, the plantstaff can not determine ways to improveperformance <strong>of</strong> the equipment and make theplant a pr<strong>of</strong>it-centre for the company. Thecauses <strong>of</strong> unavailability must be thoroughlyanalysed to identify the areas for performanceimprovement.The ScopeFor many years, the WEC PGP Committeecollected power plant availability statistics fromthe various countries as average indices forseveral groups <strong>of</strong> units. The resulting tablesprovided summary data for each groups but didnot allow analysts to examine where exactlytheir generating plants fit in the distributions <strong>of</strong>the unit population.Starting in 1994, PGP opened the datacollecting process to include unit-by unitinformation. In 2007 the new WEC PGPdatabase has been expanded to includeindividual unit design and performance indices.The design section <strong>of</strong> the database provides anumber <strong>of</strong> characteristics for filtering thecollected data into various groups based on theuser’s concepts <strong>of</strong> what constitutes a peer unit.In the old, historical database, there were datafor over 5,000 unit/years. Not all countries haveyet been able to enter their data into the newdatabase format. As the contents <strong>of</strong> the database grow further, the new unit-by-unit databasewill become a valid reference for an availabilityfactor expectation, particularly useful forcountries in the early stages <strong>of</strong> deploying gasturbine and combined cycle plant as part <strong>of</strong> theirpower systems.Historical data surveys focused on base-loadunits, since availability and unavailability factorswere not suitable for peaking plants. Forexample, a fossil-fuel plant operating at peakload for a limited number <strong>of</strong> hours during theyear, and spending the rest <strong>of</strong> time in reserve,excluding planned annual maintenance
<strong>Performance</strong> <strong>of</strong> <strong>Generating</strong> <strong>Plant</strong>: Managing the Changes Executive Summary <strong>World</strong> <strong>Energy</strong> <strong>Council</strong> 20075shutdowns, would show an availability level inthe order <strong>of</strong> 100%, which would not reflect thereal situation. Therefore, it was agreed,whenever possible, to exclude these types <strong>of</strong>installation from the statistics, along with theunits whose utilisation factor is less than 40%.The new unit-by-unit database allows alloperating units to report to it. The design andoperation filtering characteristics allow the usersto choose the operating parameters <strong>of</strong> unitsmost similar to their own. The new performanceindices expand the options to peaking, cycling orbase-loaded units. This new flexibility will allow abroader use <strong>of</strong> the database for comparingindividual unit performance to peer units.Table 1 Design features in the databaseType <strong>of</strong> unitsNo <strong>of</strong> DesignFeaturesFossil Steam Turbine 16Combined cycle/Co-generation10Combustion Turbines 5Hydro and Pumped Storage 6What the Future Holds In StoreThe benefits <strong>of</strong> the international crosscomparisonsystem henceforth depend - inaddition to the current practices described in thisreport - on the commitment <strong>of</strong> power plantoperators to enhance them. The underlying goalis to foster international support andparticipation.Key factors influencing plant performanceshould be identified and analysed to allow acost/benefit analysis <strong>of</strong> anyactivity/programme before itsimplementation.To analyse plant availability performance, theenergy losses/outages should be scrutinised toidentify the causes <strong>of</strong> unplanned or forcedenergy losses and to reduce the planned energylosses. Reducing planned outages increases thenumber <strong>of</strong> operating hours, decreases theplanned energy losses and therefore, increasesthe energy availability factor. Reducingunplanned outages leads to a safe and reliableoperation, and also reduces energy losses andincreases energy availability factor.The access to worldwide generating plantstatistics will help power plant operators with theavailability records <strong>of</strong> their plants to benchmarkthem in the context <strong>of</strong> global experience. News<strong>of</strong>tware for data collection and new, powerfuls<strong>of</strong>tware for analysing the results is nowavailable to bring the world electricity producerscloser together in a cooperative manner.The result will be beneficial exchange <strong>of</strong>information to improve the performance <strong>of</strong> powergenerating assets around the world and improvethe quality <strong>of</strong> life for many people.NuclearNuclear reactors have generated electricitysince 1954, and today nuclear energy is an
6<strong>Performance</strong> <strong>of</strong> <strong>Generating</strong> <strong>Plant</strong>: Managing the Changes Executive Summary <strong>World</strong> <strong>Energy</strong> <strong>Council</strong> 2007Figure 2 Reactor units by regionSource: IAEA-PRISM14012010080604020011301168Reactor units by region10 1928190 4122Europe - W Europe - E Asia - FE Asia - ME&S NorthAmerica1 06 2LatinAmericaAfricaIn operation Long-term shutdown Under constructionimportant part <strong>of</strong> the global energy mix. In 2006nuclear power supplied about 15.2% <strong>of</strong> theworld’s electricity. For over 50 years nuclearpower plants have accumulated 12,500 reactoryears<strong>of</strong> operating experience. The statisticspresented in this report are based on datacollected by the International Atomic <strong>Energy</strong>Agency (IAEA) for its Power Reactor InformationSystem (PRIS). The database system coverstwo kinds <strong>of</strong> data: general and designinformation on power reactors, and performancedata consisting <strong>of</strong> energy production, energyunavailability and outages.General and design information relates to allreactors that are in operation, underconstruction, or shutdown in the world.The PRIS can be used to assess nuclear powerperformance as it provides information on plantutilisation and planned and unplannedunavailability due to internal and externalcauses. Using detailed classification <strong>of</strong> energylosses and a comprehensive outage codingsystem, a set <strong>of</strong> internationally acceptedperformance indicators is calculated using thePRIS performance data. The indicators can beused for benchmarking, internationalcomparison or analysis <strong>of</strong> nuclear poweravailability and reliability from reactor specific,national or worldwide perspectives. Thisanalysis can be utilised in evaluation <strong>of</strong> nuclearpower competitiveness compared with otherpower sources.In October 2007, there were 439 operatingnuclear power plants (NPPs) around the worldtotalling 371.7 GWe <strong>of</strong> installed capacity. Inaddition there were also 5 operational units inlong-term shutdown with a total net capacity 2.8GWe. There also were 31 reactor units with atotal capacity 23.4 GWe under construction.The ten countries with the highest reliance onnuclear power in 2006 were: France, 78.1%;Lithuania, 72.3%, Slovakia, 57.2%, Belgium,54.4%; Sweden, 48.0%, Ukraine, 47.5%;Bulgaria, 43.6%, Armenia, 42.0%, Slovenia40.3% and Republic <strong>of</strong> Korea 38.6%.In North America, where 121 reactors supply19% <strong>of</strong> electricity in the United States and 16%in Canada, the number <strong>of</strong> operating reactors hasincreased in the last three years due to reconnection<strong>of</strong> two long-term shutdown reactorunits in Canada (Bruce-3 in 2004 and Pickering-1 in 2005) and one in USA (Browns Ferry-1 in2007).In Western Europe, with 130 reactors, overallcapacity has declined by 1966 GWe because <strong>of</strong>shutdown <strong>of</strong> 11 ageing reactor units. In Eastern
<strong>Performance</strong> <strong>of</strong> <strong>Generating</strong> <strong>Plant</strong>: Managing the Changes Executive Summary <strong>World</strong> <strong>Energy</strong> <strong>Council</strong> 20077Europe the same number <strong>of</strong> shutdowns and newgrid connections (4) resulted in unchangednumber <strong>of</strong> operating units (68). In Asia, with atotal <strong>of</strong> 111 reactors at present, the number <strong>of</strong>operating reactors has increased by 10 since thebeginning <strong>of</strong> 2004.Nuclear electricity production has beengrowing continuously since the nuclearindustry’s inception.From 1975 through 2006 global nuclearelectricity production increased from 326 to2,661TWh. Installed nuclear capacity rose from72 to 369.7GW(e) due to both new constructionand uprates at existing facilities.In 2006 the worldwide EAF (<strong>Energy</strong> AvailabilityFactor) was 83% on average. Half <strong>of</strong> nuclearreactors operated with EAF above 86% (worldwidemedian value). The top quarter <strong>of</strong> reactorsreached EAF above 91%. For comparison theglobal energy availability factor for NPPs was72% in 1990.The continuous increase in the EAF averagedaround 1% per year in the period 1990-2002 butsince 2002 this positive trend has stagnated atabout 83%.The average planned unavailability factor hasbeen decreasing continuously from about <strong>of</strong>20% at the beginning <strong>of</strong> the 1990s to 12% inrecent years. PHWR, BWR and PWR units haveachieved the best results.The improvement in the UnplannedUnavailability Factor (UUF) was alsosignificant. It decreased from about 8% to4% during the last 15 years. In 2006 themedian <strong>of</strong> UUF was 1.32%, but more than45% <strong>of</strong> reactors were operated with UUFlower than 1%.Nuclear plant operators are achieving highavailability through integrated operation andmaintenance programmes. These achievementsshow the efforts made by the nuclear industryfor a reliable and safe operation <strong>of</strong> nuclearpower plants. They also reflect the impact <strong>of</strong> deregulationand privatisation <strong>of</strong> the electricitymarket, which have affected all electricityproducers.The main factors contributing to improvementsin reactor availability are:• The elimination <strong>of</strong> unplanned energylosses through effective failure prevention(root cause analysis), on-line preventivemaintenance, timely indications <strong>of</strong>equipment degradation, and theimplementation <strong>of</strong> concurrent designimprovements.• The reduction <strong>of</strong> planned energy outagesthrough fuel cycle extensions, effectivemanagement <strong>of</strong> refuelling andmaintenance outages, and risk orientedmaintenance.• The continuing exchange anddissemination <strong>of</strong> operating experiences.
8<strong>Performance</strong> <strong>of</strong> <strong>Generating</strong> <strong>Plant</strong>: Managing the Changes Executive Summary <strong>World</strong> <strong>Energy</strong> <strong>Council</strong> 2007Figure 3 Wind power installed in 2006 (MW) – Top 12 countriesSource: Systémes Solaires – Observ’ERWind power installed in 2006 (MW) - Top 12 countries20000+12%175001500012500+16% +27%Added in 2006Installed in 20051000075005000250000 %GermanySpain USA India+37%+24% +47% +64% +35% +27%+27% - 2%DenmarkAdded in 2006 (MW) 2,233 1,587 2,454 1,619 11 417 631 673 439 336 767 -22Installed in 2005 (MW) 18,415 10,028 9,149 4,434 3,129 1,718 1,332 1,047 1,260 1,224 684 1,150ItalyUKPortugalChinaNetherlandsCanada Japan• Consolidation in the nuclear industry,which also means that more plants areoperated by those who do it best.Technical, Commercial andSociological Indicators forRenewable EnergiesWind energy: a dynamic sectorSince the early 1990s, wind power hasundergone a considerable level <strong>of</strong> development.In 1995, the total global installed wind powercapacity was 5,000MW. Ten years later, in2005, the installed capacity reached 59,200MW,including 11,700 MW added during the year (i.e.a growth rate <strong>of</strong> 25%). In 2006, the firststatistics show a total capacity <strong>of</strong> 72,600MW(13,400MW installed during the year, i.e. 23%growth rate).Germany is the leader with more than20,600MW installed in 2006 i.e. nearly one third<strong>of</strong> the world-wide wind power capacity, followedby Spain with 11,615MW, the United States with11,600MW, India with 6,050MW and Denmarkwith 3,140MW. These five countries accountedfor nearly 75% <strong>of</strong> the global capacity in 2006.Over the past two decades, the power outputand the size <strong>of</strong> wind turbines have beenincreasing significantly. This growth is nowslower for onshore turbines. Typical moderngrid-connected wind turbines have diameters <strong>of</strong>40 to 90 metres, towers <strong>of</strong> 50 to 100 metres highand are rated between 500kW and 3MW(average: 1.85MW in Germany in 2006).Their excellent technical availability isbetween 95 and 99%. However, theircapacity factor (ratio <strong>of</strong> the total actualenergy production over the potential energyproduction) is impaired by windintermittence, as wind availability variesbetween 20 and 30% for onshore; and up to40% for <strong>of</strong>fshore farms.Currently the most powerful turbine is rated at6MW with a rotor diameter <strong>of</strong> 115 metres and atower <strong>of</strong> 125 metres. The 3-6 MW wind turbinesare in fact mainly intended for <strong>of</strong>fshoreinstallations.Wind turbines are designed to work for some120,000 hours <strong>of</strong> operation throughout a lifetime<strong>of</strong> about 20 years. It is now technically feasibleto build wind turbines at water depths over 30metres and far <strong>of</strong>fshore.Nevertheless such installations are expensive,and most <strong>of</strong>fshore wind farms are located inshallower waters within 18km from shore. In2005, a new <strong>of</strong>fshore wind capacity <strong>of</strong> 900MWwas installed in the world.
<strong>Performance</strong> <strong>of</strong> <strong>Generating</strong> <strong>Plant</strong>: Managing the Changes Executive Summary <strong>World</strong> <strong>Energy</strong> <strong>Council</strong> 20079Figure 4 gCO 2 emitted per kWh (life cycle analysis)Source: JancovicigCO2 emitted per kWh (life cycle analysis)<strong>Energy</strong>gCO 2 emitted per kWh(life cycle analysis)Coal800 – 1050(different technologies)Gas 43060 – 150Photovoltaic(different manufacturing countries)Wind3 – 22(different manufacturing countries)Nuclear 6Hydraulic 41000800600400200min gCO2/kW hmax gCO2/kWhHydroNuclearWindPVGasCoal0Source: JancoviciDespite its positive image, wind energy hasseveral drawbacks:• Intermittence• Grid integration difficulties• Poor forecasts wind conditions• Visual impacts• Noise impacts• Other environmental impactsOffshore wind energy production is currentlymuch more expensive than onshore. Initialinvestment is 50 to 100% higher depending onsite (depth, distance from shore, type <strong>of</strong>substratum). O&M costs are also 50 to 100%higher depending on the site.The kWh cost for onshore production isestimated between 0.05 and 0.12€/kWhdepending on the turbine size and site, whereas<strong>of</strong>fshore production cost is estimated to liebetween 0.08 and 0.20€/kWh.Thus onshore wind energy production cancompete with coal, gas and nuclearelectricity and other energies which costbetween 0.03 and 0.06€/kWh, when externalcosts (impact on human health, ecosystemsand global warming) are not considered.Long-term wind electricity production potential isestimated at 4,500TWh per year, in other words27% <strong>of</strong> worldwide electricity production in 2003(16,570TWh). This is lower than for biomass(11,000TWh) and hydro (7,500TWh), andapproximately identical to solar energy (4,000 to4,400TWh).Photovoltaic <strong>Energy</strong>Over the past fifteen years, photovoltaic (PV)solar energy has demonstrated an exponentialgrowth. Once a leading-edge technology onlyused for satellites, PV cells are becoming moreaccessible day by day. In 1992, a capacity <strong>of</strong>110MWp was installed in the world. By the end<strong>of</strong> 2005, a cumulative installed capacity <strong>of</strong>4,640MWp was achieved with 1,460MWp addedduring last year, in other words an outstandinggrowth rate <strong>of</strong> 34%. Solar PV is the fastestgrowing power generation technology.However, counting and evaluating PV systemsis more difficult than counting and evaluatingalternatives, since they are smaller, numerous,<strong>of</strong>ten directly installed on scattered private ro<strong>of</strong>sand rarely assembled in an industrial plant.Historically, Japan was one <strong>of</strong> the first countriesto massively support PV energy, and this isreflected in its cumulative capacity <strong>of</strong> 1,430MWpin 2005, representing 31% <strong>of</strong> the worldwide PVenergy installations.
10<strong>Performance</strong> <strong>of</strong> <strong>Generating</strong> <strong>Plant</strong>: Managing the Changes Executive Summary <strong>World</strong> <strong>Energy</strong> <strong>Council</strong> 2007Table 2 Costs <strong>of</strong> different power plant typesSource: European Commission ExternE 1999, IEAType <strong>of</strong> plant Investment costs (€ /kW) Production costs (€ /MWh) External costs € /MWh)Nuclear 800-1,600 25 - 30 2.30–18.80Coal 800-1,200 30 - 35 19.00–99.00Gas 350-650 35 - 60 7.00–31.00Large Hydro ~2,000 30 - 65 0.04– 6.03Geothermal 1,400-1,700 50 - 80 0.20– 0.50Biomass 1,350-2,200 40 -110 2.00–50.00Wind (onshore) 900-1,300 50 -120 0.50– 2.60PV grid-connected 4,000-9,000 250 -650 1.40– 3.30Figure 5 Investment costs (in %)Investment Costs (in %)Element CostProject study 6 %Panels 51 %Support structure 7 %Inverter 8 %Cables 5 %Installation/start-up 23 %Source : IEACablesInstallationStart-upInverterSupportstructureProject studyPanelsOver the past two years, Germany has becomethe largest market, representing 58% <strong>of</strong> the newinstallations worldwide in 2005 and a cumulativecapacity <strong>of</strong> 1,910MWp in 2005 and 3,063MWpby the end <strong>of</strong> 2006. The United States is thethird largest market with 105MWp installed in2005 and a cumulative capacity <strong>of</strong> 465MWp. Farbehind Germany, Japan and the United States,come the two Asian Giants: India and China.PV energy depends on the energy delivered bythe sun, and thus on the day and time. At highnoon on a cloudless day at the equator, the sundelivers about 1kW/m² to the Earth’s surface.Nevertheless, this measure has to be correctedwhen accounting for clouds, latitudes andsunsets. Solar power is characterised by thesolar irradiance, which is the average number <strong>of</strong>kWh per m² per year (or day). Typical irradianceranges from 700 kWh/m²/year in northernregions (Northern Europe, Canada) to 2200kWh/m²/year in the sunniest areas (Africa,Southern Europe).Moreover, PV cells cannot fully convert sunpower: typical solar panels have an averageyield <strong>of</strong> 12%, with the best available panels atabout 20%. A production <strong>of</strong> about 1kWh per m²PV panel on average can be expected every dayin a good area after taking into account weather,latitude and yield.PV energy seems to be an ideal solution forproviding alternative electricity supply but hasseveral major drawbacks:• Intermittence• Grid integration difficulties
<strong>Performance</strong> <strong>of</strong> <strong>Generating</strong> <strong>Plant</strong>: Managing the Changes Executive Summary <strong>World</strong> <strong>Energy</strong> <strong>Council</strong> 200711• Weather dependence• Use <strong>of</strong> toxic materials for equipmentmanufacturingTheoretically solar energy has enormouspotential. The total amount <strong>of</strong> solar energyreaching the Earth’s surface is a thousand timesgreater than the world total energy consumption.This energy is not totally retrievable usingcurrent technologies, but the technical potentialfor converting solar energy directly into heat orelectricity is huge and expected to be more than440,000TWh/year, i.e. about three or four timesthe present total energy consumption <strong>of</strong> theworld.The long-term solar electricity productionpotential (assuming a reasonable required landarea) is estimated at 4,400TWh per year, i.e.more than 26% <strong>of</strong> the worldwide electricityproduction in 2003 (16,570TWh).PV energy certainly has significant potential forfuture growth throughout the world and is likelyto enjoy continuous development in comingdecades, in particular, since major technicalimprovements and cost reductions are stillexpected to take place. Developed countriesand probably China will significantly increasetheir installed capacity.Pioneer countries in this field, Japan andGermany, are also the most active in R&D andwill preserve this advantage for many years. PVenergy could be a really suitable solution fordeveloping countries that have much sunlight,but on its own will not be able to supportdevelopment in remote areas.Technical breakthroughs are expected and costswill certainly decrease thanks to important R&Defforts and widened production. Ultimately, PVenergy currently needs strong incentivemechanisms to accelerate its development, findnew markets and encourage technicalimprovements.BiomassBiomass is a renewable source <strong>of</strong> energy. Itincludes various organic materials, such aswood by-products and agricultural wastes, whichcan be used to produce energy.Long-neglected in favour <strong>of</strong> fossil fuels, biomasshas made a comeback in recent years. It cansubstitute for some fossil fuels for the chemicalindustry and energy (bi<strong>of</strong>uels for transport, heatand electricity). Electricity from biomass calledbioelectricity, has enjoyed strong development,in particular due to its use for co-generation. Abiomass plant can provide heat and electricity atthe same time.In 1998, 98.8TWh were produced from biomassthroughout the world. In 2005, the worldelectricity production from biomass reached183.4TWh.Biomass was the second largest renewableenergy sector with 5.6% <strong>of</strong> the total renewableelectricity in 2005, behind hydro power (89.5%)but ahead <strong>of</strong> wind energy (3.0%). However,
<strong>Performance</strong> <strong>of</strong> <strong>Generating</strong> <strong>Plant</strong>: Managing the Changes Executive Summary <strong>World</strong> <strong>Energy</strong> <strong>Council</strong> 200712Table 3 Land area required for different renewable power plantsSource: WEC and US DOE<strong>Energy</strong> source Wind Solar (PV) Biomass GeothermalLand area for a 1 GW plant100 km²but can be used foragricultural purposes30 km²but panels can beinstalled on ro<strong>of</strong>s5000 km² 200 km²biomass actually delivered only 1% <strong>of</strong> the globalelectricity, far behind fossil fuels (66.4%), largehydro (16.2%), and nuclear (15.2%).Europe and North America are the two leaderswith almost 75% <strong>of</strong> the global bioelectricityproduction ahead <strong>of</strong> Asia (about 18%) and Africawith only 0.2%.Wood and other biomass materials can beprocessed and used to generate electricity.There are three major transformations presentlyin use: combustion, gasification and pyrolysis <strong>of</strong>biomass.Combustion is the most common way <strong>of</strong>converting solid biomass fuels to energybecause <strong>of</strong> the low cost and high reliability.Gasification and pyrolysis are still underdevelopment but are generally expected tobecome more common in the future.Biomass is a part <strong>of</strong> the renewable energyportfolio and it can <strong>of</strong>fer an array <strong>of</strong> benefits:• No greenhouse gases during the life cycleand lower overall emissions than fossilfuelplants• Forest sustainability• <strong>Energy</strong> independence and regionalintegration• Proven technologies for combustion andco-firing• Use <strong>of</strong> low-cost productsBiomass systems are most <strong>of</strong>ten fuelled bywaste wood, from logging operations, forestthinning, low-grade wood or sawmill residues,which are far too frequently burnt in the openwithout pollution control. These systems createa commercial market for wood, while alsoboosting the forestry economy.Moreover, biomass cultivation can reduce therisk <strong>of</strong> wildfires by removing small diameter treesthat act as a fuel. It prevents harmful effects <strong>of</strong>forest fires on the atmosphere, including release<strong>of</strong> mercury, toxic materials, GHGs and NOx.Biomass conversion to electricity providessignificant benefits, but is also has several majordrawbacks:• Seasonal availability• Transport and processing• Emissions• Land area requirementThe land area that is required for exploitation bya biomass power plant is huge when comparedto other energies. Table 3 shows this land arearequired for exploitation <strong>of</strong> a 1GW renewableenergy plant (average values).Theoretically biomass energy has enormouspotential. The long-term biomass electricityproduction potential is estimated at 11,000TWhper year, i.e. more than 60% <strong>of</strong> the worldwideelectricity production in 2005 (18,140TWh). Thispotential is higher than that <strong>of</strong> other renewableenergies: hydro (7,500 TWh), wind energy(around 4,500 TWh), Solar energy (4,400 TWh).However, biomass must be divided amongst alluses (food, heating, electricity, bio-fuels).
<strong>Performance</strong> <strong>of</strong> <strong>Generating</strong> <strong>Plant</strong>: Managing the Changes Executive Summary <strong>World</strong> <strong>Energy</strong> <strong>Council</strong> 200713Technical advances are expected and shouldpromote a decrease in cost and diversifysolutions to adapt power plants to the feedstockand needs. However, biomass needs incentivemechanisms to accelerate its development, findnew markets and encourage technicalimprovements.Biomass is a relatively clean energy. It willcertainly be beneficial and can play a sizeablerole in GHG emission reduction. However, dueto its different uses – heat, electricity, bio-fuelsand especially food – and geographically limitedlocalisation, biomass electricity alone will beunable to supply the entire electricity needs.Markets & Risk ManagementStrategiesThis new PGP project was conducted by theWork Group on Markets and Risk ManagementStrategies which was set up to establish meansto determine the risks in power markets and themethods implemented to manage such risks.Cognisance is to be taken <strong>of</strong> the continuingchanging market environment while maintainingconfidentiality <strong>of</strong> the project participants.Objectives: Establish world wide participationreflected by the Work Group Members Identify those risks, uncertain futureevents, and the relevant markets thatcould influence the achievement <strong>of</strong> thepower plants objectives. Establish a categorisation standard forthese risks indicating opportunities forbenefit or threats to success Establishment <strong>of</strong> best practices for RiskManagement with regard to termination,tolerance or mitigation <strong>of</strong> each risk andthe use <strong>of</strong> flexibility, forward planning etc Establish a glossary <strong>of</strong> marketdevelopments that have created changesin risk to power plants. Establish methods for reviewing andreporting on risk tolerance and riskmanagement processesEnterprise Risk Management (ERM) is anintegral part <strong>of</strong> Good Corporate Governance andmanagement in general. Corporate Governanceis essentially about:• Promoting best business practice• Enhancing organisational performanceand well-being• Adding shareowner and stakeholder valueIt goes beyond pure structure to encompass allbusiness processes. It is therefore important tonote that corporate governance is not aboutindicating compliance to appropriate ‘rules’, butrather towards demonstrating that fundamentalgood business practice is alive and well ineverything the organization undertakes.
14<strong>Performance</strong> <strong>of</strong> <strong>Generating</strong> <strong>Plant</strong>: Managing the Changes Executive Summary <strong>World</strong> <strong>Energy</strong> <strong>Council</strong> 2007Figure 6 Spectrum <strong>of</strong> integrated risk managementSpectrum <strong>of</strong> Integrated Risk M anagem entEmergencyresponse planRoadm ap toRecovery TMRiskI.D .ReportRiskMngt.RiskEval.Stage 1Stage 2Crisis m anagem ent/communication planStage 3Businessrecovery planTimeRisk Identification& ManagementIncident M anagem entBusiness Continuity M anagem entThe thrust is therefore towards a pro-activeapproach to sustaining and enhancing businessperformance, rather than fire fighting anddefence in preventing corporate failures. Thisapproach focuses on a positive contribution.Therefore, corporate governance, and as suchalso enterprise or integrated risk management,includes opportunity management.Risk management is not an ‘add on’ activity,but an integral part <strong>of</strong> business managementwith the ultimate objective <strong>of</strong> minimising thevariability and unpredictability <strong>of</strong> expectedperformance outcomes.Risk Identification, Evaluation and Managementare therefore a process directed at decreasingthe likelihood <strong>of</strong> an unpredictable outcome, andalso the relative impact <strong>of</strong> an unpredictableevent, should it occur. Despite our best effortsthough, some events can be either beyond ourcontrol (floods or earth quakes) or cannot befully managed (fire).Such events require some form <strong>of</strong> predeterminedemergency processes and businessrecovery strategies, with the ultimate objective <strong>of</strong>re-establishing business capability within theshortest possible time and with minimum humancasualty, financial and sustainability impact onthe organisation and the environment. It istherefore advisable to clarify risk managementstrategy up front to ensure that the riskassessment and management process coverboth prevention / reduction <strong>of</strong> exposure andrecovery processes post an event. This is thepoint at which risk assessment and riskmanagement strategy can be brought togetherin the risk assessment model.When undertaking risk assessment, it is criticalto have a good understanding <strong>of</strong> the business aswell as the environment within which it operates.Some important lessons have been learnt fromoperational experience:• Most non-operational risks emanate fromthat interface and if not timely identifiedand managed, like during contractingphase, could result in significant exposureat a later stage when changes in theenvironment occur.• Operational risks are <strong>of</strong>ten seen as easyto manage, thus the amount <strong>of</strong> time spenton understanding the full systems impact<strong>of</strong> either the risk or the solution are <strong>of</strong>tentoo little, resulting in unintendedoutcomes.• Risk management is integral to any job. Itcannot be done by someone else.With the above in mind it is useful to identify socalled ‘flash points’ or ‘hot spots’ (areas <strong>of</strong>interface in the supply chain) from where it islikely that key risks may arise. Some examples<strong>of</strong> such flash points are:• Regulatory Interface• Suppliers• Fuel Delivery• Trading
<strong>Performance</strong> <strong>of</strong> <strong>Generating</strong> <strong>Plant</strong>: Managing the Changes Executive Summary <strong>World</strong> <strong>Energy</strong> <strong>Council</strong> 200715Figure 7 Operating environmentSocio Political EnvironmentCompetitionFuelSupplyTradingHigh VoltageSubstationsEng.ServicesShareholders& FinanciersGenerator-Assets-Operations-Maintenance-Engineering-Business SupportProcessesLegislative / Policy EnvironmentLowVoltageCustomersThe Triple Bottom Line – Dilemma oropportunity?Many a company has battled with the question<strong>of</strong> balancing Triple Bottom Line performance(i.e. the 3 elements <strong>of</strong> sustainability, i.e.economic, social and environmentalperformance). It is not the intention to resolvethis predicament here. However, somefundamental underlying truths are necessary toreflect on from an ERM perspective.The following depiction <strong>of</strong> the sustainabilitydilemma may be familiar:sustainability for both the environment and thecompany. It is only when one is sidetracked bythe pursuit <strong>of</strong> short-term pr<strong>of</strong>itability that it ishard to accept the need for such balance.Over the last 10 years massive strides havebeen made in the development <strong>of</strong> ERMprocesses.These developments have been captured invarious publications, and have also given rise tothe development <strong>of</strong> well-respected internationalstandards, e.g.:• Risk Management Standard byFederation for European RiskManagement Associations (FERMA)• Australian / New Zealand RiskManagement Standard 4360• British Standard on Business ContinuityManagement (PAS 52 and BS 25999)One is even tempted to say: “What is thequestion?” Is it not obvious that pr<strong>of</strong>itability is afunction <strong>of</strong> sustaining the environment thatenables the creation <strong>of</strong> wealth? Therefore, it isnot the one or the other, but rather how the onecan be used to grow the other.The move towards triple bottom line reportingstandards is driving the focus towards long-termThe work presented in the report is aligned tothese standards, as confirmed by variousworkgroup participants but represents a furthercustomisation specifically directed at applicationin energy utilities. As with all processes, it willcontinue to be further developed and refined,based on experience and new developments inthe discipline <strong>of</strong> Enterprise Risk Management.
Member Committees <strong>of</strong> the <strong>World</strong> <strong>Energy</strong> <strong>Council</strong>AlgeriaArgentinaAustraliaAustriaBangladeshBelgiumBotswanaBrazilBulgariaCameroonCanadaChinaColombiaCongo (Dem. Rep.)Côte d'IvoireCroatiaCzech Rep.DenmarkEgypt (Arab Rep.)EstoniaEthiopiaFinlandFranceGabonGeorgiaGermanyGhanaGreeceGuineaHong Kong ChinaHungaryIcelandIndiaIndonesiaIran (Islamic Rep.)IraqIrelandIsraelItalyJapanJordanKenyaKorea (Rep.)KuwaitLatviaLebanonLibya/GSPLAJLithuaniaLuxembourgMacedonia (Rep.)MaliMexicoMonacoMongoliaMoroccoNamibiaNepalNetherlandsNew ZealandNigerNigeriaNorwayPakistanParaguayPeruPhilippinesPolandPortugalQatarRomaniaRussian FederationSaudi ArabiaSenegalSerbiaSlovakiaSloveniaSouth AfricaSpainSri LankaSwazilandSwedenSwitzerlandSyria (Arab Rep.)TajikistanTaiwan ChinaTanzaniaThailandTrinidad & TobagoTunisiaTurkeyUkraineUnited KingdomUnited StatesUruguayYemen
<strong>World</strong> <strong>Energy</strong> <strong>Council</strong>Regency House 1-4 Warwick StreetLondon W1B 5LT United KingdomT (+44) 20 7734 5996F (+44) 20 7734 5926E info@worldenergy orgwww worldenergy orgPromoting the sustainable supply and use<strong>of</strong> energy for the greatest benefit <strong>of</strong> allISBN: 0 946121 31 1


