Delegated Aerial Ungulate Surveys 2009/2010 Survey Season
Delegated Aerial Ungulate Surveys 2009/2010 Survey Season
Delegated Aerial Ungulate Surveys 2009/2010 Survey Season

You also want an ePaper? Increase the reach of your titles
YUMPU automatically turns print PDFs into web optimized ePapers that Google loves.
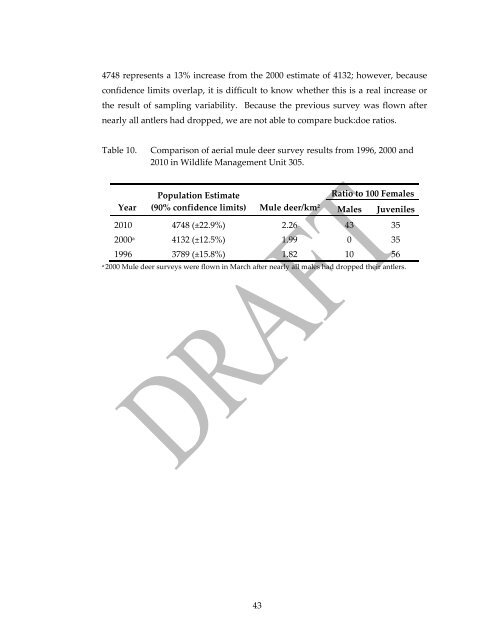
4748 represents a 13% increase from the 2000 estimate of 4132; however, becauseconfidence limits overlap, it is difficult to know whether this is a real increase orthe result of sampling variability. Because the previous survey was flown afternearly all antlers had dropped, we are not able to compare buck:doe ratios.Table 10.Comparison of aerial mule deer survey results from 1996, 2000 and<strong>2010</strong> in Wildlife Management Unit 305.YearPopulation EstimateRatio to 100 Females(90% confidence limits) Mule deer/km 2 Males Juveniles<strong>2010</strong> 4748 (±22.9%) 2.26 43 352000 a 4132 (±12.5%) 1.99 0 351996 3789 (±15.8%) 1.82 10 56a2000 Mule deer surveys were flown in March after nearly all males had dropped their antlers.43