1592M. VUILLEfur<strong>the</strong>r to <strong>the</strong> south (Figure 9(b)). This pressure gradient leads to enhanced upper-air easterlies,entrainment of easterly momentum <strong>over</strong> <strong>the</strong> Andean ridge, increased eastward upslope flow and moisturetransport from <strong>the</strong> interior of <strong>the</strong> continent towards <strong>the</strong> western <strong>Altiplano</strong> (Garreaud, 1999). Figure11(e–f) shows that HIGH index summers are indeed associated with negative zonal wind anomalies <strong>over</strong>major parts of <strong>the</strong> <strong>Altiplano</strong>, although significant only at <strong>the</strong> 200 hPa level. The opposite patterns emerges<strong>during</strong> LOW index periods when <strong>the</strong> zonal wind component is significantly higher than normal (westerlyanomalies) at <strong>the</strong> 200 hPa level <strong>over</strong> <strong>the</strong> <strong>Altiplano</strong>, <strong>the</strong> adjacent Pacific and <strong>the</strong> tropical lowlands to <strong>the</strong>nor<strong>the</strong>ast (Figure 11(c)). In <strong>the</strong> lower troposphere stronger easterly trade winds prevail <strong>during</strong> LOW in<strong>the</strong> western part of <strong>the</strong> Amazon basin (Figure 11(a)). In <strong>the</strong> rest of <strong>the</strong> study area, low-level windanomalies are insignificant in all composites. Interestingly <strong>the</strong> geopotential height and wind pattern <strong>during</strong>LOW+1 (Figure 9(c)) resembles <strong>the</strong> HIGH pattern (Figure 9(b)), although only one summer falls intoboth categories (1973–1974, see Table II). The similar pattern might explain why many post-El Niñoyears (LOW+1) tend to be ra<strong>the</strong>r wet, however, both wind and geopotential height anomalies <strong>during</strong><strong>the</strong>se years are insignificant <strong>over</strong> most parts of <strong>the</strong> <strong>Altiplano</strong> at both <strong>the</strong> 500 and 200 hPa levels (seeFigure 10(h–i) and Figure 11(h–i)).The temperature data (Figure 8(d)) show <strong>the</strong> typical characteristics of <strong>the</strong> Tropics <strong>during</strong> Pacific warmevents (e.g. Aceituno, 1988, 1989; Karoly, 1989; Kiladis and Diaz, 1989), featuring a significant increase<strong>during</strong> LOW as compared to HIGH. Associated with <strong>the</strong> warm and vertically expanded troposphere areincreased temperatures, although <strong>the</strong>ir significance varies widely. Only Lima shows significantly higher ElNiño-related temperatures throughout <strong>the</strong> troposphere. Over Antofagasta and La Paz, temperatures areonly significantly higher at <strong>the</strong> 200 hPa level and in <strong>the</strong> lower troposphere (Antofagasta 850 and 700 hPa),while Salta shows significantly higher temperatures at lower and mid-tropospheric levels (700 and 500hPa) but a reversed pattern at 300 hPa. The NCEP data confirm <strong>the</strong>se results, showing significant positive(negative) temperature anomalies <strong>during</strong> LOW (HIGH) <strong>over</strong> almost <strong>the</strong> entire study area at <strong>the</strong> 850, 500and 200 hPa level (Figure 12(a–f)). Again <strong>during</strong> LOW+1 temperature anomalies are insignificant in allof <strong>the</strong> study area (Figure 12(g–i)).Changes in specific humidity recorded <strong>over</strong> <strong>the</strong> four stations (Figure 8(e)) are <strong>the</strong> result of <strong>the</strong> windpattern presented above. As high humidity levels <strong>over</strong> <strong>the</strong> <strong>Altiplano</strong> are strictly tied to moisture influxfrom <strong>the</strong> east <strong>during</strong> austral summer, <strong>the</strong> increased westerly wind component <strong>during</strong> LOW index periodsresults in significantly lowered humidity values. Figure 8(e) shows <strong>the</strong> reduced specific humidity inmid-tropospheric levels with lower values <strong>over</strong> Lima (significant between 300 and 500 hPa), Salta(significant at 500 and 400 hPa) and La Paz (not significant) <strong>during</strong> LOW index phases. Only <strong>over</strong>Antofagasta and near <strong>the</strong> boundary layer (850 hPa level) humidity values are slightly increased <strong>during</strong>LOW. The water vapour flux computed from <strong>the</strong> NCEP data near and <strong>over</strong> <strong>the</strong> <strong>Altiplano</strong> confirms <strong>the</strong>seresults (Figure 13). As in Figure 5 <strong>the</strong> individual composites, ra<strong>the</strong>r than anomaly patterns are shown toFigure 9. 200 hPa NCEP reanalysis composites for wind field (m s −1 ) and geopotential height (gpm) in austral summer (DJF)<strong>during</strong>: (a) LOW; (b) HIGH; and (c) LOW+1 periodsCopyright © 1999 Royal Meteorological Society Int. J. Climatol. 19: 1579–1600 (1999)
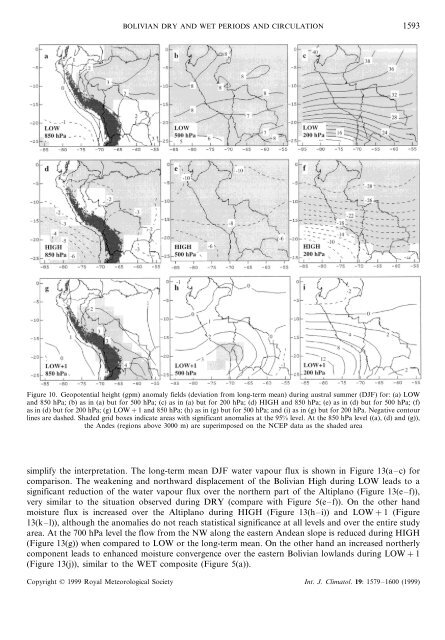
BOLIVIAN DRY AND WET PERIODS AND CIRCULATION 1593Figure 10. Geopotential height (gpm) anomaly fields (deviation from long-term mean) <strong>during</strong> austral summer (DJF) for: (a) LOWand 850 hPa; (b) as in (a) but for 500 hPa; (c) as in (a) but for 200 hPa; (d) HIGH and 850 hPa; (e) as in (d) but for 500 hPa; (f)as in (d) but for 200 hPa; (g) LOW+1 and 850 hPa; (h) as in (g) but for 500 hPa; and (i) as in (g) but for 200 hPa. Negative contourlines are dashed. Shaded grid boxes indicate areas with significant anomalies at <strong>the</strong> 95% level. At <strong>the</strong> 850 hPa level ((a), (d) and (g)),<strong>the</strong> Andes (regions above 3000 m) are superimposed on <strong>the</strong> NCEP data as <strong>the</strong> shaded areasimplify <strong>the</strong> interpretation. The long-term mean DJF water vapour flux is shown in Figure 13(a–c) forcomparison. The weakening and northward displacement of <strong>the</strong> <strong>Bolivian</strong> High <strong>during</strong> LOW leads to asignificant reduction of <strong>the</strong> water vapour flux <strong>over</strong> <strong>the</strong> nor<strong>the</strong>rn part of <strong>the</strong> <strong>Altiplano</strong> (Figure 13(e–f)),very similar to <strong>the</strong> situation observed <strong>during</strong> DRY (compare with Figure 5(e–f)). On <strong>the</strong> o<strong>the</strong>r handmoisture flux is increased <strong>over</strong> <strong>the</strong> <strong>Altiplano</strong> <strong>during</strong> HIGH (Figure 13(h–i)) and LOW+1 (Figure13(k–l)), although <strong>the</strong> anomalies do not reach statistical significance at all levels and <strong>over</strong> <strong>the</strong> entire studyarea. At <strong>the</strong> 700 hPa level <strong>the</strong> flow from <strong>the</strong> NW along <strong>the</strong> eastern Andean slope is reduced <strong>during</strong> HIGH(Figure 13(g)) when compared to LOW or <strong>the</strong> long-term mean. On <strong>the</strong> o<strong>the</strong>r hand an increased nor<strong>the</strong>rlycomponent leads to enhanced moisture convergence <strong>over</strong> <strong>the</strong> eastern <strong>Bolivian</strong> lowlands <strong>during</strong> LOW+1(Figure 13(j)), similar to <strong>the</strong> WET composite (Figure 5(a)).Copyright © 1999 Royal Meteorological Society Int. J. Climatol. 19: 1579–1600 (1999)