Atmospheric circulation over the Bolivian Altiplano during ... - CDAM
Atmospheric circulation over the Bolivian Altiplano during ... - CDAM
Atmospheric circulation over the Bolivian Altiplano during ... - CDAM

Create successful ePaper yourself
Turn your PDF publications into a flip-book with our unique Google optimized e-Paper software.
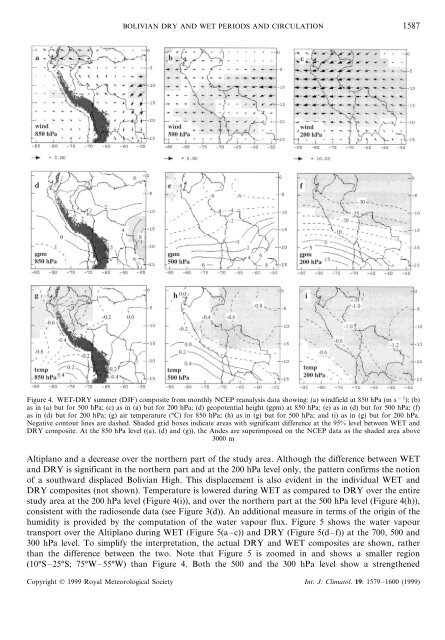
BOLIVIAN DRY AND WET PERIODS AND CIRCULATION 1587Figure 4. WET-DRY summer (DJF) composite from monthly NCEP reanalysis data showing: (a) windfield at 850 hPa (m s −1 ); (b)as in (a) but for 500 hPa; (c) as in (a) but for 200 hPa; (d) geopotential height (gpm) at 850 hPa; (e) as in (d) but for 500 hPa; (f)as in (d) but for 200 hPa; (g) air temperature (°C) for 850 hPa; (h) as in (g) but for 500 hPa; and (i) as in (g) but for 200 hPa.Negative contour lines are dashed. Shaded grid boxes indicate areas with significant difference at <strong>the</strong> 95% level between WET andDRY composite. At <strong>the</strong> 850 hPa level ((a), (d) and (g)), <strong>the</strong> Andes are superimposed on <strong>the</strong> NCEP data as <strong>the</strong> shaded area above3000 m<strong>Altiplano</strong> and a decrease <strong>over</strong> <strong>the</strong> nor<strong>the</strong>rn part of <strong>the</strong> study area. Although <strong>the</strong> difference between WETand DRY is significant in <strong>the</strong> nor<strong>the</strong>rn part and at <strong>the</strong> 200 hPa level only, <strong>the</strong> pattern confirms <strong>the</strong> notionof a southward displaced <strong>Bolivian</strong> High. This displacement is also evident in <strong>the</strong> individual WET andDRY composites (not shown). Temperature is lowered <strong>during</strong> WET as compared to DRY <strong>over</strong> <strong>the</strong> entirestudy area at <strong>the</strong> 200 hPa level (Figure 4(i)), and <strong>over</strong> <strong>the</strong> nor<strong>the</strong>rn part at <strong>the</strong> 500 hPa level (Figure 4(h)),consistent with <strong>the</strong> radiosonde data (see Figure 3(d)). An additional measure in terms of <strong>the</strong> origin of <strong>the</strong>humidity is provided by <strong>the</strong> computation of <strong>the</strong> water vapour flux. Figure 5 shows <strong>the</strong> water vapourtransport <strong>over</strong> <strong>the</strong> <strong>Altiplano</strong> <strong>during</strong> WET (Figure 5(a–c)) and DRY (Figure 5(d–f)) at <strong>the</strong> 700, 500 and300 hPa level. To simplify <strong>the</strong> interpretation, <strong>the</strong> actual DRY and WET composites are shown, ra<strong>the</strong>rthan <strong>the</strong> difference between <strong>the</strong> two. Note that Figure 5 is zoomed in and shows a smaller region(10°S–25°S; 75°W–55°W) than Figure 4. Both <strong>the</strong> 500 and <strong>the</strong> 300 hPa level show a streng<strong>the</strong>nedCopyright © 1999 Royal Meteorological Society Int. J. Climatol. 19: 1579–1600 (1999)