(Wessex) Technology Assessment ChromoQuant⢠(version 1)
(Wessex) Technology Assessment ChromoQuant⢠(version 1)
(Wessex) Technology Assessment ChromoQuant⢠(version 1)

Create successful ePaper yourself
Turn your PDF publications into a flip-book with our unique Google optimized e-Paper software.
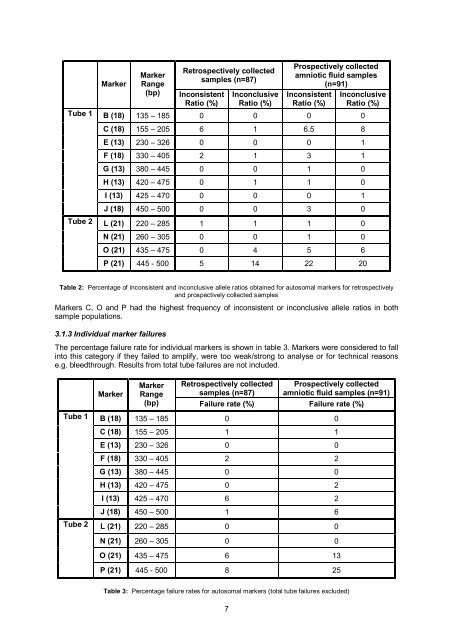
Tube 1Tube 2MarkerMarkerRange(bp)Retrospectively collectedsamples (n=87)InconsistentRatio (%)InconclusiveRatio (%)Prospectively collectedamniotic fluid samples(n=91)InconsistentRatio (%)InconclusiveRatio (%)B (18) 135 – 185 0 0 0 0C (18) 155 – 205 6 1 6.5 8E (13) 230 – 326 0 0 0 1F (18) 330 – 405 2 1 3 1G (13) 380 – 445 0 0 1 0H (13) 420 – 475 0 1 1 0I (13) 425 – 470 0 0 0 1J (18) 450 – 500 0 0 3 0L (21) 220 – 285 1 1 1 0N (21) 260 – 305 0 0 1 0O (21) 435 – 475 0 4 5 6P (21) 445 500 5 14 22 20Table 2: Percentage of inconsistent and inconclusive allele ratios obtained for autosomal markers for retrospectivelyand prospectively collected samplesMarkers C, O and P had the highest frequency of inconsistent or inconclusive allele ratios in bothsample populations.3.1.3 Individual marker failuresThe percentage failure rate for individual markers is shown in table 3. Markers were considered to fallinto this category if they failed to amplify, were too weak/strong to analyse or for technical reasonse.g. bleedthrough. Results from total tube failures are not included.Tube 1Tube 2MarkerMarker Retrospectively collected Prospectively collectedRange samples (n=87) amniotic fluid samples (n=91)(bp) Failure rate (%) Failure rate (%)B (18) 135 – 185 0 0C (18) 155 – 205 1 1E (13) 230 – 326 0 0F (18) 330 – 405 2 2G (13) 380 – 445 0 0H (13) 420 – 475 0 2I (13) 425 – 470 6 2J (18) 450 – 500 1 6L (21) 220 – 285 0 0N (21) 260 – 305 0 0O (21) 435 – 475 6 13P (21) 445 500 8 25Table 3: Percentage failure rates for autosomal markers (total tube failures excluded)7