

eccentric planets
eccentric planets
eccentric planets

You also want an ePaper? Increase the reach of your titles
YUMPU automatically turns print PDFs into web optimized ePapers that Google loves.
or stems directly from 35% rms uncertainty<br />
the KIC, which propagates directly to 35%<br />
in Rp. We assumed a central transit over<br />
ar diameter in equation (2). For randomly<br />
Planet Occurrence from Kepler 9<br />
Planet Occurrence ! d<br />
0.001 0.002 0.004 0.0079 0.016 0.032 0.063 0.13 0.25 0.50 1.0<br />
2 ransiting orientations, the f/dlogP/dlogR average duration<br />
p<br />
π/4 times the duration of a central transit.<br />
0.000035 0.00007 0.00014 0.00028 0.00056 0.0011 0.0022 0.0044 0.0088 0.018 0.035<br />
rrection reduces our Planet Occurrence SNR! in fcell equation (1) by<br />
32<br />
π/4, i.e. a true signal-to-noise ratio threshtead<br />
of 10.0. This is still a very conservative<br />
1 (9) 0.0042<br />
1 (15) 0.0075<br />
1 (52) 0.026<br />
58036 0.00015<br />
58030 0.00026<br />
58020 0.00090<br />
16 reshold. Additionally, our method does not<br />
2 (11) 0.0054 4 (39) 0.019 6 (69) 0.034 1 (15) 0.0071 1 (28) 0.014 1 (25) 0.012 3 (168) 0.082<br />
58031 0.00019 58028 0.00067 58022 0.0012 58017 0.00025 58009 0.00049 58004 0.00043 57997 0.0029<br />
the small fraction of transits that are graz-<br />
e reduced 1 (2) 0.0010 significance. 1 (6) 0.0029 4 (34) 0.017 3 (25) 0.012 1 (15) We 0.0076 3 (70) assumed 0.034 4 (154) 0.076 perfect<br />
58018 0.00004 58009 0.00010 58004 0.00058 57998 0.00043 57988 0.00027 57981 0.0012 57963 0.0026<br />
8<br />
r σCDPP values computed for 3 hr intervals.<br />
Planet Radius, R p (R E)<br />
1 (6) 0.0029 1 (9) 0.0044 7 (73) 0.036 4 (74) 0.037 2 (31) 0.015 4 (160) 0.079 5 (278) 0.14<br />
57982 0.00010 57967 0.00015 57942 0.0012 57903 0.0013 57859 0.00053 57804 0.0028 57738 0.0048<br />
derestimate σCDPP for a 6 hr interval (ap-<br />
1 (4) 0.0021<br />
4 (45) 0.022 2 (18) 0.0087 4 (60) 0.030 5 (153) 0.076 6 (208) 0.10 5 (198) 0.099<br />
57907 0.00007<br />
57808 0.00078 57749 0.00030 57653 0.0010 57538 0.0027 57429 0.0036 57240 0.0035<br />
the duration 4 of a P = 50 day transit) by<br />
3 (20) 0.010 9 (104) 0.052 21 (353) 0.18 23 (607) 0.31 16 (591) 0.30 17 (799) 0.43<br />
se are minor corrections 57442 0.00035 57262 0.0018 57001 0.0062 and 56605 0.011 affect 55834 0.011 54371 the 0.015 nu-<br />
denominator of equation (2) nearly equally.<br />
2<br />
3 (21)<br />
56665<br />
0.011 7 (64)<br />
0.00037 55966<br />
0.032 21 (269)<br />
0.0011 54585<br />
0.15 31 (521)<br />
0.0051 52260<br />
0.30 36 (893)<br />
0.010 48639<br />
0.53 34 (1101)<br />
0.019 43318<br />
0.79 18 (749)<br />
0.028 36296<br />
1 (5) 0.0026 3 (17) 0.012 11 (85) 0.060 19 (262) 0.22 11 (159) 0.16 16 (375) 0.43 12 (410) 0.83 7 (295) 0.76<br />
urrence 52618 as 0.00009 49170 a 0.00042 Function 44059 0.0021 37278 0.0079 29498 of 0.0056 Planet 21606 0.015 14712 Radius<br />
0.029 9157 0.027<br />
0.61<br />
0.021<br />
Number o<br />
Kepler<br />
0.001<br />
results<br />
Number of Planets per Star with P < 50 days<br />
1.0 1.4 2.0 2.8 4.0 5.7 8.0 11.3 16.0 22.6<br />
Planet Radius (RE) 3 (10) 0.0075 1 (10) 0.011 4 (50) 0.067 6 (59) 0.22 1 (18) 0.062 3 (85) 0.81 2 (41) 0.95<br />
1 30446 0.00026 22540 0.00040 15445 0.0023 9764 0.0077 5784 0.0022 3170 0.028 1605 0.033<br />
0.68 1.2 2.0 3.4 5.9 10 17 29 50<br />
Orbital Period, P (days)<br />
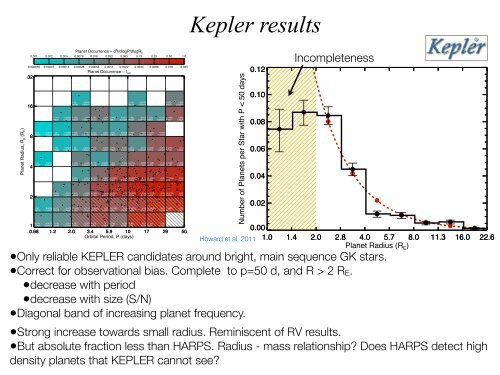
Fig. 4.— Planet occurrence as a function of planet radius and orbital period for P 10 are shown as black dots. The phase space is divided into a grid of logarithmically spaced cells within which planet occurrence<br />
is computed. Only stars in the “solar subset” (see selection criteria in Table 1) were used to compute occurrence. Cell color indicates<br />
planet occurrence with the color scale on the top in two sets of units,occurrencepercellandoccurrenceperlogarithmicarea unit. White<br />
cells contain no detected <strong>planets</strong>. Planet occurrence measurements are incomplete and likely contain systematic errors inthehatched<br />
region (Rp < 2 R⊕). Annotations in white text within each cell list occurrence statistics: upper left—the number of detected <strong>planets</strong><br />
with SNR > 10, npl,cell, andinparenthesesthenumberofaugmented<strong>planets</strong>correcting for non-transiting geometries, npl,aug,cell; lower<br />
left—the number of stars surveyed by Kepler around which a hypothetical transiting planet with Rp and P values from the middle of the<br />
cell could be detected with SNR > 10; lower right—fcell, planetoccurrence,correctedforgeometryanddetectionincompleteness; upper<br />
right—d2 urrence varies by three orders of magnitude<br />
0.00<br />
s-period plane (Figure 4). To isolate the de- Howard et al. 2011<br />
these parameters, we first considered planet<br />
Planet Radius (RE) s•Only a function reliable of planet KEPLER radius, candidates marginalizing around bright, main sequence GK stars.<br />
ets f/dlog10 P/dlog10 Rp, planetoccurrenceperlogarithmicareaunit(dlog10 P dlog10 Rp =28.5gridcells).<br />
•Correct with P for < observational 50 days. We computed bias. Complete oc- to p=50 d, and R > 2 RE.<br />
ng equation (2)<br />
•decrease with<br />
for cells<br />
period<br />
with the ranges of<br />
re 4 but for all periods less than 50 days.<br />
valent •decrease to summing with the size occurrence (S/N) values in<br />
ng•Diagonal rows of cells band to obtain of increasing the occurrence planet frequency. for<br />
n a radius interval with P < 50 days. The<br />
tribution •Strong<br />
of<br />
increase<br />
planet radii<br />
towards<br />
(Figure<br />
small<br />
5) increases<br />
radius. Reminiscent of RV results.<br />
with •But decreasing absolute fraction Rp. less than HARPS. Radius - mass relationship? Does HARPS detect high<br />
eddensity this distribution <strong>planets</strong> that of planet KEPLER occurrence cannot with see?<br />
0.12<br />
0.10<br />
0.08<br />
0.06<br />
0.04<br />
0.02<br />
Incompleteness<br />
1.0 1.4 2.0 2.8 4.0 5.7 8.0 11.3 16.0 22.6<br />
Fig. 5.— Planet occurrence as a function of planet radius for<br />
<strong>planets</strong> with P


