Understanding and Measuring Creative Thinking in Leaders
Understanding and Measuring Creative Thinking in Leaders
Understanding and Measuring Creative Thinking in Leaders

Create successful ePaper yourself
Turn your PDF publications into a flip-book with our unique Google optimized e-Paper software.
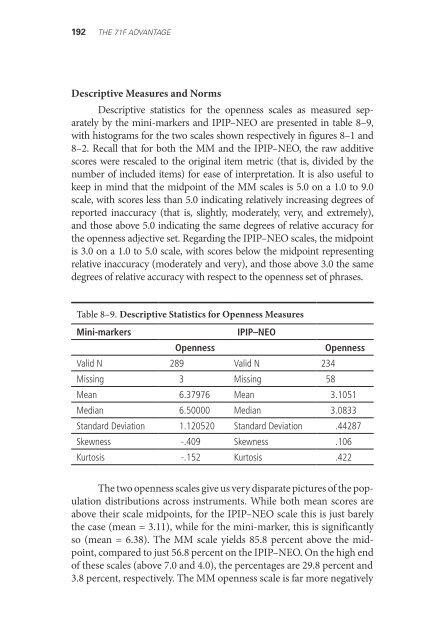
192 THE 71F ADVANTAGEDescriptive Measures <strong>and</strong> NormsDescriptive statistics for the openness scales as measured separatelyby the m<strong>in</strong>i-markers <strong>and</strong> IPIP–NEO are presented <strong>in</strong> table 8–9,with histograms for the two scales shown respectively <strong>in</strong> figures 8–1 <strong>and</strong>8–2. Recall that for both the MM <strong>and</strong> the IPIP–NEO, the raw additivescores were rescaled to the orig<strong>in</strong>al item metric (that is, divided by thenumber of <strong>in</strong>cluded items) for ease of <strong>in</strong>terpretation. It is also useful tokeep <strong>in</strong> m<strong>in</strong>d that the midpo<strong>in</strong>t of the MM scales is 5.0 on a 1.0 to 9.0scale, with scores less than 5.0 <strong>in</strong>dicat<strong>in</strong>g relatively <strong>in</strong>creas<strong>in</strong>g degrees ofreported <strong>in</strong>accuracy (that is, slightly, moderately, very, <strong>and</strong> extremely),<strong>and</strong> those above 5.0 <strong>in</strong>dicat<strong>in</strong>g the same degrees of relative accuracy forthe openness adjective set. Regard<strong>in</strong>g the IPIP–NEO scales, the midpo<strong>in</strong>tis 3.0 on a 1.0 to 5.0 scale, with scores below the midpo<strong>in</strong>t represent<strong>in</strong>grelative <strong>in</strong>accuracy (moderately <strong>and</strong> very), <strong>and</strong> those above 3.0 the samedegrees of relative accuracy with respect to the openness set of phrases.Table 8–9. Descriptive Statistics for Openness MeasuresM<strong>in</strong>i-markersIPIP–NEOOpennessOpennessValid N 289 Valid N 234Miss<strong>in</strong>g 3 Miss<strong>in</strong>g 58Mean 6.37976 Mean 3.1051Median 6.50000 Median 3.0833St<strong>and</strong>ard Deviation 1.120520 St<strong>and</strong>ard Deviation .44287Skewness -.409 Skewness .106Kurtosis -.152 Kurtosis .422The two openness scales give us very disparate pictures of the populationdistributions across <strong>in</strong>struments. While both mean scores areabove their scale midpo<strong>in</strong>ts, for the IPIP–NEO scale this is just barelythe case (mean = 3.11), while for the m<strong>in</strong>i-marker, this is significantlyso (mean = 6.38). The MM scale yields 85.8 percent above the midpo<strong>in</strong>t,compared to just 56.8 percent on the IPIP–NEO. On the high endof these scales (above 7.0 <strong>and</strong> 4.0), the percentages are 29.8 percent <strong>and</strong>3.8 percent, respectively. The MM openness scale is far more negatively