Petrogenesis of Ultramafic Xenoliths from the 1800 Kaupulehu Flow ...
Petrogenesis of Ultramafic Xenoliths from the 1800 Kaupulehu Flow ...
Petrogenesis of Ultramafic Xenoliths from the 1800 Kaupulehu Flow ...

Create successful ePaper yourself
Turn your PDF publications into a flip-book with our unique Google optimized e-Paper software.
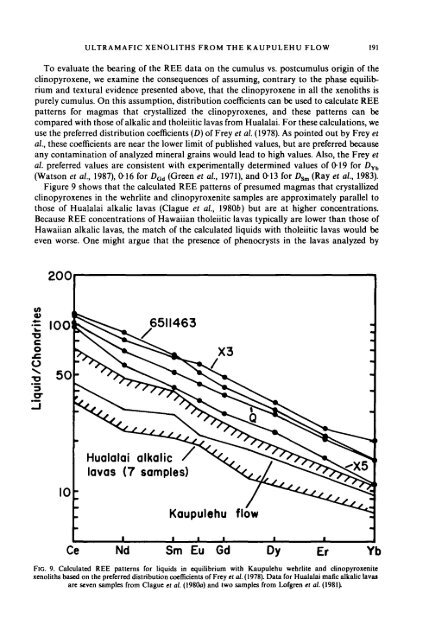
ULTRAMAFIC XENOLITHS FROM THE KAUPULEHU FLOW 191To evaluate <strong>the</strong> bearing <strong>of</strong> <strong>the</strong> REE data on <strong>the</strong> cumulus vs. postcumulus origin <strong>of</strong> <strong>the</strong>clinopyroxene, we examine <strong>the</strong> consequences <strong>of</strong> assuming, contrary to <strong>the</strong> phase equilibriumand textural evidence presented above, that <strong>the</strong> clinopyroxene in all <strong>the</strong> xenoliths ispurely cumulus. On this assumption, distribution coefficients can be used to calculate REEpatterns for magmas that crystallized <strong>the</strong> clinopyroxenes, and <strong>the</strong>se patterns can becompared with those <strong>of</strong> alkalic and tholeiitic lavas <strong>from</strong> Hualalai. For <strong>the</strong>se calculations, weuse <strong>the</strong> preferred distribution coefficients (D) <strong>of</strong> Frey et al. (1978). As pointed out by Frey etal, <strong>the</strong>se coefficients are near <strong>the</strong> lower limit <strong>of</strong> published values, but are preferred becauseany contamination <strong>of</strong> analyzed mineral grains would lead to high values. Also, <strong>the</strong> Frey etal. preferred values are consistent with experimentally determined values <strong>of</strong> 0-19 for D Yb(Watson et al, 1987), 0-16 for D Gd (Green et al, 1971), and 0-13 for D^ (Ray et al, 1983).Figure 9 shows that <strong>the</strong> calculated REE patterns <strong>of</strong> presumed magmas that crystallizedclinopyroxenes in <strong>the</strong> wehrlite and clinopyroxenite samples are approximately parallel tothose <strong>of</strong> Hualalai alkalic lavas (Clague et al, 19805) but are at higher concentrations.Because REE concentrations <strong>of</strong> Hawaiian tholeiitic lavas typically are lower than those <strong>of</strong>Hawaiian alkalic lavas, <strong>the</strong> match <strong>of</strong> <strong>the</strong> calculated liquids with tholeiitic lavas would beeven worse. One might argue that <strong>the</strong> presence <strong>of</strong> phenocrysts in <strong>the</strong> lavas analyzed by20010lavas (7 samples)<strong>Kaupulehu</strong> flowCe Nd Sm Eu Gd Dy Er YbFIG. 9. Calculated REE patterns for liquids in equilibrium with <strong>Kaupulehu</strong> wehrlite and clinopyroxenitexenoliths based on <strong>the</strong> preferred distribution coefficients <strong>of</strong> Frey et al. (1978). Data for Hualalai mafic alkalic lavasare seven samples <strong>from</strong> Clague et al. (1980a) and two samples <strong>from</strong> L<strong>of</strong>gren et al. (1981).