Uncertainty of the iodine-131 ingestion dose conversion factor
Uncertainty of the iodine-131 ingestion dose conversion factor
Uncertainty of the iodine-131 ingestion dose conversion factor

You also want an ePaper? Increase the reach of your titles
YUMPU automatically turns print PDFs into web optimized ePapers that Google loves.
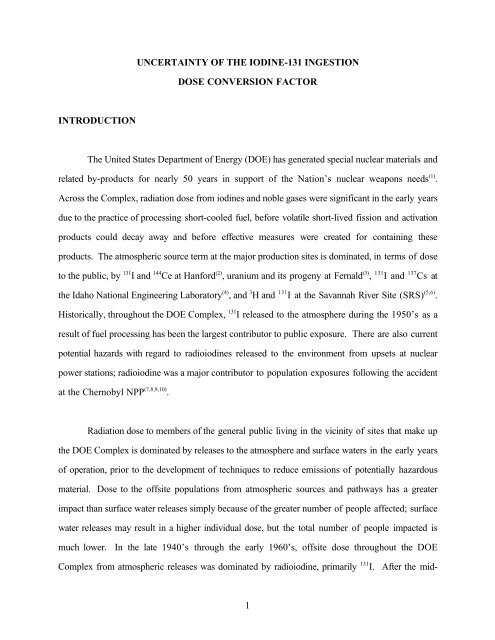
UNCERTAINTY OF THE IODINE-<strong>131</strong> INGESTIONDOSE CONVERSION FACTORINTRODUCTIONThe United States Department <strong>of</strong> Energy (DOE) has generated special nuclear materials andrelated by-products for nearly 50 years in support <strong>of</strong> <strong>the</strong> Nation’s nuclear weapons needs (1) .Across <strong>the</strong> Complex, radiation <strong>dose</strong> from <strong>iodine</strong>s and noble gases were significant in <strong>the</strong> early yearsdue to <strong>the</strong> practice <strong>of</strong> processing short-cooled fuel, before volatile short-lived fission and activationproducts could decay away and before effective measures were created for containing <strong>the</strong>seproducts. The atmospheric source term at <strong>the</strong> major production sites is dominated, in terms <strong>of</strong> <strong>dose</strong>to <strong>the</strong> public, by <strong>131</strong> I and 144 Ce at Hanford (2) , uranium and its progeny at Fernald (3) , <strong>131</strong> I and 137 Cs at<strong>the</strong> Idaho National Engineering Laboratory (4) , and 3 H and <strong>131</strong> I at <strong>the</strong> Savannah River Site (SRS) (5,6) .Historically, throughout <strong>the</strong> DOE Complex, <strong>131</strong> I released to <strong>the</strong> atmosphere during <strong>the</strong> 1950’s as aresult <strong>of</strong> fuel processing has been <strong>the</strong> largest contributor to public exposure. There are also currentpotential hazards with regard to radio<strong>iodine</strong>s released to <strong>the</strong> environment from upsets at nuclearpower stations; radio<strong>iodine</strong> was a major contributor to population exposures following <strong>the</strong> accidentat <strong>the</strong> Chernobyl NPP (7,8,9,10) .Radiation <strong>dose</strong> to members <strong>of</strong> <strong>the</strong> general public living in <strong>the</strong> vicinity <strong>of</strong> sites that make up<strong>the</strong> DOE Complex is dominated by releases to <strong>the</strong> atmosphere and surface waters in <strong>the</strong> early years<strong>of</strong> operation, prior to <strong>the</strong> development <strong>of</strong> techniques to reduce emissions <strong>of</strong> potentially hazardousmaterial. Dose to <strong>the</strong> <strong>of</strong>fsite populations from atmospheric sources and pathways has a greaterimpact than surface water releases simply because <strong>of</strong> <strong>the</strong> greater number <strong>of</strong> people affected; surfacewater releases may result in a higher individual <strong>dose</strong>, but <strong>the</strong> total number <strong>of</strong> people impacted ismuch lower. In <strong>the</strong> late 1940’s through <strong>the</strong> early 1960’s, <strong>of</strong>fsite <strong>dose</strong> throughout <strong>the</strong> DOEComplex from atmospheric releases was dominated by radio<strong>iodine</strong>, primarily <strong>131</strong> I. After <strong>the</strong> mid-1
1960’s, when fuel was cooled for longer periods before processing and when effective emissioncontrols were in place, various long-lived fission products began to dominate <strong>the</strong> annual <strong>dose</strong>estimates, but total <strong>dose</strong> was at least an order <strong>of</strong> magnitude lower and continued to decrease.Dose reconstruction efforts at DOE’s Hanford Site have shown that, for releases <strong>of</strong> <strong>131</strong> I, <strong>the</strong>consumption pathway accounts for more than 95% <strong>of</strong> total <strong>dose</strong> with milk consumption accountingfor 80% and beef, eggs, and fruit making up <strong>the</strong> additional 15% (11) . Uncertainties in <strong>the</strong> calculation<strong>of</strong> historical atmospheric concentrations <strong>of</strong> <strong>131</strong> I are on <strong>the</strong> order <strong>of</strong> a <strong>factor</strong> <strong>of</strong> 2 to 10 (12) , while <strong>the</strong>total reconstructed <strong>dose</strong> <strong>of</strong> <strong>131</strong> I is estimated to have a 90% confidence range <strong>of</strong> a <strong>factor</strong> <strong>of</strong> 15 for <strong>the</strong>maximum individual (2) . For a representative (average) individual at any given location, however,90% <strong>of</strong> <strong>the</strong> <strong>dose</strong> estimates are within a <strong>factor</strong> <strong>of</strong> 25 at Hanford (13) . Sensitivity analyses showed that<strong>the</strong> parameter to which <strong>the</strong> dosimetry models were consistently most sensitive was <strong>the</strong> <strong>iodine</strong> <strong>dose</strong><strong>conversion</strong> <strong>factor</strong> (DCF) (13) . This is not surprising since <strong>the</strong> DCF is very influential to <strong>dose</strong>estimates from all pathways, similar to that shown by Hamby (14) with <strong>the</strong> aggregated atmospherictritium model. Knowledge <strong>of</strong> <strong>the</strong> uncertainties related to <strong>the</strong> calculation <strong>of</strong> <strong>the</strong> <strong>131</strong> I <strong>ingestion</strong> DCF,<strong>the</strong>refore, will greatly improve our confidence in <strong>the</strong> <strong>dose</strong> reconstruction effort and <strong>the</strong> prediction <strong>of</strong><strong>the</strong> consequences related to radio<strong>iodine</strong> intake.METHODA probabilistic estimation <strong>of</strong> <strong>the</strong> <strong>131</strong> I adult <strong>ingestion</strong> <strong>dose</strong> <strong>conversion</strong> <strong>factor</strong> was generatedby multiple calculations <strong>of</strong> <strong>dose</strong> to <strong>the</strong> thyroid following a 1 Bq intake via <strong>ingestion</strong>. An Excel ®spreadsheet was written that contains modules for calculating <strong>the</strong> S-<strong>factor</strong>, <strong>the</strong> integrated activity in<strong>the</strong> thyroid, and <strong>the</strong> <strong>dose</strong> <strong>conversion</strong> <strong>factor</strong>. As an add-on to Excel, <strong>the</strong> Crystal Ball ® s<strong>of</strong>twarepackage was used to accumulate many iterations <strong>of</strong> <strong>the</strong> DCF calculation and to perform statisticalanalyses on input and output parameter values. The sections that follow present each <strong>of</strong> <strong>the</strong>calculational steps in more detail.2
Iodine metabolic modeling. Thyroid uptake and <strong>iodine</strong> metabolism involves extremely complexbiological systems. In modeling <strong>the</strong> metabolic transport <strong>of</strong> <strong>iodine</strong> through <strong>the</strong> body, manysimplifying assumptions have to be made. In addition to <strong>the</strong>se assumptions, <strong>the</strong> presence orabsence <strong>of</strong> dietary <strong>iodine</strong> plays a significant role in <strong>iodine</strong> metabolism and thyroid function. Thereis very little difference in metabolism rates between men and women, and, except during pregnancy,<strong>the</strong> concentration <strong>of</strong> hormonal <strong>iodine</strong> in <strong>the</strong> bloodstream remains fairly constant throughout life (16) .The uptake <strong>of</strong> <strong>iodine</strong> via <strong>the</strong> <strong>ingestion</strong> pathway occurs from <strong>the</strong> consumption <strong>of</strong> food andfluids. Iodine in <strong>the</strong>se substances is in an inorganic iodide form and is, <strong>the</strong>refore, absorbed in <strong>the</strong>bloodstream via all levels <strong>of</strong> <strong>the</strong> gastrointestinal tract (17) , primarily <strong>the</strong> intestine (16) . The rate <strong>of</strong>absorption by <strong>the</strong> GI tract is about 5% per minute (16) and virtually all ingested <strong>iodine</strong> is absorbed by<strong>the</strong> bloodstream (16,18) , with very little appearing in <strong>the</strong> feces (17) . Once in <strong>the</strong> bloodstream, <strong>iodine</strong> israpidly absorbed in <strong>the</strong> extracellular tissues <strong>of</strong> <strong>the</strong> body, with a large fraction, approximately 60-80%, being lost via <strong>the</strong> urine (16,17) . The majority <strong>of</strong> body <strong>iodine</strong> eventually flows through, and istrapped by, <strong>the</strong> thyroid or is excreted via <strong>the</strong> kidneys. A small amount is also removed from <strong>the</strong>bloodstream by <strong>the</strong> liver and excreted in feces (16) . Equilibrium <strong>of</strong> <strong>the</strong> total pool <strong>of</strong> <strong>iodine</strong> is achievedwithin several hours after intake, with <strong>iodine</strong> selectively concentrating in <strong>the</strong> thyroid, salivary, andgastric glands (16,17) .Iodine in <strong>the</strong> body is ei<strong>the</strong>r in <strong>the</strong> form <strong>of</strong> inorganic iodide or organic hormonal <strong>iodine</strong>.Iodide is converted to an organic state in <strong>the</strong> thyroid and remains in that state until reincorporatedinto <strong>the</strong> bloodstream, at which time it converts back to <strong>the</strong> inorganic form (16) . The inorganic phase<strong>of</strong> <strong>iodine</strong> in <strong>the</strong> body has a turn-over half-life <strong>of</strong> about 6-7 hours, and <strong>the</strong> organic phase <strong>of</strong> <strong>iodine</strong>turns over with a half-life <strong>of</strong> approximately 9.5 days (17) .3
The uptake <strong>of</strong> <strong>iodine</strong> by <strong>the</strong> thyroid is directly correlated to thyroid mass (19) and decreasesonly slightly with increasing age (16) . Both mass and uptake fraction vary with dietary intakes <strong>of</strong><strong>iodine</strong>, increasing with low intakes and decreasing with high intakes (19) . The size <strong>of</strong> <strong>the</strong> thyroid, andthus, <strong>the</strong> uptake fraction, is highly dependent on <strong>the</strong> amount <strong>of</strong> <strong>iodine</strong> in <strong>the</strong> diet (18) . Bair et al. (20)have shown that thyroid uptakes were about 20% in rats with normal <strong>iodine</strong> diets, but increased to40-50% with <strong>iodine</strong>-deficient rats. Dolphin (19) states that, because <strong>of</strong> its interdependence withthyroid mass, uptake fractions and thyroid masses must be derived from similar cohorts. Forexample, an appropriate uptake fraction for a cohort from <strong>the</strong> United States, where <strong>iodine</strong> isabundant in <strong>the</strong> normal diet, is about 20%. However, in countries where <strong>the</strong> <strong>iodine</strong> abundance indiets is reduced, and thyroid masses are correspondingly larger, average uptakes approach 45%.The metabolism and transport <strong>of</strong> <strong>iodine</strong> in <strong>the</strong> human body is simulated using a threecompartment,first-order kinetic model (Fig. 1). This model, as developed by Riggs (16)andmodified by <strong>the</strong> ICRP (18) , contains one inorganic compartment representing iodide in <strong>the</strong> blood andtwo organic compartments representing hormonal <strong>iodine</strong> in <strong>the</strong> thyroid gland and in <strong>the</strong>extracellular tissues <strong>of</strong> <strong>the</strong> body. In <strong>the</strong> model <strong>of</strong> Fig. 1 (16,18) , iodide in <strong>the</strong> blood is ei<strong>the</strong>rtransferred to <strong>the</strong> thyroid or lost via <strong>the</strong> urine with a half-life <strong>of</strong> approximately 6 hours. TheICRP (18) metabolic data for <strong>iodine</strong> does not consider <strong>the</strong> blood-to-thyroid transfer to have anyholdup time, however, o<strong>the</strong>r interpretations <strong>of</strong> <strong>the</strong> Riggs model account for this short-term delay (21) .Once in <strong>the</strong> thyroid, iodide is converted to an organic form and <strong>the</strong>n lost to <strong>the</strong> extracellular tissues<strong>of</strong> <strong>the</strong> body with a half-life <strong>of</strong> about 120 days. Still in <strong>the</strong> organic form, <strong>iodine</strong> in <strong>the</strong> body istransferred, with a half-life <strong>of</strong> approximately 12 days, ei<strong>the</strong>r back to <strong>the</strong> blood and converted toiodide or lost via feces. During pr<strong>of</strong>use sweating, significant amounts <strong>of</strong> iodide can be lost byperspiration, but this route is neglected in <strong>the</strong> model (16,18) .Iodine-<strong>131</strong> decays to <strong>131</strong> Xe and <strong>131</strong>m Xe with yields <strong>of</strong> about 99% and 1%, respectively (22) .Xenon-<strong>131</strong> is a stable isotope, while <strong>131</strong>m Xe emits a 164 keV electron via internal <strong>conversion</strong>. Since4
xenon is a noble gas, and because <strong>of</strong> <strong>the</strong> low yield and low energy <strong>of</strong> <strong>131</strong>m Xe, it is assumed forestimates <strong>of</strong> internal dosimetry that its contribution to <strong>dose</strong> is insignificant. Dose from this nuclide,<strong>the</strong>refore, is not considered in <strong>the</strong> estimate <strong>of</strong> <strong>the</strong> <strong>131</strong> I <strong>dose</strong> <strong>conversion</strong> <strong>factor</strong> (18) .Time-integrated <strong>iodine</strong> activity. In Riggs’ (16)original analysis <strong>of</strong> <strong>the</strong> differential equationsgoverning <strong>the</strong> <strong>iodine</strong> metabolic model, he suggests that <strong>the</strong> change in activity in <strong>the</strong> thyroid gland isapproximately equal to <strong>the</strong> product <strong>of</strong> <strong>the</strong> activity in <strong>the</strong> inorganic compartment and <strong>the</strong> rate constantdescribing <strong>the</strong> transfer from <strong>the</strong> inorganic compartment to <strong>the</strong> thyroid. This analysis, however,would rely on several simplifying assumptions. Therefore, a rigorous ma<strong>the</strong>matical treatment ismore appropriate. Because <strong>of</strong> <strong>the</strong> need to explicitly calculate <strong>the</strong> <strong>dose</strong> <strong>conversion</strong> <strong>factor</strong> multipletimes to determine its variability, <strong>the</strong> details <strong>of</strong> <strong>the</strong> calculation are provided below.A simplified representation <strong>of</strong> <strong>the</strong> three-compartment model for <strong>iodine</strong> <strong>ingestion</strong> ispresented in Fig. 2. The compartments represent <strong>the</strong> time-dependent radio<strong>iodine</strong> activity in <strong>the</strong>blood, X(t), activity in <strong>the</strong> thyroid, Y(t), and activity in <strong>the</strong> rest <strong>of</strong> <strong>the</strong> body, Z(t). The rate constantsdepicted in Fig. 2 account for <strong>the</strong> transfer <strong>of</strong> <strong>iodine</strong> between compartments and <strong>the</strong> loss <strong>of</strong> <strong>iodine</strong>ei<strong>the</strong>r by excretion or radioactive decay. The rate constants are equal to <strong>the</strong> following:a = f kb = ( 1 − f ) k + λc = kbltd = λble= ( 1 − f ) k + λf = f ktbblbbltbblblbwhere f bltand f bblrepresent <strong>the</strong> fraction <strong>of</strong> activity in <strong>the</strong> blood taken up by <strong>the</strong> thyroid and <strong>the</strong>fraction <strong>of</strong> activity in <strong>the</strong> body going to <strong>the</strong> blood, respectively. The parameters k bl, k t, and k brepresent <strong>the</strong> transfer rate constants for <strong>iodine</strong> moving out <strong>of</strong> <strong>the</strong> blood, out <strong>of</strong> <strong>the</strong> thyroid, and out5
<strong>of</strong> <strong>the</strong> body, respectively. Radiological decay, <strong>of</strong> <strong>131</strong> I in this case, is represented by λ. Thedifferential equations for <strong>the</strong> three compartments are:dX()t= fZ() t − a + b X()tdt( ) , (1)dY()t= aX() t − c + d Y()tdt( ) , and (2)dZ()t= cY() t − e + f Z()tdt( ) . (3)The solution <strong>of</strong> <strong>the</strong>se three linear homogeneous first-order differential equations followsfrom <strong>the</strong> creation <strong>of</strong> a single third-order linear homogenous differential equation. This isaccomplished by solving eqn (1) for Z(t), where,Zt () =dX()t+ ( a+b) X( t)dt. (4)fThen, taking <strong>the</strong> derivative <strong>of</strong> eqn (4) with respect to time results in,dZ()t=dt2dXt ()a b dX ()+ ( + )t2dtdt . (5)fSolving eqn (3) for Y(t) yields,6
Yt () =dZ()t+ ( e+f) Z( t)dt, (6)cand substituting eqns (4) and (5) into eqn (6) results in,21 ⎡dXt()dX()t⎤Yt () = + ( a+ b+ e+ f)+ ( a+ b)( e+f) X( t)cf⎢⎣ dtdt⎥. (7)2⎦Then, <strong>the</strong> derivative <strong>of</strong> eqn (7) with respect to time gives,32dY() t 1 ⎡dXt()dXt ()dX()t ⎤= + ( a+ b+ e+ f)+ ( a+ b)( e+f)dt cf⎢ 3⎣ dtdtdt⎥. (8)2⎦Substituting eqns (7) and (8) into eqn (2) and defining <strong>the</strong> following parameters,A= a+ b+ c+ d + e+f,B= ( a+ b)( e+ f) + ( a+ b+ e+ f)( c+d),C = acf − ( a + b)( c + d)( e + f ),and (9)results in <strong>the</strong> third-order differential equation describing <strong>the</strong> system <strong>of</strong> Fig. 2,3dXtA dXt 2() ()B dX ()+ + t = CX()t . (10)32dt dt dtThe solution <strong>of</strong> eqn (10) follows from <strong>the</strong> solution <strong>of</strong> <strong>the</strong> characteristic equation,7
3 2r + Ar + Br = C, (11)and, <strong>the</strong>refore, <strong>the</strong> general solution <strong>of</strong> eqns (10) and (11) takes <strong>the</strong> form,rt 1 rt 2 rt 3Xt ()= ce + ce + ce(12)1 2 3where r 1, r 2, and r 3are <strong>the</strong> roots <strong>of</strong> <strong>the</strong> characteristic equation and c 1, c 2, and c 3areintegration constants determined from <strong>the</strong> initial conditions.In general terms, <strong>the</strong> roots <strong>of</strong> eqn (11) are:r13A D 2 E=− − + , (13)33 3E3 2r23=− A D 2E1 i 3i33− ( + ) 1 33E− ( − ) , and (14)6 2r33= − A D 2E1 i 3 1 i 333+ ( − )3E− ( + ) , (15)6 2where <strong>the</strong> parameters, D and E, have been defined as,D=− A 2 + 3 B, and (16)E = 3 3− 2A + 9AB + 27C + 4 ( 2− A + 3B ) 3+ ( 3 2− 2A + 9AB + 27C) . (17)8
To solve for c 1, c 2, and c 3, <strong>the</strong> initial conditions are such that, X(0) = f 1S, Y(0) = 0, and Z(0)= 0, where S is <strong>the</strong> initial <strong>iodine</strong> activity ingested and f 1is <strong>the</strong> fraction absorbed by <strong>the</strong> transfercompartment (blood). Using eqn (4), <strong>the</strong> initial condition <strong>of</strong> no activity in <strong>the</strong> body compartment,Z(0) = 0, implies that,X′ ( 0) =− ( a+b)fS1, (18)where <strong>the</strong> single-prime notation represents <strong>the</strong> first derivative <strong>of</strong> X with respect to time.Additionally, eqn (6) and <strong>the</strong> Y(0) = 0 initial condition results in,[ ]X′′ ( 0) = ( a+ b)( a+ b+ e+ f) − ( a+ b)( e+f)fS1. (19)Taking time derivatives <strong>of</strong> <strong>the</strong> general solution in eqn (12), <strong>the</strong> initial conditions can be putinto terms <strong>of</strong> integration constants:c1 + c2 + c3 = fS1, (20)cr + cr + cr = − ( a+b) fS, and (21)11 2 2 33 12 2 2cr + c r + c r = − ( a+ b)( a+ b+ e+ f) − ( a+ b)( e+f) fS. (22)112 233[ ]1The three integration constants can be obtained by simultaneously solving eqns (20)-(22).Then, using eqn (12) as <strong>the</strong> general solution for X(t), <strong>the</strong> solutions <strong>of</strong> Z(t) and Y(t) are obtainedthrough eqns (4) and (6), respectively.9
Sample calculations <strong>of</strong> <strong>the</strong> roots and integration constants where performed using <strong>the</strong>following values for <strong>the</strong> rate constants:ln( 2)ln( 2)ln( 2) ln( 2)λ = k = k = k =802 . d 025 . d 120 d 12 dbl t b(23)with f 1= 1.0, f blt= 0.3, f bbl= 0.9, and S = 1 Bq <strong>of</strong> <strong>131</strong> I ingested. With <strong>the</strong>se inputs, <strong>the</strong> roots andintegration constants were determined. A high degree <strong>of</strong> precision was necessary during <strong>the</strong>numerical calculation <strong>of</strong> <strong>the</strong>se values due to <strong>the</strong> large difference in <strong>the</strong> magnitudes <strong>of</strong> <strong>the</strong> three rootsas well as taking powers <strong>of</strong> <strong>the</strong> roots in eqn (22). The final solutions for <strong>the</strong> time-dependent <strong>iodine</strong>activity in <strong>the</strong> three compartments can be presented at a lower precision. For <strong>the</strong> base case givenhere, <strong>the</strong> <strong>iodine</strong> activity in each compartment as a function <strong>of</strong> time, t, can be expressed as,−2. 86t −0. 146t −0.tXt () = 1. 00e − 0. 000613e + 0.000588e0905 Bq , (24)−2. 86t −0. 146t −0.tYt () =−0. 301e − 0. 00949e + 0.291e0905 Bq , and (25)−2. 86t −0. 146t −0.tZt () = 0. 000640e − 0. 0320e + 0.0313e0905 Bq. (26)The activity <strong>of</strong> o<strong>the</strong>r isotopes <strong>of</strong> radio<strong>iodine</strong> in <strong>the</strong> various compartments as a function <strong>of</strong> time canbe calculated ra<strong>the</strong>r easily by multiplying eqns (24) - (26) by <strong>the</strong> <strong>factor</strong>,−( i − . ) teλ 0 0862 , (27)where λ iis <strong>the</strong> decay constant (in units <strong>of</strong> d -1 ) <strong>of</strong> <strong>the</strong> radio<strong>iodine</strong> in question. The integrated activityin each compartment after <strong>ingestion</strong> to a time T, in units <strong>of</strong> d, is determined using,10
XT ( ) = 0. 352 − 0. 350e + 0. 00420e −0.00650e−2. 86T −0. 146T −0.0905TBq - d, (28)YT ( ) = 3. 18 + 0. 105e −0. 0650e −3.22e−2. 86T −0. 146T −0.0905TBq - d , and (29)ZT ( ) = 0. 127 − 0. 000224e + 0. 219e −0.346e−2. 86T −0. 146T −0.0905TBq - d. (30)For T = 18,250 d (50 y), <strong>the</strong> integrated activity is 0.35 Bq-d in <strong>the</strong> blood compartment (X 50y), 3.2Bq-d in <strong>the</strong> thyroid compartment (Y 50y), and 0.13 Bq-d in <strong>the</strong> body compartment (Z 50y). Theseresults are consistent with a previous solution <strong>of</strong> <strong>the</strong> <strong>iodine</strong> <strong>ingestion</strong> model (16,18) , which used an <strong>131</strong> Idecay half-life <strong>of</strong> 8.04 d and accounts for <strong>the</strong> different half-lives <strong>of</strong> o<strong>the</strong>r isotopes.Calculation <strong>of</strong> <strong>the</strong> S-<strong>factor</strong>. The S-<strong>factor</strong>, in units <strong>of</strong> Gy Bq -1 d -1 , is calculated using,−16 . x10 13S =∑i iM T i∆ φ (31)where <strong>the</strong> constant has units <strong>of</strong> J MeV -1 and, for <strong>the</strong> case <strong>of</strong> <strong>131</strong> I, M Tis <strong>the</strong> mass <strong>of</strong> <strong>the</strong> thyroid (inkg), ∆ iis <strong>the</strong> product <strong>of</strong> <strong>the</strong> fractional yield and <strong>the</strong> average emission energy per disintegration <strong>of</strong>radiation I (in MeV), and φ iis <strong>the</strong> fraction <strong>of</strong> energy absorbed by <strong>the</strong> target organ from radiation ioriginating in a given source (<strong>the</strong> thyroid is both <strong>the</strong> source and <strong>the</strong> target in this case). The mass<strong>of</strong> <strong>the</strong> thyroid varies from one person to <strong>the</strong> next and is correlated to <strong>the</strong> <strong>iodine</strong> uptake fraction andits physiological health. Iodine-<strong>131</strong> decays by beta emission 100% <strong>of</strong> <strong>the</strong> time (Fig. 3). Table 1shows that it has six significant beta radiations, nine gamma radiations, five capture electrons, andtwo characteristic x-rays (22) . The specific absorbed fractions, Φ i, for a thyroid mass <strong>of</strong> 0.020 kg (24)were used to determine absorbed fractions as a function <strong>of</strong> photon energy (see Fig. 4). Theabsorbed fraction, φ i, is related to <strong>the</strong> specific absorbed fraction by,11
φ i=Φ iM T. (32)Absorbed fractions will be used in <strong>the</strong> calculation <strong>of</strong> DCF uncertainty because <strong>of</strong> <strong>the</strong>necessity to have variability in <strong>the</strong> mass <strong>of</strong> <strong>the</strong> adult thyroid. Some uncertainty will be introducedinto <strong>the</strong> calculation since <strong>the</strong> absorbed fractions are derived from specific absorbed fractions whichare determined using distinct geometrical shapes related to specific organ masses. This addeduncertainty, however, is expected to be insignificant in <strong>the</strong> overall variability <strong>of</strong> <strong>the</strong> DCF. The totalyield-weighted energy released per transition is about 0.574 MeV. Of that, approximately 0.204MeV is absorbed by <strong>the</strong> thyroid for each transition <strong>of</strong> <strong>131</strong> I that occurs in <strong>the</strong> thyroid (see Table 1).Therefore, using a standard thyroid mass <strong>of</strong> 0.020 kg, <strong>the</strong> S-<strong>factor</strong> for <strong>131</strong> I(thyroid
to perform all calculations were hand-checked against reported values (21)and results <strong>of</strong>Ma<strong>the</strong>matica ® calculations.Monte Carlo technique. Parameter values for multiple calculations <strong>of</strong> DCF were assigned usinga Latin hypercube sampling (LHS) routine. The method considers <strong>the</strong> range <strong>of</strong> each parameter tobe composed <strong>of</strong> a given number <strong>of</strong> non-overlapping intervals <strong>of</strong> equal probability. For a givenparameter, values are selected at random from each interval based on <strong>the</strong> probability densityfunction in <strong>the</strong> interval. The Latin hypercube approach is a constrained random sampling techniquethat results in added precision over conventional random sampling methods (e.g., simple randomsampling) since <strong>the</strong> entire range <strong>of</strong> <strong>the</strong> distribution is sampled in a more systematic manner (15) .Thus, fewer iterations are needed in order to provide adequate statistical input for <strong>the</strong> probabilistic<strong>dose</strong> estimate. Model input includes <strong>the</strong> type <strong>of</strong> distribution (e.g., normal, lognormal, uniform) andparameters describing its range (e.g., mean, standard deviation, minimum, maximum).One thousand <strong>dose</strong> estimates were calculated using <strong>the</strong> <strong>dose</strong>-<strong>conversion</strong>-<strong>factor</strong> model and<strong>the</strong> parameter assignments described below. The Latin hypercube routine selected 10 parametervalues from each <strong>of</strong> 100 intervals within each parameter distribution. All parameters, except thyroidmass and uptake fraction, were assumed to be independent since data supporting <strong>the</strong> calculation <strong>of</strong>correlation coefficients were not found to be available. The Latin hypercube method providedfrequency distributions <strong>of</strong> <strong>dose</strong> with mean standard errors <strong>of</strong> less than 1%. Statistics <strong>of</strong> <strong>the</strong> <strong>dose</strong>probability distribution were not significantly improved by increasing <strong>the</strong> number <strong>of</strong> trials above1,000.PARAMETER DISTRIBUTIONSOf <strong>the</strong> parameters varied in <strong>the</strong> calculation <strong>of</strong> <strong>the</strong> <strong>131</strong> I <strong>ingestion</strong> <strong>dose</strong> <strong>factor</strong>, very few areknown with certainty. Eleven parameters are allowed to vary according to <strong>the</strong>ir range and13
probability distribution (see Table 2). Because <strong>of</strong> <strong>the</strong> lack <strong>of</strong> certainty, all parameters except thyroidmass, are assigned triangular distributions, <strong>the</strong> least amount <strong>of</strong> bias for <strong>the</strong> information available.Because <strong>of</strong> early studies on <strong>the</strong> kinetics <strong>of</strong> radio<strong>iodine</strong> in <strong>the</strong> human body, some information isknown about transfer rates, compartmentalization, and transfer fractions, but for <strong>the</strong> most part, <strong>the</strong>seestimates are ei<strong>the</strong>r based on studies <strong>of</strong> persons with thyroid disease or results have been derivedfrom small cohorts (16) . In all but one parameter, <strong>the</strong> thyroid uptake fraction, <strong>the</strong> data are limitedsuggesting <strong>the</strong> use <strong>of</strong> uniform or triangular distributions. However, since <strong>iodine</strong> uptake has beenshown to be directly correlated to <strong>the</strong> mass <strong>of</strong> one’s thyroid (16,17,19) , its assigned distribution willmimic, and be closely correlated to, that <strong>of</strong> <strong>the</strong> thyroid mass.Thyroid mass (M T). Since <strong>the</strong> mass <strong>of</strong> ones’ thyroid is directly related to its uptake fraction <strong>of</strong><strong>iodine</strong> from <strong>the</strong> bloodstream (16,19) , and since diet has an important influence on fractional uptake andmass, it is extremely important that thyroid mass be correlated with uptake fraction and that <strong>the</strong> twocome from comparable datasets (19) . For example, erroneous <strong>dose</strong> estimates would result if a datasetfrom <strong>the</strong> U.S. for thyroid mass were used with an estimate <strong>of</strong> fractional uptake from data in acountry with <strong>iodine</strong>-deficient diets. The mass <strong>of</strong> <strong>the</strong> adult thyroid (age > 17 years) in Standard Manis determined from data collected in New York (25) . These data have a geometric mean <strong>of</strong> 0.01778 kgwith a geometric standard deviation (GSD) <strong>of</strong> 1.47. When log-transformed, <strong>the</strong> distribution isnormal with a mean <strong>of</strong> 1.25 and a standard deviation <strong>of</strong> 0.1682.Fractional absorption (f 1). Fractional absorption refers to <strong>the</strong> fraction <strong>of</strong> <strong>the</strong> initial intake that isabsorbed into <strong>the</strong> transfer compartment, i.e., <strong>the</strong> bloodstream. It is generally assumed that f 1isequal to unity for <strong>iodine</strong> (18) . Early investigators report that <strong>iodine</strong> is rapidly and completelyabsorbed by <strong>the</strong> gastrointestinal tract with very little appearing in <strong>the</strong> feces (16,17) . To allow for <strong>the</strong>modeling <strong>of</strong> some excretion via <strong>the</strong> feces after initial <strong>ingestion</strong>, <strong>the</strong> f 1parameter is assigned atriangular distribution with a mode <strong>of</strong> 1.0 and a range <strong>of</strong> 0.9 to 1.0.14
Fractional uptake from transfer compartment (f blt). Once in <strong>the</strong> bloodstream, <strong>iodine</strong> is takenup by <strong>the</strong> thyroid with about 20-40% efficiency. This uptake is dependent on thyroid mass, thyroidmetabolism and function, and <strong>iodine</strong>-presence in ones’ diet. Dolphin (19) suggests a mass-dependentuptake fraction <strong>of</strong> 0.015 per gram <strong>of</strong> thyroid. The ICRP (18) estimate <strong>of</strong> a fractional uptake <strong>of</strong> 0.30is, <strong>the</strong>refore, consistent with <strong>the</strong> use <strong>of</strong> a 0.020 kg thyroid (25) . The early data <strong>of</strong> Riggs (16) indicatesthat, based on ratios <strong>of</strong> rate constants, <strong>the</strong> uptake fraction for a healthy individual with a “normal”thyroid is approximately 0.33, whereas an individual with “chronic <strong>iodine</strong> deficiency” has anuptake fraction <strong>of</strong> about 0.89. Uptake fractions reported by Riggs range from about 0.10 to 0.90.In order to establish a fractional uptake distribution that is consistent with <strong>the</strong> distribution <strong>of</strong>thyroid mass, we have assigned <strong>the</strong> uptake fraction a lognormal shape with a geometric mean <strong>of</strong>0.267 and a GSD <strong>of</strong> 1.47. The mean is 0.015 times <strong>the</strong> geometric mean <strong>of</strong> <strong>the</strong> thyroid mass(0.01778 kg) and <strong>the</strong> GSD is equal to <strong>the</strong> GSD <strong>of</strong> <strong>the</strong> thyroid mass distribution.The parameters <strong>of</strong> thyroid mass and uptake fraction are directly correlated, however, <strong>the</strong>numerical relationship is not known. We have chosen to arbitrarily set <strong>the</strong> correlation coefficientbetween <strong>the</strong>se two variables to 0.90. This degree <strong>of</strong> correlation will maximize <strong>the</strong>ir influence oneach o<strong>the</strong>r and on <strong>the</strong> entire model, as well as provide some degree <strong>of</strong> flexibility in <strong>the</strong> selection <strong>of</strong>values for <strong>the</strong>se two parameters. The value <strong>of</strong> <strong>the</strong> correlation coefficient will be investigated todetermine its influence on <strong>the</strong> DCF uncertainty.Fractional transfer from body to blood (f bbl). The fraction <strong>of</strong> <strong>iodine</strong> moving from <strong>the</strong>extracellular tissues <strong>of</strong> <strong>the</strong> body to <strong>the</strong> blood is more narrowly defined than <strong>the</strong> thyroid uptakefraction. The body-to-blood fraction does not change from “normal” individuals to those with“acute or chronic <strong>iodine</strong> deficiency” (16) indicating that <strong>the</strong> fraction is far less variable betweenindividuals. The <strong>iodine</strong> leaving <strong>the</strong> body compartment is assumed to go back to <strong>the</strong> transfercompartment (bloodstream) or be excreted via <strong>the</strong> feces. A ratio <strong>of</strong> rate constants was used to15
determine <strong>the</strong> fractional transfer to <strong>the</strong> bloodstream. The transfer fraction is taken as <strong>the</strong> ratio <strong>of</strong> <strong>the</strong>rate constant for movement from <strong>the</strong> body to <strong>the</strong> blood, k bbl, and <strong>the</strong> total body loss rate constant,i.e., <strong>the</strong> transfer to <strong>the</strong> blood plus <strong>the</strong> transfer to <strong>the</strong> feces, k bf, where,fbbl=kbblkbbl+ kbf. (36)We have assigned f bbla triangular distribution with a mode <strong>of</strong> 0.914 and a range <strong>of</strong> ±10%(yet, not to exceed 1.0). The range assigned to this distribution is ra<strong>the</strong>r large given <strong>the</strong> lowvariability <strong>of</strong> Riggs’ data (16) . This wide range will maximize <strong>the</strong> parameter’s influence on modeloutput; this influence will be quantified if it is shown to be significant.Radiological half-life (T 1/2). The estimate <strong>of</strong> <strong>the</strong> radiological half-life for <strong>131</strong> I, and hence <strong>the</strong>decay constant, has varied over <strong>the</strong> years. Depending on which reference is chosen, <strong>the</strong> range <strong>of</strong>values in <strong>the</strong> literature today spans only about 2%. The most current data on <strong>the</strong> decay <strong>of</strong> <strong>131</strong> I isobtained from <strong>the</strong> National Nuclear Data Center (22) , where <strong>the</strong> half-life is reported to be 8.02070days. This value, being carried to six significant figures, is highly precise. We have, <strong>the</strong>refore,chosen to assign a triangular distribution to this parameter with a mode <strong>of</strong> 8.0207 d and a range <strong>of</strong>±0.1%. Because its value is so well known, it is expected that this parameter will have very littleinfluence on total DCF uncertainty.Thyroid-loss rate constant (k T). Iodine is lost from <strong>the</strong> thyroid in “normal” individuals (withregard to thyroid function) with a half-life <strong>of</strong> about 113 days (16) . It is from Riggs’ data that <strong>the</strong>ICRP (18)obtain <strong>the</strong>ir estimate <strong>of</strong> 120 days. The half-life in patients with “chronic <strong>iodine</strong>deficiency” increases to 156 days and drops to as low as 20 days in patients withhyperthyroidism (16) . Given this range <strong>of</strong> possible values over a large population, a triangulardistribution has been assigned with a mode <strong>of</strong> 113 days and a range <strong>of</strong> ±40%. Radio<strong>iodine</strong> is also16
lost from <strong>the</strong> thyroid compartment by radiological decay, and in <strong>the</strong> case <strong>of</strong> <strong>the</strong> short-lived <strong>iodine</strong>s,radiological decay dominates <strong>the</strong> loss from <strong>the</strong> thyroid.Body-loss rate constant (k b). Loss <strong>of</strong> <strong>iodine</strong> from <strong>the</strong> extracellular tissues occurs by transfer to<strong>the</strong> blood, excretion via feces, and radiological decay. Riggs (16) estimates a half-life <strong>of</strong> 11.9 days inthis compartment for both blood transfer and fecal excretion. As with <strong>the</strong> blood-to-body fractionaltransfer, <strong>the</strong> loss rate does not change in individuals with “acute or chronic <strong>iodine</strong> deficiency” and<strong>the</strong> lowest value for patients with hyperthyroidism is 3.9 days (16) . Based on Riggs’ data, <strong>the</strong>refore, atriangular distribution with a mode <strong>of</strong> 12 days and a range <strong>of</strong> ±20% was chosen to describe k b.Blood-loss rate constant (k blt). The ICRP 30 model (18) makes no mention <strong>of</strong> gradual loss <strong>of</strong><strong>iodine</strong> from <strong>the</strong> transfer compartment. Taken explicitly, <strong>the</strong> model suggests that <strong>the</strong> transfer <strong>of</strong><strong>iodine</strong> from <strong>the</strong> blood to <strong>the</strong> thyroid and out <strong>of</strong> <strong>the</strong> body via <strong>the</strong> urine is instantaneous. However,when examining <strong>the</strong> original model development (16) and exercises by Killough and Eckerman (21) andEckerman (23) , it is evident that <strong>iodine</strong> is lost from <strong>the</strong> blood with a half-life <strong>of</strong> about 6 hours.Riggs (16) estimates this value to be 5.8 hours, varying between 1 and 13.9 hours depending on<strong>iodine</strong> deficiency and thyroid function. Therefore, we have chosen a triangular distribution with amode <strong>of</strong> 0.25 days and a range <strong>of</strong> ±99% to describe <strong>the</strong> loss <strong>of</strong> <strong>iodine</strong> from <strong>the</strong> blood.Radiation yield (∆ i). The fraction <strong>of</strong> <strong>the</strong> time a given radiation is emitted per transition <strong>of</strong> <strong>131</strong> I istaken from data provided by <strong>the</strong> NNDC (22) and is reproduced in Table 1. These values are reportedto three significant figures, and as such, each have been assigned a triangular distribution with amode equal to <strong>the</strong> reported value and a range <strong>of</strong> ±1%.Average energy per transition (E i). Also given in Table 1 are <strong>the</strong> NNDC’s values for <strong>the</strong>energy <strong>of</strong> each radiation emitted by <strong>131</strong> I, average energies for beta particles (22) . Radiation energies17
are reported to four significant digits, and as such, each have been assigned triangular distributionswith ranges <strong>of</strong> ±0.1% and modes equal to <strong>the</strong> reported values.Absorbed fraction (φ i). The value <strong>of</strong> absorbed fraction is unity for beta particles and <strong>conversion</strong>electrons, but varies as a function <strong>of</strong> energy for photons. Variability <strong>of</strong> this parameter is nothandled explicitly, but is linked to <strong>the</strong> variability established for E i. The values <strong>of</strong> absorbed fractionare linear-interpolated from <strong>the</strong> data (24) <strong>of</strong> Figure 4 for each iteration and each photon energy.RESULTSThe sensitivity <strong>of</strong> <strong>the</strong> <strong>iodine</strong>-DCF model to its input parameters was determined using bothrank correlation and contribution to variance methods (14,26) . Estimates <strong>of</strong> several distributions havebeen made at a few intermediate steps through <strong>the</strong> calculation <strong>of</strong> <strong>dose</strong> <strong>conversion</strong> <strong>factor</strong>, i.e., energyper transition, S-<strong>factor</strong>, and time-integrated activity. No correlations between parameters wereconsidered for <strong>the</strong> calculation <strong>of</strong> <strong>the</strong>se distributions. However, since both uptake fraction andthyroid mass are used in <strong>the</strong> calculation <strong>of</strong> <strong>dose</strong> <strong>conversion</strong> <strong>factor</strong>, <strong>the</strong>se two input distributionswere assumed to be correlated with a coefficient <strong>of</strong> 0.9. The influence on DCF output <strong>of</strong> choosingthis value for <strong>the</strong> correlation is investigated below.Energy per transition. The energy-per-transition distribution is calculated to assess <strong>the</strong> impactthat radiation yield and radiation energy have on <strong>the</strong> parameter, ∆ iφ i, used in <strong>the</strong> calculation <strong>of</strong>S-<strong>factor</strong>. The resulting distribution is triangular in shape with a range <strong>of</strong> no more than 2% from <strong>the</strong>minimum to <strong>the</strong> maximum value. The variability in <strong>the</strong> distribution is almost entirely explained by<strong>the</strong> B4 beta yield parameter to a degree <strong>of</strong> 93% and <strong>the</strong> B4 beta energy by an additional 1%.Beyond that, no o<strong>the</strong>r single parameter <strong>of</strong> energy or yield contributes more than 1% to <strong>the</strong>∑variability <strong>of</strong> ∆ iφ i. Given that essentially one input parameter contributes to <strong>the</strong> uncertainty <strong>of</strong>i∑i18
this output parameter, <strong>the</strong> radiation energy and yield parameters are excluded from fur<strong>the</strong>rconsideration in <strong>the</strong> results that follow. Their slight contribution to <strong>the</strong> variability <strong>of</strong> <strong>the</strong> <strong>dose</strong><strong>conversion</strong> <strong>factor</strong>, however, will be maintained throughout <strong>the</strong> estimation <strong>of</strong> total uncertainty in <strong>the</strong>DCF.S-<strong>factor</strong>. The mass <strong>of</strong> <strong>the</strong> thyroid shows a complete inverse correlation (-1.0) with <strong>the</strong> <strong>131</strong> I S-<strong>factor</strong>distribution (Fig. 5) and contributes 96% to <strong>the</strong> total variance. The estimated S-<strong>factor</strong> distributionis lognormal with a geometric mean (GM) <strong>of</strong> 1.9x10 -12 Gray per nuclear transition (Gy nt -1 ) and aGSD <strong>of</strong> 1.47. The maximum value is about 14 times larger than <strong>the</strong> minimum value and <strong>the</strong>historical MIRD estimation <strong>of</strong> 1.7x10 -12 Gy nt -1(27) falls at <strong>the</strong> 38th percentile.Time-integrated activity. The distribution for time-integrated activity is lognormal with ageometric mean <strong>of</strong> 1.0x10 5 Bq d -1 and a GSD <strong>of</strong> 1.46, and its range spans a <strong>factor</strong> <strong>of</strong> 12 (Fig. 6).The uptake fraction accounts for 96% <strong>of</strong> <strong>the</strong> total variance (Table 3). The o<strong>the</strong>r input parametersplay a minor role in <strong>the</strong> total variability <strong>of</strong> integrated activity in <strong>the</strong> thyroid.Dose <strong>conversion</strong> <strong>factor</strong>. The <strong>dose</strong> <strong>conversion</strong> <strong>factor</strong> model is equally sensitive to thyroid massand uptake fraction (Table 4), primarily due to <strong>the</strong>ir high degree <strong>of</strong> correlation, but also because <strong>the</strong>thyroid mass drives <strong>the</strong> estimate <strong>of</strong> <strong>the</strong> S-<strong>factor</strong> and <strong>the</strong> uptake fraction drives <strong>the</strong> estimate <strong>of</strong> <strong>the</strong>integrated activity. Although <strong>the</strong> distribution appears to be normally distributed (Fig. 7), <strong>the</strong> DCFbest fits a lognormal distribution with a GM <strong>of</strong> 4.3x10 -7 Sv Bq -1 and a GSD <strong>of</strong> 1.19. The range <strong>of</strong>output values resulted in <strong>the</strong> maximum being a <strong>factor</strong> <strong>of</strong> about 3.7 times <strong>the</strong> minimum and <strong>the</strong> DOEand EPA estimates (28,29) fall at about <strong>the</strong> 78th percentile. The recent estimate <strong>of</strong> 3.5x10 -7 Sv Bq -1 by<strong>the</strong> National Cancer Institute (30) falls at <strong>the</strong> 13th percentile.DISCUSSION19
The thyroid mass is <strong>of</strong> extreme importance in determining <strong>the</strong> S-<strong>factor</strong> for self-irradiation <strong>of</strong> <strong>the</strong>thyroid and <strong>the</strong> uptake fraction completely dominates <strong>the</strong> estimate <strong>of</strong> <strong>the</strong> thyroid’s integratedactivity. And, in general, <strong>the</strong>se two parameters dominate <strong>the</strong> uncertainty <strong>of</strong> <strong>the</strong> <strong>131</strong> I <strong>ingestion</strong> <strong>dose</strong><strong>conversion</strong> <strong>factor</strong>. In calculating <strong>the</strong> <strong>dose</strong> <strong>conversion</strong> <strong>factor</strong>, two more parameters provide someinfluence, those being <strong>the</strong> blood absorption fraction, f 1, and <strong>the</strong> thyroid loss constant, k t. Theabsorption fraction varied from 0.9 to 1.0, with increasing emphasis placed on values closer tounity. When this parameter was allowed to vary from 0.8 to 1.0, with <strong>the</strong> same distributionalemphasis, f 1became <strong>the</strong> most influential parameter with regard to DCF model sensitivity, buto<strong>the</strong>rwise <strong>the</strong> distribution was essentially unchanged with only a 3% decrease in <strong>the</strong> median value.The thyroid loss constant was varied by 40% on ei<strong>the</strong>r side <strong>of</strong> 113 days. Even though this is aconsiderable range, <strong>the</strong> parameter was still only marginally important in <strong>the</strong> calculation <strong>of</strong> DCF,being responsible for only 2% <strong>of</strong> <strong>the</strong> total variance.The emission yield <strong>of</strong> <strong>the</strong> B4 beta particle (see Table 1) is very important in <strong>the</strong> calculation <strong>of</strong> <strong>the</strong>absorbed energy and only marginally for <strong>the</strong> S-<strong>factor</strong>, but in light <strong>of</strong> <strong>the</strong> major influence <strong>of</strong> thyroidmass and uptake fraction, its influence on <strong>the</strong> total DCF uncertainty is vanishingly small.The correlation between thyroid mass and uptake fraction plays a significant role in estimating <strong>the</strong>DCF probability distribution. The degree to which <strong>the</strong> correlation affects <strong>the</strong> DCF was judged byestimating certain statistical parameters while varying <strong>the</strong> correlation coefficient (CC) from zero to1.0 (Fig. 8). Generally, with decreasing correlation, <strong>the</strong> range between <strong>the</strong> maximum and minimumvalues estimated in <strong>the</strong> probabilistic DCF distribution is increased. Likewise, with decreasingcorrelation, <strong>the</strong> skewness increases, indicating that <strong>the</strong> lognormal distribution is getting moreskewed to <strong>the</strong> right, and <strong>the</strong> kurtosis increases, indicating that <strong>the</strong> peakedness <strong>of</strong> <strong>the</strong> distribution isincreasing. However, regardless <strong>of</strong> <strong>the</strong> degree <strong>of</strong> correlation, <strong>the</strong> median <strong>of</strong> <strong>the</strong> DCF distributionremains <strong>the</strong> same, with a standard deviation <strong>of</strong> <strong>the</strong> calculated median values <strong>of</strong> less than 1%.Correlation coefficients between about 0.2 and 0.95 result in roughly <strong>the</strong> same DCF distribution,20
except that <strong>the</strong> range <strong>of</strong> possible values increases from about 4 to 15 with decreasing correlation.For CCs between 0.6 and 0.95, <strong>the</strong> distributions are virtually unchanged. At a CC <strong>of</strong> 1.0, <strong>the</strong> DCFdistribution changes shape dramatically, becoming skewed to <strong>the</strong> left. This degree <strong>of</strong> correlation isma<strong>the</strong>matically equivalent to requiring that <strong>the</strong> uptake fraction equal <strong>the</strong> product <strong>of</strong> 0.015 and <strong>the</strong>thyroid mass. It is not prudent to expect that thyroid mass and uptake are perfectly correlatedacross any population. Therefore, it appears that <strong>the</strong> selection <strong>of</strong> a CC <strong>of</strong> 0.9 is a valid assumptionand has minimal impact on <strong>the</strong> results presented herein.The overall uncertainty <strong>of</strong> <strong>the</strong> <strong>iodine</strong> <strong>dose</strong> <strong>conversion</strong> <strong>factor</strong> is actually decreased because <strong>of</strong> <strong>the</strong>correlation between thyroid mass and uptake fraction. The individual variability in <strong>the</strong> S-<strong>factor</strong> andintegrated activity distributions is considerably greater than <strong>the</strong> uncertainty <strong>of</strong> <strong>the</strong> two combined.This is due to <strong>the</strong> fact that <strong>the</strong> uncertainties <strong>of</strong> mass and uptake dominate <strong>the</strong> uncertainties <strong>of</strong> <strong>the</strong> S-<strong>factor</strong> and <strong>the</strong> integrated activity, respectively, and that those two parameters are highly correlated.Accordingly, <strong>the</strong> range <strong>of</strong> possible values is only about a <strong>factor</strong> <strong>of</strong> 4 for <strong>the</strong> <strong>131</strong> I DCF, compared to a<strong>factor</strong> <strong>of</strong> 15 for <strong>the</strong> tritium <strong>dose</strong> <strong>factor</strong> (31) . By comparison, when <strong>the</strong> correlation is removed (CC=0),<strong>the</strong> range <strong>of</strong> values for <strong>the</strong> <strong>iodine</strong> DCF increases to more than a <strong>factor</strong> <strong>of</strong> 40.21
CONCLUSIONSThe <strong>131</strong> I <strong>dose</strong> <strong>conversion</strong> <strong>factor</strong> is lognormally distributed with a median <strong>of</strong> 4.3x10 -7 Sv Bq -1 and ageometric standard deviation <strong>of</strong> 1.19. The distribution has a range <strong>of</strong> a <strong>factor</strong> <strong>of</strong> approximately 4.Thyroid mass and <strong>the</strong> fractional uptake <strong>of</strong> <strong>iodine</strong> from <strong>the</strong> blood are <strong>the</strong> two most importantparameters in <strong>the</strong> calculation <strong>of</strong> <strong>the</strong> <strong>iodine</strong> DCF. These parameters are known to be correlated, butnot to what degree. Dose estimates to individuals and populations exposed to radio<strong>iodine</strong> can bemade more accurate with an increased understanding <strong>of</strong> <strong>the</strong> correlation between thyroid mass anduptake fraction and <strong>the</strong> development <strong>of</strong> a more extensive database <strong>of</strong> <strong>the</strong>se two parameters.22
REFERENCES1. U.S. Department <strong>of</strong> Energy. Closing <strong>the</strong> Circle on <strong>the</strong> Splitting <strong>of</strong> <strong>the</strong> Atom: TheEnvironmental Legacy <strong>of</strong> Nuclear Weapons Production in <strong>the</strong> United States and What <strong>the</strong>Department <strong>of</strong> Energy is Doing About It. Office <strong>of</strong> Environmental Management.Washington, DC: 1995.2. Shipler, D.B.; Napier, B.A.; Farris, W.T.; Freshley, M.D. Hanford environmental <strong>dose</strong>reconstruction project - an overview. Health Physics. 71:532-544; 1996.3. Meyer, K.R.; Voilleque, P.G.; Schmidt, D.W.; Rope, S.K.; Killough, G.G.; Shleien, B.;Moore, R.E.; Case, M.J.; Till, J.E. Overview <strong>of</strong> <strong>the</strong> Fernald Dosimetry ReconstructionProject and source term estimates for 1951-1988. Health Physics. 71:425-437; 1996.4. Maharas, S. Personal communication. July 1998.5. Murphy, C.E.; Bauer, L.R.; Hayes, D.W.; Marter, W.L.; Zeigler, C.C. Tritium in <strong>the</strong>Savannah River Site environment. Revision 1. Westinghouse Savannah River Company.Aiken, SC: Report No. WSRC-RP-90-424-1; 1991.6. Kantelo, M.V.; Bauer, L.R.; Marter, W.L.; Murphy, C.E.; Zeigler, C.C. Radio<strong>iodine</strong> in <strong>the</strong>Savannha River Site environment. Wesinghouse Savannah River Company. Aiken, SC:Report No. WSRC-RP-90-424-2; 1993.7. Zvonova, I.A.; Balonov, M.I.; Bratilova, A.A. Thyroid <strong>dose</strong> reconstruction for <strong>the</strong> population<strong>of</strong> Russia after <strong>the</strong> Chernobyl accident. Radiation Protection Dosimetry. 79:175-178; 1998.23
8. Kryshev, I.I. Dose reconstruction for <strong>the</strong> areas <strong>of</strong> Russia affected by <strong>131</strong> I contamination.Radiation Protection Dosimetry. 64:93-96; 1996.9. Makhon'ko, K.P.; Kozlova, E.G.; Silant'ev, A.N.; Bochkov, L.P.; Shkuratova, I.G.; Valetova,N.K.; Volokitin, A.A.; Rabotnova, F.A. Local contamination with /sup <strong>131</strong>/I after <strong>the</strong>Chernobyl nuclear power plant accident and estimates <strong>of</strong> <strong>the</strong> <strong>dose</strong> burdens from itsradiation. Atomic Energy. 72:339-344; 1992. (Translated from: Atomnaya Energiya.72:377-382; 1992.)10. Nedveckaite, T.; Filistowicz, W. Estimates <strong>of</strong> thyroid equivalent <strong>dose</strong> in Lithuania following<strong>the</strong> Chernobyl accident. Health Physics. 69:265-268; 1995.11. Anderson, D.M.; Marsh, T.L.; Deonigi, D.A. Developing historical food production andconsumption data for <strong>131</strong>I <strong>dose</strong> estimates: The Hanford experience. Health Physics.71:578-587; 1996.12. Ramsdell, J.V.; Simonen, C.A.; Burk, K.W.; Stage, S.A. Atmospheric dispersion anddeposition <strong>of</strong> <strong>131</strong>I released from <strong>the</strong> Hanford Site. Health Physics. 71:568-577; 1996.13. Farris, W.T.; Napier, B.A.; Ikenberry, T.A.; Shipler, D.B. Radiation <strong>dose</strong>s from HanfordSite releases to <strong>the</strong> atmosphere and <strong>the</strong> Columbia River. Health Physics. 71:588-601; 1996.14. Hamby, D.M. A comparison <strong>of</strong> sensitivity analysis techniques. Health Physics. 68:195-204; 1995.24
15. Hamby, D.M. A probabilistic estimation <strong>of</strong> atmospheric tritium <strong>dose</strong>. Health Physics.65:33-40; 1993.16. Riggs, D.S. Quantitative aspects <strong>of</strong> <strong>iodine</strong> metabolism in man. Pharmacological Reviews.4:284-370; 1952.17. Hetzel, B.S.; Maberly, G.F. Iodine. In: Trace Elements in Human and Animal Nutrition.Walter Mertz (ed.). 5th Edition. Vol. 2. Academic Press. New York, NY: 198618. International Commission on Radiological Protection (ICRP). Limits for intakes <strong>of</strong>radionuclides by workers. New York: Pergamon Press; ICRP Publication 30, Part 1; 1979.19. Dolphin, G.W. Dietary intakes <strong>of</strong> <strong>iodine</strong> and thyroid dosimetry. Health Physics. 21:711-712; 1971.20. Bair, W.J.; Snyder, M.D.; Walters, R.A.; Keough, R.F. Effect <strong>of</strong> 127 I on thyroid uptake <strong>of</strong>inhaled <strong>131</strong> I. Health Physics. 9:1399-1410; 1963.21. Killough, G.G.; Eckerman, K.F. Internal dosimetry. In: Radiological Assessment. J.E. Tilland H.R. Meyer (eds). U.S. Nuclear Regulatory Commission. Washington, DC: ReportNo. NUREG/CR-3332; pp. 1983.22. National Nuclear Data Center (NNDC). Brookhaven National Laboratory. Brookhaven,NY; 1994. (http://www.nndc.bnl.gov)23. Eckerman, K.F. Dosimetric methodology <strong>of</strong> <strong>the</strong> ICRP. In: Internal Radiation Dosimetry.O.G. Rabbe (ed.). Medical Physics Publishing. Madison, WI: pp. 239-270; 1994.25
24. Eckerman, K.F. Personal communication. October 1998.25. International Commission on Radiological Protection (ICRP). Report <strong>of</strong> <strong>the</strong> task group onreference man. New York: Pergamon Press; ICRP Publication 23; 1974.26. Hamby, D.M. A review <strong>of</strong> techniques for parameter sensitivity analysis <strong>of</strong> environmentalmodels. Environmental Monitoring and Assessment. 32:135-154; 1994.27. Snyder, W.S.; Ford, M.R.; Warner, G.G.; Watson, S.B. ‘S’, Absorbed <strong>dose</strong> per unitcumulated activity for selected radionuclides and organs. New York: Society <strong>of</strong> NuclearMedicine. MIRD Pamphlet No. 11; 1975.28. United States Environmental Protection Agency (USEPA). Limiting values <strong>of</strong> radionuclideintake and air concentration and <strong>dose</strong> <strong>conversion</strong> <strong>factor</strong>s for inhalation, submersion, and<strong>ingestion</strong>. Washington, DC: Federal Guidance Report No. 11; 1988.29. United States Department <strong>of</strong> Energy (USDOE). Internal <strong>dose</strong> <strong>conversion</strong> <strong>factor</strong>s forcalculation <strong>of</strong> <strong>dose</strong> to <strong>the</strong> public. Washington, DC: Report No. DOE/EH-0071; 1988.30. National Academy Press. Exposure <strong>of</strong> <strong>the</strong> American people to <strong>iodine</strong>-<strong>131</strong> from Nevadanuclear-bomb tests: Review <strong>of</strong> <strong>the</strong> National Cancer Institute report and public healthimplications. National Academy Press. Washington, DC: 1998.31. Hamby, D.M. <strong>Uncertainty</strong> <strong>of</strong> <strong>the</strong> tritium <strong>dose</strong> <strong>conversion</strong> <strong>factor</strong>. submitted to HealthPhysics. October 1998.26
FIGURE CAPTIONSFig. 1. ICRP 30 <strong>iodine</strong> <strong>ingestion</strong> biokinetic model (18) . Radio<strong>iodine</strong> is also lost from eachcompartment by radiological decay.Fig. 2. Simplified <strong>iodine</strong> biokinetic model.Fig. 3. Iodine-<strong>131</strong> decay scheme (taken from Ref. 22).Fig. 4. Absorbed fraction as a function <strong>of</strong> energy with <strong>the</strong> thyroid as both source and target (fromRef. 24).Fig. 5. Estimated probability distribution for <strong>the</strong> <strong>131</strong> I S-<strong>factor</strong> with <strong>the</strong> thyroid as both source andtarget (in units <strong>of</strong> Gy per nuclear transition).Fig. 6. Estimated probability distribution for <strong>the</strong> <strong>131</strong> I time-integrated activity in <strong>the</strong> thyroid.Fig. 7. Estimated probability distribution for <strong>the</strong> <strong>131</strong> I <strong>dose</strong> <strong>conversion</strong> <strong>factor</strong>.Fig. 8. Statistical descriptors for distributional shape <strong>of</strong> <strong>the</strong> <strong>131</strong> I <strong>dose</strong> <strong>conversion</strong> <strong>factor</strong> as afunction <strong>of</strong> correlation between thyroid mass and thyroid uptake fraction.28
Table 1. Nuclear data and absorbed fractions for <strong>the</strong> transition <strong>of</strong> <strong>131</strong> I with <strong>the</strong> thyroid as sourceand target (adapted from Ref. 22).______________________________________________________________________________Yield Energy, E iE iper transition Absorbed Absorbed E iRadiations (Bq -1 s -1 ) (MeV) (MeV Bq -1 s -1 ) fraction (MeV Bq -1 s -1 )______________________________________________________________________________β - 1 0.0210 0.06936 0.00146 1 0.00146β - 2 0.00651 0.08694 0.000566 1 0.000566β - 3 0.0727 0.09662 0.00702 1 0.00702β - 4 0.899 0.1916 0.172 1 0.172β - 6 0.00480 0.2832 0.00136 1 0.00136γ 1 0.0262 0.08019 0.00210 0.0331 0.0000695ce-K, γ 1 0.0354 0.04562 0.00161 1 0.00161ce-L, γ 1 0.00464 0.07473 0.000347 1 0.000347γ 3 0.00270 0.1772 0.000478 0.0283 0.0000135γ 6 0.0614 0.2843 0.0175 0.0314 0.000548ce-K, γ 6 0.00252 0.2497 0.000629 1 0.000629γ 11 0.00274 0.3258 0.000893 0.0312 0.0000279γ 13 0.817 0.3645 0.298 0.0310 0.00924ce-K, γ 13 0.0155 0.3299 0.00511 1 0.00511ce-L, γ 13 0.00246 0.3590 0.000883 1 0.000883γ 16 0.00360 0.5030 0.00181 0.0319 0.0000577γ 17 0.0717 0.6370 0.0457 0.0310 0.00142γ 18 0.00217 0.6427 0.00139 0.0310 0.0000432γ 19 0.0177 0.7229 0.0128 0.0306 0.000392Kα 1X-ray 0.0256 0.02978 0.000762 0.1515 0.000115Kα 2X-ray 0.0138 0.02946 0.000407 0.1551 0.0000631Omitted β, ce and Auger radiations 0.00132 1 0.00132Omitted X-ray and γ radiations 0.00114
Table 2. Input parameter distributions.______________________________________________________________________________Symbol Parameter Distribution (a) Reference(s)______________________________________________________________________________M TThyroid mass LN (0.01778; 1.47) 20f 1Fractional absorption T (0.9; 1.0; 1.0) 11,12,13f bltUptake fraction LN (0.267; 1.47) 11,14f bblBody-blood transfer T (0.823; 0.914; 1.000) 11T 1/2 <strong>131</strong> I Radiological half-life T (8.0127; 8.0207; 8.0287) 17k TThyroid loss constant T (67.8; 113; 158) 11k bBody loss constant T (9.6; 12; 14.4) 11k bltBlood loss constant T (0.0025; 0.25; 0.4975) 11∆ iRadiation yield see Table 2 -E iEnergy per transition see Table 2 -φ iAbsorbed fraction see Figure 4 -______________________________________________________________________________(a) LN = lognormal (GM; GSD); T = triangular (minimum value; mode; maximum value)31
Table 3. Sensitivity analysis results for <strong>the</strong> time-integrated thyroid activity.______________________________________________________________________________Rank Contribution toParameter Symbol Correlation Variance (%) (a)______________________________________________________________________________Uptake fraction f blt1.00 95.7Body loss constant k b-0.08 0.6Radiological half-life T 1/20.04 0.1Absorption fraction f 10.03 0.1Fraction body-to-blood f bbl0.03 0.1Blood loss constant k bl0.00 0.0Thyroid loss constant k t0.00 0.0______________________________________________________________________________(a) <strong>the</strong> remainder <strong>of</strong> <strong>the</strong> variance corresponds to <strong>the</strong> correlations with radiation yield and average energy.32
Table 4. Sensitivity analysis results for <strong>the</strong> <strong>131</strong> I <strong>dose</strong> <strong>conversion</strong> <strong>factor</strong> model.______________________________________________________________________________Rank Contribution toParameter Symbol Correlation Variance (%) (a)______________________________________________________________________________Thyroid mass M T-0.21 30.1Uptake fraction f blt0.21 30.3Absorption fraction f 10.13 6.5Thyroid loss constant k t0.08 2.2Radiological half-life T 1/2-0.02 0.9Blood loss constant k bl0.02 0.3Fraction body-to-blood f bbl-0.02 0.1Body loss constant k b0.00 0.0______________________________________________________________________________(a) <strong>the</strong> remainder <strong>of</strong> <strong>the</strong> variance corresponds to <strong>the</strong> correlations with radiation yield and average energy.33