Voronoi Diagrams-Bones of Contentions
Voronoi Diagrams-Bones of Contentions
Voronoi Diagrams-Bones of Contentions

You also want an ePaper? Increase the reach of your titles
YUMPU automatically turns print PDFs into web optimized ePapers that Google loves.
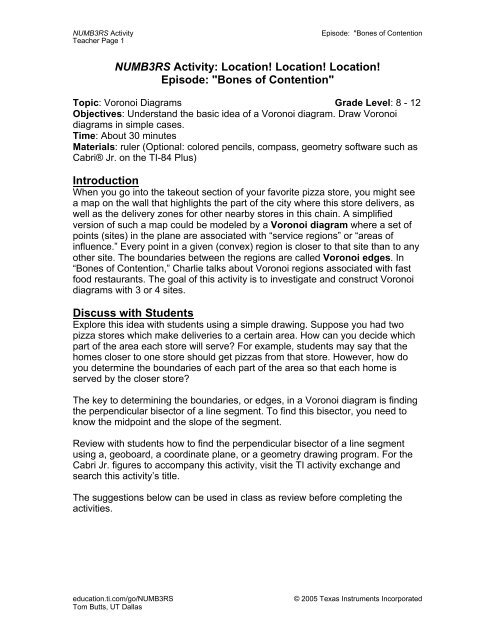
NUMB3RS ActivityTeacher Page 1Episode: "<strong>Bones</strong> <strong>of</strong> ContentionNUMB3RS Activity: Location! Location! Location!Episode: "<strong>Bones</strong> <strong>of</strong> Contention"Topic: <strong>Voronoi</strong> <strong>Diagrams</strong> Grade Level: 8 - 12Objectives: Understand the basic idea <strong>of</strong> a <strong>Voronoi</strong> diagram. Draw <strong>Voronoi</strong>diagrams in simple cases.Time: About 30 minutesMaterials: ruler (Optional: colored pencils, compass, geometry s<strong>of</strong>tware such asCabri® Jr. on the TI-84 Plus)IntroductionWhen you go into the takeout section <strong>of</strong> your favorite pizza store, you might seea map on the wall that highlights the part <strong>of</strong> the city where this store delivers, aswell as the delivery zones for other nearby stores in this chain. A simplifiedversion <strong>of</strong> such a map could be modeled by a <strong>Voronoi</strong> diagram where a set <strong>of</strong>points (sites) in the plane are associated with “service regions” or “areas <strong>of</strong>influence.” Every point in a given (convex) region is closer to that site than to anyother site. The boundaries between the regions are called <strong>Voronoi</strong> edges. In“<strong>Bones</strong> <strong>of</strong> Contention,” Charlie talks about <strong>Voronoi</strong> regions associated with fastfood restaurants. The goal <strong>of</strong> this activity is to investigate and construct <strong>Voronoi</strong>diagrams with 3 or 4 sites.Discuss with StudentsExplore this idea with students using a simple drawing. Suppose you had twopizza stores which make deliveries to a certain area. How can you decide whichpart <strong>of</strong> the area each store will serve? For example, students may say that thehomes closer to one store should get pizzas from that store. However, how doyou determine the boundaries <strong>of</strong> each part <strong>of</strong> the area so that each home isserved by the closer store?The key to determining the boundaries, or edges, in a <strong>Voronoi</strong> diagram is findingthe perpendicular bisector <strong>of</strong> a line segment. To find this bisector, you need toknow the midpoint and the slope <strong>of</strong> the segment.Review with students how to find the perpendicular bisector <strong>of</strong> a line segmentusing a, geoboard, a coordinate plane, or a geometry drawing program. For theCabri Jr. figures to accompany this activity, visit the TI activity exchange andsearch this activity’s title.The suggestions below can be used in class as review before completing theactivities.education.ti.com/go/NUMB3RSTom Butts, UT Dallas© 2005 Texas Instruments Incorporated
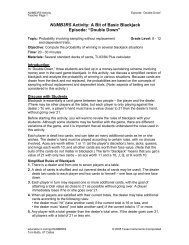
NUMB3RS ActivityTeacher Page 2"Geoboard" ApproachMidpoint: The midpoint <strong>of</strong> AB is located athalf <strong>of</strong> the horizontal distance from A to Band half <strong>of</strong> the vertical distance fromA to B. From A, the midpoint has a verticaldistance 3 and horizontal distance 2.Slope: The slope <strong>of</strong> AB is the verticaldistance from A to B divided by thehorizontal distance from A to B: 6 = 3 .4 2Slope <strong>of</strong> Perpendicular Bisector: Thisslope is the opposite reciprocal <strong>of</strong> the2slope <strong>of</strong> AB : − .3Episode: "<strong>Bones</strong> <strong>of</strong> ContentionCoordinate ApproachCoordinates: A(0,2) and B(4,8)⎛0+ 4 2+8⎞⎜ ⎟⎝ 2 2 ⎠Midpoint: , = ( 2, 5 )Slope: 8 − 2 = 6 =34−0 4 2Slope <strong>of</strong> Perpendicular Bisector:2−3B987B (4, 8)M6654M (2, 5)3A421A (0, 2)01 2 3 4 5 6 7 8 9Student page answers: 1a. AB : slope = 3 2, midpoint = (2, 5), slope <strong>of</strong> perpendicular bisector =− 2 ; BC : slope = , midpoint = (6, 4), slope <strong>of</strong> perpendicular bisector =3 −212 ; AC : slope = − 1 4 ,midpoint = (4, 1), slope <strong>of</strong> perpendicular bisector = 4 1b and 1c. See diagram below 2. Store B;the house at (5, 5) is in the same region (zone) as Store B, so Store B is closest to this house.3. Either Store A or Store B; because this line is the perpendicular bisector <strong>of</strong> AB , a point on theline will be the same distance from Store A and Store B 4. See diagram below 5a. The ‘best’location is the <strong>Voronoi</strong> vertex – located near (4.6,3.3) 5b. See diagram below 6. This willhappen only when the four points lie on a circle. 7. Sample answer: Driving times are assumed tobe uniform and independent <strong>of</strong> traffic.1c. 4. 5.BBDNBNote: the dashedlines are not part<strong>of</strong> the <strong>Voronoi</strong>diagram.AAAeducation.ti.com/go/NUMB3RSTom Butts, UT DallasCCC© 2005 Texas Instruments Incorporated
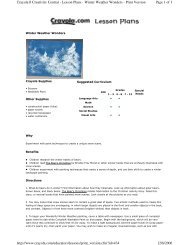
NUMB3RS ActivityStudent Page 1Name: __________________________________Episode: "<strong>Bones</strong> <strong>of</strong> ContentionDate: ________________NUMB3RS Activity: Location! Location! Location!When you go into the takeout section <strong>of</strong> yourfavorite pizza store, you might see a map onthe wall that highlights the part <strong>of</strong> the citywhere this store delivers, as well as thedelivery zones for other nearby stores in thischain. A simplified version <strong>of</strong> such a mapcould be modeled by a <strong>Voronoi</strong> diagram. Inthis activity, you will learn how to draw a<strong>Voronoi</strong> diagram for 3 and 4 stores.61017 8911423First, we will investigate constructing adelivery zone map for 3 stores [sites].51. Pizza World owns 3 pizza stores, A, B, and C. Construct a delivery zone mapfor stores A, B, and C.BACa) Complete the table below.Slope <strong>of</strong> line segment:Midpoint:Slope <strong>of</strong> Perpendicular Bisector:AB BC ACb) Draw the perpendicular <strong>of</strong> bisector <strong>of</strong> AB. Then do the same for AC and BC.c) In the final diagram, the three perpendicular bisectors will intersect in acommon point in the interior <strong>of</strong> ∆ABC called a <strong>Voronoi</strong> vertex. Each <strong>Voronoi</strong>edge should stop at this vertex.education.ti.com/go/NUMB3RSTom Butts, UT Dallas© 2005 Texas Instruments Incorporated
NUMB3RS ActivityEpisode: "<strong>Bones</strong> <strong>of</strong> ContentionStudent Page 2Use your <strong>Voronoi</strong> diagram from Question #1 to answer the following questions.2. Which store should deliver to a house located at (5, 5)? Why?3. Which store should deliver to a house on the boundary between A and B?Why?4. The owner <strong>of</strong> Pizza Worlddecided to open a fourthsuburban store at D.Draw the <strong>Voronoi</strong> diagramor delivery zone map forthese four stores.BHint: Think about how youcan modify your map forthree stores.DAC5. The owner then changedhis mind and decided tolocate the fourth storedowntown near the center<strong>of</strong> the citya. Where should thedowntown store be locatedso it is in the center <strong>of</strong> thecity but as far away fromeach <strong>of</strong> the other threestores as possible? Placethis point in the diagramand estimate itscoordinates.b. Draw the <strong>Voronoi</strong>diagram or delivery zonemap for these four stores.A6. Suppose the <strong>Voronoi</strong> diagram or zone map for four stores X, Y, Z, and W hasexactly four <strong>Voronoi</strong> edges. How are the locations <strong>of</strong> the sites X, Y, Z, and Wrelated to each other? Draw an example <strong>of</strong> such a <strong>Voronoi</strong> diagram.7. A zone map or <strong>Voronoi</strong> diagram is a mathematical model in which severalsimplifying assumptions are made. One <strong>of</strong> these assumptions is that thepopulation is uniformly distributed throughout the city – at least the populationwho wish to buy pizza. What is another simplifying assumption made in usingthis model?BCeducation.ti.com/go/NUMB3RSTom Butts, UT Dallas© 2005 Texas Instruments Incorporated
NUMB3RS ActivityEpisode: "<strong>Bones</strong> <strong>of</strong> ContentionThe goal <strong>of</strong> this activity is to give your students a short and simple snapshot into a very extensivemath topic. TI and NCTM encourage you and your students to learn more about this topic using theextensions provided below and through your own independent research.ExtensionsActivityFor the Teacher. Another way to introduce the idea <strong>of</strong> a <strong>Voronoi</strong>diagram is through an activity involving the use <strong>of</strong> a zone defense inbasketball. See the website for more details.http://dimacs.rutgers.edu/Institute/96/classroom/voronoi/lessons/pat2For the Student• Find several elementary schools, post <strong>of</strong>fices, fire stations, etc. in your city. Draw a<strong>Voronoi</strong> diagram using their locations as sites on a city map. Then check to see how the<strong>Voronoi</strong> regions compare with the school attendance zones, postal delivery zones, firestation response zones, etc.• A <strong>Voronoi</strong> diagram with n sites cannot have more than 3n – 6 <strong>Voronoi</strong> edges. What isthe minimum number <strong>of</strong> edges in a <strong>Voronoi</strong> diagram with n sites? How would the sitesbe positioned so that it would be possible for a minimum number to exist?Additional Resources• There are applications <strong>of</strong> <strong>Voronoi</strong> diagrams in many areas including archaeology,astronomy, biology, and marketing. Examine "Applications from Archeology throughZoology” at http://mathforum.org/mathed/dimacs/lecture.4.html orhttp://www.ics.uci.edu/~eppstein/gina/scot.drysdale.html.• <strong>Voronoi</strong> <strong>Diagrams</strong> and Proximity Problems, Matthew Dickerson and Scot Drysdale,COMAP, 1996. Check www.comap.com for information about how to purchase thismodule.• Geometry and Its Applications, Walter Meyer, Harcourt Academic Press, 1999Chapter 2 has a section on <strong>Voronoi</strong> diagrams.• In a <strong>Voronoi</strong> diagram, each <strong>Voronoi</strong> vertex is the circumcenter <strong>of</strong> a circle containingthree sites. Students can explore this concept using these applets for constructing<strong>Voronoi</strong> diagrams and Delaunay Triangulations:http://www.cs.cornell.edu/Info/People/chew/Delaunay.html andhttp://www.pi6.fernuni-hagen.de/GeomLab/VoroGlide/index.html.en• The Cabri® Jr. App for the TI-83 Plus and TI-84 Plus calculators can be downloadedfor free from http://education.ti.com/cabrijrRelated TopicThe Delaunay Triangulation/Tessellation is the geometric dual <strong>of</strong> the <strong>Voronoi</strong>Diagram. It can be defined as a triangulation <strong>of</strong> the sites [constructing triangles with thesites as vertices] with the additional property that for each triangle <strong>of</strong> the triangulation,the circumcircle <strong>of</strong> that triangle does not contain any other site.See: http://mathworld.wolfram.com/DelaunayTriangulation.htmleducation.ti.com/go/NUMB3RSTom Butts, UT Dallas© 2005 Texas Instruments Incorporated