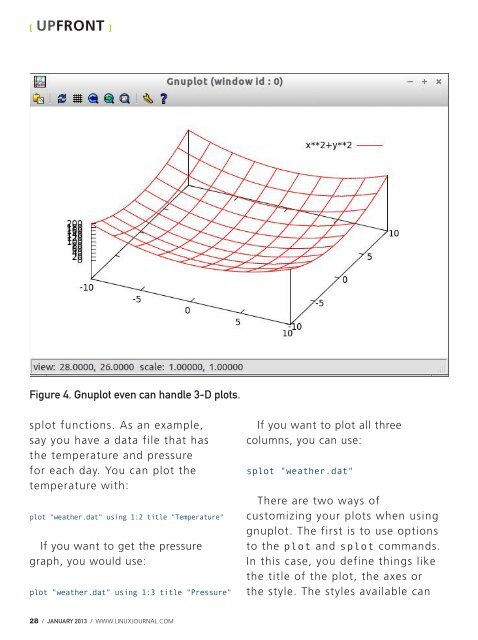
[ UPFRONT ]Figure 4. Gnuplot even can handle 3-D plots.splot functions. As an example,say you have a data file that hasthe temperature and pressurefor each day. You can plot thetemperature with:plot "weather.dat" using 1:2 title "Temperature"If you want to get the pressuregraph, you would use:plot "weather.dat" using 1:3 title "Pressure"If you want to plot all threecolumns, you can use:splot "weather.dat"There are two ways ofcustomizing your plots when usinggnuplot. The first is to use optionsto the plot and splot commands.In this case, you define things likethe title of the plot, the axes orthe style. The styles available can28 / JANUARY <strong>2013</strong> / WWW.LINUXJOURNAL.COM
[ UPFRONT ]be lines, points, linespoints,impulses, dots, steps, fsteps,histeps, errorbars, xerrorbars,yerrorbars or xyerrorbars. To useone of the styles, you can includethe option with the with keyword.So, if you want to plot both thelines and points of your graph,you could add with linespointsto your plot command. You alsocan use shortcuts for these options.For with, you can use w. For thetitle option, you can use t. Forthe using option shown earlier,you can use u.The second option for customizingyour plots is to use the setcommand. With this command,you are free to set the values forseveral graphing options. Using thesecond option, you can set all typesof options, like the title, xlabel,yrange, xtics or key, among otheroptions. For example, you can setthe y-range with:set yrange [20:500]After setting the variousplotting options, you need totell gnuplot to redraw the plotyou are working on. You can dothis with the command:replotMany of these set options alsouse shortcuts. For example, theshortcut version of the abovecommand is:set yr [20:500]Gnuplot is not only a capableutility to plot data and functions,but it also can do some analysison the data being plotted. Forexample, you can get gnuplot to docurve fitting on the data. To do so,Embedded ServerSince 1985OVER28YEARS OFSINGLE BOARDSOLUTIONSStandard SIB• Fanless x86 1GHz CPU• 1 GB DDR2 RAM On Board• 4 GB Compact Flash Disk• 10/100/1000 Base-T Ethernet• Two RS-232 Ports• Four USB 2.0 Ports• Mini-PCIe• Audio In / Out• Power Supply Included• Analog SVGA 3D Video• VESA Hole Pattern• Optional Wireless LAN• Locked Compact Flash Access• No Moving Parts• XPE or <strong>Linux</strong> with Eclipse IDE• Dimensions: 4.9” x 4.7” x 1.7” (125 x 120 x 44mm)2.6 KERNELThe EMAC Server-In-a-Box (SIB) is a low cost, small footprint,yet powerful server. Like all EMAC SIBs, the Standard SIB has nomoving parts and features a rugged enclosure design making itan ideal choice for most industrial applications. The Standard SIBhas a secure locking cover for securing the flash media, while stilloffering easy removal for updates and backing up the system.http://www.emacinc.com/servers/Standard_sib.htmEQUIPMENT MONITOR AND CONTROLPhone: (618) 529-4525 · Fax: (618) 457-0110 · Web: www.emacinc.comWWW.LINUXJOURNAL.COM / JANUARY <strong>2013</strong> / 29
- Page 1: FREE TOSUBSCRIBERSEPUB, Kindle, And
- Page 5 and 6: INDEPTH102 Phonegap ApplicationDeve
- Page 11: [ LETTERS ]My point is that there i
- Page 15: [ LETTERS ]services as resident gam
- Page 19: [ UPFRONT ]hardware, without a lot
- Page 23 and 24: LINUX JOURNALARCHIVE DVDNOW AVAILAB
- Page 25 and 26: [ UPFRONT ]or Bessel. You can use i
- Page 27: [ UPFRONT ]Figure 3. You can plot m
- Page 33 and 34: [ EDITORS' CHOICE ]placement of acc
- Page 35 and 36: COLUMNSAT THE FORGEaspects distingu
- Page 37 and 38: COLUMNSAT THE FORGE};parsed_message
- Page 40 and 41: COLUMNSAT THE FORGEOn my system, I
- Page 42 and 43: COLUMNSAT THE FORGEdownloading it f
- Page 44 and 45: COLUMNSWORK THE SHELLCountingCards:
- Page 46 and 47: COLUMNSWORK THE SHELL52 cards, by t
- Page 48 and 49: COLUMNSHACK AND /More PXEMagicKYLE
- Page 50 and 51: COLUMNSHACK AND /Figure 1. Ubuntu P
- Page 52: COLUMNSHACK AND /$ sudo cp ../preci
- Page 56 and 57: COLUMNSHACK AND /menu begin precise
- Page 58 and 59: COLUMNSTHE OPEN-SOURCE CLASSROOMThe
- Page 60 and 61: COLUMNSTHE OPEN-SOURCE CLASSROOMsha
- Page 62 and 63: COLUMNSTHE OPEN-SOURCE CLASSROOMpas
- Page 65 and 66: NEW PRODUCTSDigital Defense Inc.’
- Page 67 and 68: NEW PRODUCTSSTEC Inc.’s Linux-Bas
- Page 70 and 71: FEATURE Elliptic Curve Cryptography
- Page 72 and 73: FEATURE Elliptic Curve Cryptography
- Page 74 and 75: FEATURE Elliptic Curve Cryptography
- Page 76 and 77: FEATURE Configuring One-Time Passwo
- Page 79 and 80:
Although not a drop-in replacement
- Page 81 and 82:
If you’re tempted to remove stand
- Page 83 and 84:
generate new passwords instead.Here
- Page 86 and 87:
FEATURE Configuring One-Time Passwo
- Page 88 and 89:
FEATURE Configuring One-Time Passwo
- Page 90 and 91:
FEATURE Wi-Fi Mini HoneypotWi-FiMin
- Page 93 and 94:
it has 32MB of RAM and 4MB ofFlash
- Page 95 and 96:
Listing 1. Example Log Generated wi
- Page 98 and 99:
FEATURE Wi-Fi Mini HoneypotThen, co
- Page 100:
FEATURE Wi-Fi Mini HoneypotWhen tin
- Page 103 and 104:
INDEPTHcontribution, they needed to
- Page 105 and 106:
INDEPTHListing 1. HTML for the Samp
- Page 107 and 108:
INDEPTHWeb browser. Setting this va
- Page 109 and 110:
INDEPTHload from one domain, and th
- Page 111 and 112:
EOFEven for hackers, attention tend
- Page 113 and 114:
EOFfor $150. Pop and Uncle Archie,
- Page 115 and 116:
EOFof the coastlines toward theirco
- Page 117:
or losing the most productivegenera