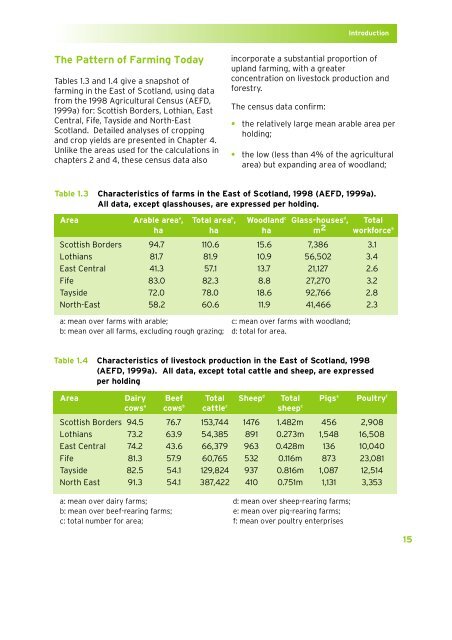
IntroductionThe Pattern <strong>of</strong> Farm<strong>in</strong>g TodayTables 1.3 and 1.4 give a snapshot <strong>of</strong>farm<strong>in</strong>g <strong>in</strong> <strong>the</strong> <strong>East</strong> <strong>of</strong> <strong>Scotland</strong>, us<strong>in</strong>g datafrom <strong>the</strong> 1998 Agricultural Census (AEFD,1999a) for: Scottish Borders, Lothian, <strong>East</strong>Central, Fife, Tayside and North-<strong>East</strong><strong>Scotland</strong>. Detailed analyses <strong>of</strong> cropp<strong>in</strong>gand crop yields are presented <strong>in</strong> Chapter 4.Unlike <strong>the</strong> areas used for <strong>the</strong> calculations <strong>in</strong>chapters 2 and 4, <strong>the</strong>se census data also<strong>in</strong>corporate a substantial proportion <strong>of</strong>upland farm<strong>in</strong>g, with a greaterconcentration on livestock production andforestry.The census data confirm:• <strong>the</strong> relatively large mean arable area perhold<strong>in</strong>g;• <strong>the</strong> low (less than 4% <strong>of</strong> <strong>the</strong> agriculturalarea) but expand<strong>in</strong>g area <strong>of</strong> woodland;Table 1.3Characteristics <strong>of</strong> farms <strong>in</strong> <strong>the</strong> <strong>East</strong> <strong>of</strong> <strong>Scotland</strong>, 1998 (AEFD, 1999a).All data, except glasshouses, are expressed per hold<strong>in</strong>g.Area Arable area a , Total area b , Woodland c Glass-houses d , Totalha ha ha m 2 workforce bScottish Borders 94.7 110.6 15.6 7,386 3.1Lothians 81.7 81.9 10.9 56,502 3.4<strong>East</strong> Central 41.3 57.1 13.7 21,127 2.6Fife 83.0 82.3 8.8 27,270 3.2Tayside 72.0 78.0 18.6 92,766 2.8North-<strong>East</strong> 58.2 60.6 11.9 41,466 2.3a: mean over farms with arable; c: mean over farms with woodland;b: mean over all farms, exclud<strong>in</strong>g rough graz<strong>in</strong>g; d: total for area.Table 1.4 Characteristics <strong>of</strong> livestock production <strong>in</strong> <strong>the</strong> <strong>East</strong> <strong>of</strong> <strong>Scotland</strong>, 1998(AEFD, 1999a). All data, except total cattle and sheep, are expressedper hold<strong>in</strong>gArea Dairy Beef Total Sheep d Total Pigs e Poultry fcows a cows b cattle c sheep cScottish Borders 94.5 76.7 153,744 1476 1.482m 456 2,908Lothians 73.2 63.9 54,385 891 0.273m 1,548 16,508<strong>East</strong> Central 74.2 43.6 66,379 963 0.428m 136 10,040Fife 81.3 57.9 60,765 532 0.116m 873 23,081Tayside 82.5 54.1 129,824 937 0.816m 1,087 12,514North <strong>East</strong> 91.3 54.1 387,422 410 0.751m 1,131 3,353a: mean over dairy farms; d: mean over sheep-rear<strong>in</strong>g farms;b: mean over beef-rear<strong>in</strong>g farms; e: mean over pig-rear<strong>in</strong>g farms;c: total number for area; f: mean over poultry enterprises15
<strong>Crop</strong> <strong>Production</strong> <strong>in</strong> <strong>the</strong> <strong>East</strong> <strong>of</strong> <strong>Scotland</strong>• <strong>the</strong> fairly limited area <strong>of</strong> <strong>in</strong>tensivehorticulture, concentrated near <strong>the</strong> cities<strong>of</strong> Ed<strong>in</strong>burgh, Dundee and Aberdeen – asare <strong>in</strong>tensive dairy, pig and poultryproduction;• <strong>the</strong> small workforce (60,148 for <strong>the</strong>whole <strong>of</strong> <strong>Scotland</strong>, equivalent to 29.3 ha<strong>of</strong> crops and grass per worker),<strong>in</strong>dicat<strong>in</strong>g a high degree <strong>of</strong><strong>in</strong>tensification and mechanisation (andefficiency <strong>in</strong> terms <strong>of</strong> output per unit <strong>of</strong>labour);• <strong>the</strong> <strong>in</strong>tegration <strong>of</strong> crop and livestockagriculture (much <strong>of</strong> <strong>the</strong> cereal producedgoes to support <strong>in</strong>tensive dairy, beef, pigand poultry production; and lowlandgrassland supports <strong>the</strong> dairy <strong>in</strong>dustry,and <strong>the</strong> fatten<strong>in</strong>g and overw<strong>in</strong>ter<strong>in</strong>g <strong>of</strong>cattle and sheep);• <strong>the</strong> large size <strong>of</strong> <strong>the</strong> units <strong>of</strong> livestockproduction (on a European scale).In spite <strong>of</strong> <strong>the</strong> high yield potential <strong>of</strong> arablecropp<strong>in</strong>g <strong>in</strong> <strong>the</strong> <strong>East</strong> <strong>of</strong> <strong>Scotland</strong>, <strong>the</strong> tradedagricultural products <strong>of</strong> <strong>the</strong> area arepredom<strong>in</strong>antly livestock and <strong>in</strong>dustrialproducts. This reality is reflected, forexample, <strong>in</strong> <strong>the</strong> concentration <strong>of</strong> resourcesfor education and research <strong>in</strong> <strong>Scotland</strong> onanimal and veter<strong>in</strong>ary science (seeAppendix 1).The contribution <strong>of</strong> agriculture to <strong>the</strong>Scottish economy is summarised <strong>in</strong> Table1.5. The ma<strong>in</strong> features <strong>of</strong> <strong>the</strong> analysis are:• <strong>the</strong> decl<strong>in</strong><strong>in</strong>g <strong>in</strong>come from agriculture(Income <strong>in</strong> 1998 = 31% <strong>of</strong> that <strong>in</strong> 1995),ow<strong>in</strong>g to a range <strong>of</strong> factors <strong>in</strong>clud<strong>in</strong>g <strong>the</strong>depression <strong>of</strong> prices caused by <strong>the</strong>strength <strong>of</strong> <strong>the</strong> pound and <strong>the</strong> sharpdecl<strong>in</strong>e <strong>in</strong> <strong>the</strong> livestock sector (BSE andoverproduction <strong>in</strong> <strong>the</strong> sheep/pig sectors)• <strong>the</strong> predom<strong>in</strong>ance <strong>of</strong> livestock products(63.4% <strong>of</strong> output <strong>in</strong> 1994; 60.1% <strong>in</strong> 1998)• <strong>the</strong> very small direct contribution thatagriculture (employ<strong>in</strong>g 60,000) makes to<strong>the</strong> Scottish economy (GDP = ca £60bn,employ<strong>in</strong>g 1.3m)Table 1.5The F<strong>in</strong>ancial Status <strong>of</strong> Scottish Agriculture by Sector (£m)16Output 1994 1995 1996 1997 1998Cereals 320 423 432 340 296O<strong>the</strong>r <strong>Crop</strong>s 184 284 179 133 178Horticulture 75 84 92 87 95F<strong>in</strong>ished Livestock 942 1036 1033 968 858Store Livestock 54 53 48 47 36Livestock Products 327 331 341 307 274Gross Output 2,087 2,409 2,318 2,111 1,943Gross Input a 1,054 1,091 1,177 1,124 1,095Gross Value Added b 1,033 1,318 1,142 987 848Total Income from Farm<strong>in</strong>g c 493 743 555 365 231Source: Economic Report on Scottish Agriculture. (AEFD, 1999b)a: seeds, fertilisers, feed, mach<strong>in</strong>ery etc.; c: Gross value added – fixed capital costs,b: Gross output – gross <strong>in</strong>put; subsidies, hired labour, <strong>in</strong>terest and rent.