

Impacts-of-methamphetamine-in-Victoria-Community-Assessment-Penington-Institute
Impacts-of-methamphetamine-in-Victoria-Community-Assessment-Penington-Institute
Impacts-of-methamphetamine-in-Victoria-Community-Assessment-Penington-Institute

Create successful ePaper yourself
Turn your PDF publications into a flip-book with our unique Google optimized e-Paper software.
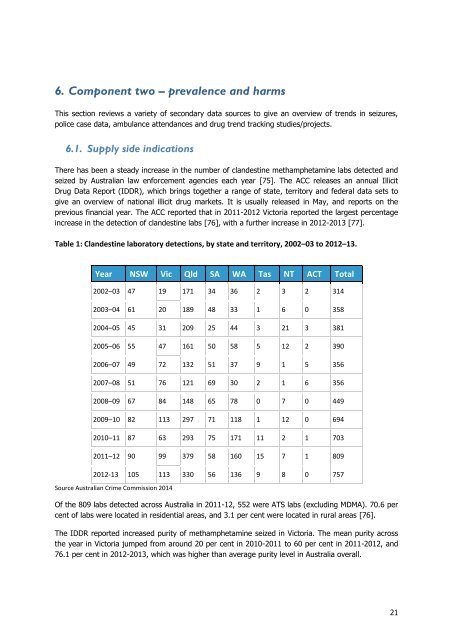
6. Component two – prevalence and harmsThis section reviews a variety <strong>of</strong> secondary data sources to give an overview <strong>of</strong> trends <strong>in</strong> seizures,police case data, ambulance attendances and drug trend track<strong>in</strong>g studies/projects.6.1. Supply side <strong>in</strong>dicationsThere has been a steady <strong>in</strong>crease <strong>in</strong> the number <strong>of</strong> clandest<strong>in</strong>e <strong>methamphetam<strong>in</strong>e</strong> labs detected andseized by Australian law enforcement agencies each year [75]. The ACC releases an annual IllicitDrug Data Report (IDDR), which br<strong>in</strong>gs together a range <strong>of</strong> state, territory and federal data sets togive an overview <strong>of</strong> national illicit drug markets. It is usually released <strong>in</strong> May, and reports on theprevious f<strong>in</strong>ancial year. The ACC reported that <strong>in</strong> 2011-2012 <strong>Victoria</strong> reported the largest percentage<strong>in</strong>crease <strong>in</strong> the detection <strong>of</strong> clandest<strong>in</strong>e labs [76], with a further <strong>in</strong>crease <strong>in</strong> 2012-2013 [77].Table 1: Clandest<strong>in</strong>e laboratory detections, by state and territory, 2002–03 to 2012–13.Year NSW Vic Qld SA WA Tas NT ACT Total2002–03 47 19 171 34 36 2 3 2 3142003–04 61 20 189 48 33 1 6 0 3582004–05 45 31 209 25 44 3 21 3 3812005–06 55 47 161 50 58 5 12 2 3902006–07 49 72 132 51 37 9 1 5 3562007–08 51 76 121 69 30 2 1 6 3562008–09 67 84 148 65 78 0 7 0 4492009–10 82 113 297 71 118 1 12 0 6942010–11 87 63 293 75 171 11 2 1 7032011–12 90 99 379 58 160 15 7 1 8092012-13 105 113 330 56 136 9 8 0 757Source Australian Crime Commission 2014Of the 809 labs detected across Australia <strong>in</strong> 2011-12, 552 were ATS labs (exclud<strong>in</strong>g MDMA). 70.6 percent <strong>of</strong> labs were located <strong>in</strong> residential areas, and 3.1 per cent were located <strong>in</strong> rural areas [76].The IDDR reported <strong>in</strong>creased purity <strong>of</strong> <strong>methamphetam<strong>in</strong>e</strong> seized <strong>in</strong> <strong>Victoria</strong>. The mean purity acrossthe year <strong>in</strong> <strong>Victoria</strong> jumped from around 20 per cent <strong>in</strong> 2010-2011 to 60 per cent <strong>in</strong> 2011-2012, and76.1 per cent <strong>in</strong> 2012-2013, which was higher than average purity level <strong>in</strong> Australia overall.21