

Impacts-of-methamphetamine-in-Victoria-Community-Assessment-Penington-Institute
Impacts-of-methamphetamine-in-Victoria-Community-Assessment-Penington-Institute
Impacts-of-methamphetamine-in-Victoria-Community-Assessment-Penington-Institute

Create successful ePaper yourself
Turn your PDF publications into a flip-book with our unique Google optimized e-Paper software.
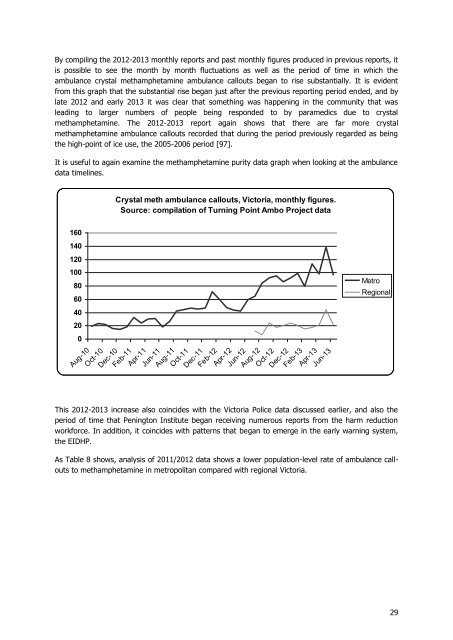
By compil<strong>in</strong>g the 2012-2013 monthly reports and past monthly figures produced <strong>in</strong> previous reports, itis possible to see the month by month fluctuations as well as the period <strong>of</strong> time <strong>in</strong> which theambulance crystal <strong>methamphetam<strong>in</strong>e</strong> ambulance callouts began to rise substantially. It is evidentfrom this graph that the substantial rise began just after the previous report<strong>in</strong>g period ended, and bylate 2012 and early 2013 it was clear that someth<strong>in</strong>g was happen<strong>in</strong>g <strong>in</strong> the community that waslead<strong>in</strong>g to larger numbers <strong>of</strong> people be<strong>in</strong>g responded to by paramedics due to crystal<strong>methamphetam<strong>in</strong>e</strong>. The 2012-2013 report aga<strong>in</strong> shows that there are far more crystal<strong>methamphetam<strong>in</strong>e</strong> ambulance callouts recorded that dur<strong>in</strong>g the period previously regarded as be<strong>in</strong>gthe high-po<strong>in</strong>t <strong>of</strong> ice use, the 2005-2006 period [97].It is useful to aga<strong>in</strong> exam<strong>in</strong>e the <strong>methamphetam<strong>in</strong>e</strong> purity data graph when look<strong>in</strong>g at the ambulancedata timel<strong>in</strong>es.Crystal meth ambulance callouts, <strong>Victoria</strong>, monthly figures.Source: compilation <strong>of</strong> Turn<strong>in</strong>g Po<strong>in</strong>t Ambo Project data160140120100806040200Aug-10Oct-10Dec-10Feb-11Apr-11Jun-11Aug-11Oct-11Dec-11Feb-12Apr-12Jun-12Aug-12Oct-12Dec-12Feb-13Apr-13Jun-13MetroRegionalThis 2012-2013 <strong>in</strong>crease also co<strong>in</strong>cides with the <strong>Victoria</strong> Police data discussed earlier, and also theperiod <strong>of</strong> time that Pen<strong>in</strong>gton <strong>Institute</strong> began receiv<strong>in</strong>g numerous reports from the harm reductionworkforce. In addition, it co<strong>in</strong>cides with patterns that began to emerge <strong>in</strong> the early warn<strong>in</strong>g system,the EIDHP.As Table 8 shows, analysis <strong>of</strong> 2011/2012 data shows a lower population-level rate <strong>of</strong> ambulance calloutsto <strong>methamphetam<strong>in</strong>e</strong> <strong>in</strong> metropolitan compared with regional <strong>Victoria</strong>.29