

Impacts-of-methamphetamine-in-Victoria-Community-Assessment-Penington-Institute
Impacts-of-methamphetamine-in-Victoria-Community-Assessment-Penington-Institute
Impacts-of-methamphetamine-in-Victoria-Community-Assessment-Penington-Institute

Create successful ePaper yourself
Turn your PDF publications into a flip-book with our unique Google optimized e-Paper software.
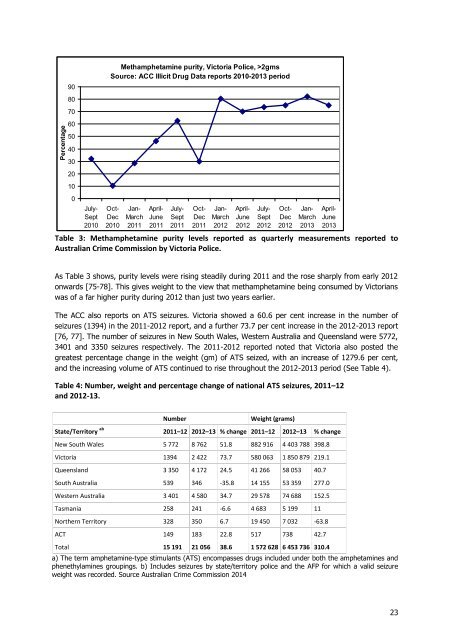
Percentage9080706050403020100July-Sept2010Methamphetam<strong>in</strong>e purity, <strong>Victoria</strong> Police, >2gmsSource: ACC Illicit Drug Data reports 2010-2013 periodOct-Dec2010Jan-March2011April-June2011July-Sept2011Oct-Dec2011Jan-March2012Table 3: Methamphetam<strong>in</strong>e purity levels reported as quarterly measurements reported toAustralian Crime Commission by <strong>Victoria</strong> Police.April-June2012July-Sept2012Oct-Dec2012Jan-March2013April-June2013As Table 3 shows, purity levels were ris<strong>in</strong>g steadily dur<strong>in</strong>g 2011 and the rose sharply from early 2012onwards [75-78]. This gives weight to the view that <strong>methamphetam<strong>in</strong>e</strong> be<strong>in</strong>g consumed by <strong>Victoria</strong>nswas <strong>of</strong> a far higher purity dur<strong>in</strong>g 2012 than just two years earlier.The ACC also reports on ATS seizures. <strong>Victoria</strong> showed a 60.6 per cent <strong>in</strong>crease <strong>in</strong> the number <strong>of</strong>seizures (1394) <strong>in</strong> the 2011-2012 report, and a further 73.7 per cent <strong>in</strong>crease <strong>in</strong> the 2012-2013 report[76, 77]. The number <strong>of</strong> seizures <strong>in</strong> New South Wales, Western Australia and Queensland were 5772,3401 and 3350 seizures respectively. The 2011-2012 reported noted that <strong>Victoria</strong> also posted thegreatest percentage change <strong>in</strong> the weight (gm) <strong>of</strong> ATS seized, with an <strong>in</strong>crease <strong>of</strong> 1279.6 per cent,and the <strong>in</strong>creas<strong>in</strong>g volume <strong>of</strong> ATS cont<strong>in</strong>ued to rise throughout the 2012-2013 period (See Table 4).Table 4: Number, weight and percentage change <strong>of</strong> national ATS seizures, 2011–12and 2012-13.NumberWeight (grams)State/Territory ab 2011–12 2012–13 % change 2011–12 2012–13 % changeNew South Wales 5 772 8 762 51.8 882 916 4 403 788 398.8<strong>Victoria</strong> 1394 2 422 73.7 580 063 1 850 879 219.1Queensland 3 350 4 172 24.5 41 266 58 053 40.7South Australia 539 346 -35.8 14 155 53 359 277.0Western Australia 3 401 4 580 34.7 29 578 74 688 152.5Tasmania 258 241 -6.6 4 683 5 199 11Northern Territory 328 350 6.7 19 450 7 032 -63.8ACT 149 183 22.8 517 738 42.7Total 15 191 21 056 38.6 1 572 628 6 453 736 310.4a) The term amphetam<strong>in</strong>e-type stimulants (ATS) encompasses drugs <strong>in</strong>cluded under both the amphetam<strong>in</strong>es andphenethylam<strong>in</strong>es group<strong>in</strong>gs. b) Includes seizures by state/territory police and the AFP for which a valid seizureweight was recorded. Source Australian Crime Commission 201423