FM Synthesis for Musical Instruments - Bells and Clarinets
FM Synthesis for Musical Instruments - Bells and Clarinets
FM Synthesis for Musical Instruments - Bells and Clarinets

Create successful ePaper yourself
Turn your PDF publications into a flip-book with our unique Google optimized e-Paper software.
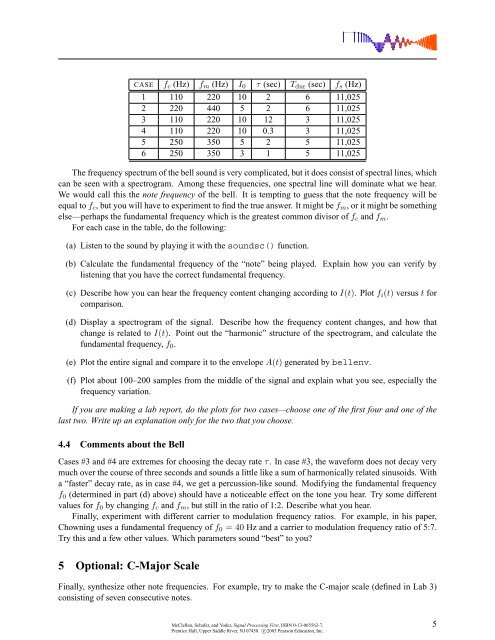
CASE f c (Hz) f m (Hz) I 0 τ (sec) T dur (sec) f s (Hz)1 110 220 10 2 6 11,0252 220 440 5 2 6 11,0253 110 220 10 12 3 11,0254 110 220 10 0.3 3 11,0255 250 350 5 2 5 11,0256 250 350 3 1 5 11,025The frequency spectrum of the bell sound is very complicated, but it does consist of spectral lines, whichcan be seen with a spectrogram. Among these frequencies, one spectral line will dominate what we hear.We would call this the note frequency of the bell. It is tempting to guess that the note frequency will beequal to f c , but you will have to experiment to find the true answer. It might be f m , or it might be somethingelse—perhaps the fundamental frequency which is the greatest common divisor of f c <strong>and</strong> f m .For each case in the table, do the following:(a) Listen to the sound by playing it with the soundsc() function.(b) Calculate the fundamental frequency of the “note” being played. Explain how you can verify bylistening that you have the correct fundamental frequency.(c) Describe how you can hear the frequency content changing according to I(t). Plot f i (t) versus t <strong>for</strong>comparison.(d) Display a spectrogram of the signal. Describe how the frequency content changes, <strong>and</strong> how thatchange is related to I(t). Point out the “harmonic” structure of the spectrogram, <strong>and</strong> calculate thefundamental frequency, f 0 .(e) Plot the entire signal <strong>and</strong> compare it to the envelope A(t) generated by bellenv.(f) Plot about 100–200 samples from the middle of the signal <strong>and</strong> explain what you see, especially thefrequency variation.If you are making a lab report, do the plots <strong>for</strong> two cases—choose one of the first four <strong>and</strong> one of thelast two. Write up an explanation only <strong>for</strong> the two that you choose.4.4 Comments about the BellCases #3 <strong>and</strong> #4 are extremes <strong>for</strong> choosing the decay rate τ. In case #3, the wave<strong>for</strong>m does not decay verymuch over the course of three seconds <strong>and</strong> sounds a little like a sum of harmonically related sinusoids. Witha “faster” decay rate, as in case #4, we get a percussion-like sound. Modifying the fundamental frequencyf 0 (determined in part (d) above) should have a noticeable effect on the tone you hear. Try some differentvalues <strong>for</strong> f 0 by changing f c <strong>and</strong> f m , but still in the ratio of 1:2. Describe what you hear.Finally, experiment with different carrier to modulation frequency ratios. For example, in his paper,Chowning uses a fundamental frequency of f 0 = 40 Hz <strong>and</strong> a carrier to modulation frequency ratio of 5:7.Try this <strong>and</strong> a few other values. Which parameters sound “best” to you?5 Optional: C-Major ScaleFinally, synthesize other note frequencies. For example, try to make the C-major scale (defined in Lab 3)consisting of seven consecutive notes.McClellan, Schafer, <strong>and</strong> Yoder, Signal Processing First, ISBN 0-13-065562-7.Prentice Hall, Upper Saddle River, NJ 07458. c○2003 Pearson Education, Inc.5