FM Synthesis for Musical Instruments - Bells and Clarinets
FM Synthesis for Musical Instruments - Bells and Clarinets
FM Synthesis for Musical Instruments - Bells and Clarinets

Create successful ePaper yourself
Turn your PDF publications into a flip-book with our unique Google optimized e-Paper software.
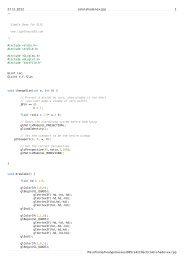
6 WoodwindsAs an alternative to the bell sounds, this section shows how different parameters in the same <strong>FM</strong> synthesis<strong>for</strong>mula (1) will yield a clarinet sound, or other woodwinds.6.1 Generating the Envelopes <strong>for</strong> WoodwindsThere is a function on the CD-ROM called woodwenv which produces the functions needed to create boththe A(t) <strong>and</strong> I(t) envelopes <strong>for</strong> a clarinet sound. The file header looks like this:♥❦❤CD-ROMwoodwenv.mfunction [y1, y2] = woodwenv(att, sus, rel, fsamp)%WOODWENV produce normalized amplitude <strong>and</strong> modulation index% functions <strong>for</strong> woodwinds%% usage: [y1, y2] = woodwenv(att, sus, rel, fsamp);%% where att = attack TIME% sus = sustain TIME% rel = release TIME% fsamp = sampling frequency (Hz)% returns:% y1 = (NORMALIZED) amplitude envelope% y2 = (NORMALIZED) modulation index envelope%% NOTE: attack is exponential, sustain is constant,% release is exponentialThe outputs from woodwenv are normalized so that the minimum value is zero <strong>and</strong> the max is one. Try thefollowing statements to see what the function produces:fsamp = 8000;Ts = 1/fsamp;tt = delta : Ts : 0.5;[y1, y2] = woodwenv(0.1, 0.35, 0.05, fsamp);subplot(2,1,1), plot(tt,y1), grid onsubplot(2,1,2), plot(tt,y2), grid on6.2 Scaling the Clarinet EnvelopesSince the woodwind envelopes produced by woodwenv range from 0 to 1, some scaling is necessary tomake them useful in the <strong>FM</strong> synthesis equation (1). In this section, we consider the general process of linearre-scaling. If we start with a normalized signal y norm (t) <strong>and</strong> want to produce a new signal whose max isy max <strong>and</strong> whose min is y min , then we must map 1 to y max <strong>and</strong> 0 to y min . Consider the linear mapping:y new (t) = α y norm (t) + β (4)Determine the relationship between α <strong>and</strong> β <strong>and</strong> y max <strong>and</strong> y min , so that the max <strong>and</strong> the min of y new (t) arecorrect.Test this idea in MATLAB by doing the following example (where α = 5 <strong>and</strong> β = 3):McClellan, Schafer, <strong>and</strong> Yoder, Signal Processing First, ISBN 0-13-065562-7.Prentice Hall, Upper Saddle River, NJ 07458. c○2003 Pearson Education, Inc.7