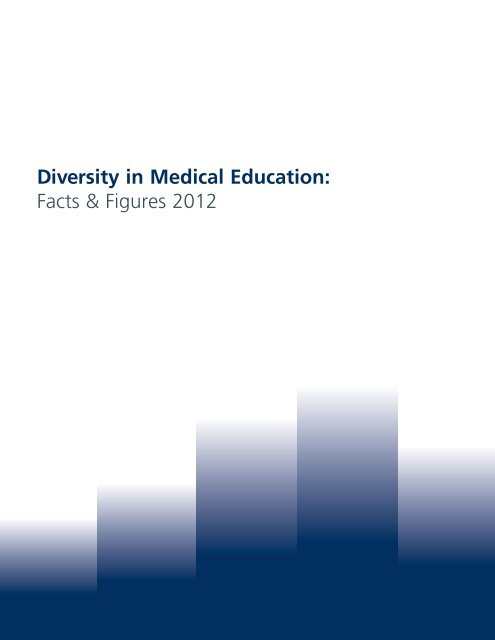
Diversity in Medical Education: Facts & Figures 2012 - AAMC
Diversity in Medical Education: Facts & Figures 2012 - AAMC
Diversity in Medical Education: Facts & Figures 2012 - AAMC
- TAGS
- diversity
- medical
- figures-aamc

You also want an ePaper? Increase the reach of your titles
YUMPU automatically turns print PDFs into web optimized ePapers that Google loves.
<strong>Diversity</strong> <strong>in</strong> <strong>Medical</strong> <strong>Education</strong>:<br />
<strong>Facts</strong> & <strong>Figures</strong> <strong>2012</strong>
Laura Castillo-Page, Ph.D.<br />
Senior Director, <strong>Diversity</strong> Policy and Programs<br />
Published by the Association of American <strong>Medical</strong> Colleges,<br />
<strong>Diversity</strong> Policy and Programs. Fall <strong>2012</strong><br />
Partial Support for this project provided by<br />
The Robert Wood Johnson Foundation<br />
If you have questions regard<strong>in</strong>g the content of the document, please contact:<br />
<strong>Facts</strong> & <strong>Figures</strong><br />
Association of American <strong>Medical</strong> Colleges<br />
<strong>Diversity</strong> Policy and Programs<br />
2450 N Street, NW<br />
Wash<strong>in</strong>gton, D.C. 20037-1127<br />
Phone: 202 862 6203<br />
Fax: 202 862 6282<br />
E-mail: facts&figures@aamc.org<br />
To order or download free copies of this publication, please contact:<br />
Association of American <strong>Medical</strong> Colleges Membership Services<br />
2450 N Street, NW<br />
Wash<strong>in</strong>gton, D.C. 20037-1127<br />
Phone: 202 862 0416<br />
Fax: 202 862 1123<br />
www.aamc.org/publications<br />
©<strong>2012</strong> Association of American <strong>Medical</strong> Colleges. The data and charts <strong>in</strong> this report, with<br />
attribution, may be distributed and used by and with<strong>in</strong> <strong>AAMC</strong> member organizations. No other<br />
part of this publication may be reproduced or distributed without written permission of the<br />
Association of American <strong>Medical</strong> Colleges.
Table of Contents<br />
<strong>Diversity</strong> <strong>in</strong> <strong>Medical</strong> <strong>Education</strong>: <strong>Facts</strong> & <strong>Figures</strong> <strong>2012</strong><br />
About this Document ..............................................................................................7<br />
I. Emerg<strong>in</strong>g Topic: The Importance of Creat<strong>in</strong>g Diverse<br />
and Inclusive Environments ...................................................................................9<br />
II. Trends <strong>in</strong> <strong>Medical</strong> <strong>Education</strong> ..........................................................................12<br />
III. Current Status of Racial and Ethnic M<strong>in</strong>orities <strong>in</strong> <strong>Medical</strong> <strong>Education</strong> ........16<br />
U.S. <strong>Medical</strong> School Applicants<br />
Figure 1: Number of U.S. <strong>Medical</strong> School Applicants by Gender,<br />
1982–2011 ...........................................................................................16<br />
Figure 2: Percentage and Number of U.S. <strong>Medical</strong> School Applicants<br />
by Race and Ethnicity, 2011 ...............................................................17<br />
Figure 3: Percentage and Number of First-Time U.S. <strong>Medical</strong> School<br />
Applicants by Race and Ethnicity, 2011 ............................................18<br />
Figure 4: Percentage and Number of First-Time U.S. <strong>Medical</strong> School<br />
Applicants by Gender and Race and Ethnicity, 2011 .......................19<br />
Figure 5: Number of U.S. <strong>Medical</strong> School Applicants by Race and<br />
Ethnicity, 1977–2011 ..........................................................................20<br />
Figure 6: Number of U.S. <strong>Medical</strong> School Applicants by Hispanic or<br />
Lat<strong>in</strong>o Subgroup, 2009–2011 .............................................................21<br />
Figure 7: Percentage of U.S. <strong>Medical</strong> School Applicants by<br />
Asian Subgroups, 2011 .......................................................................22<br />
Figure 8: Percentage of U.S. <strong>Medical</strong> School Applicants<br />
by Gender and Race and Ethnicity, 2009–2011 ...............................23<br />
Figure 9: Percentage of U.S. <strong>Medical</strong> School Applicants<br />
by Gender and Hispanic or Lat<strong>in</strong>o Subgroups, 2009–2011 ............24<br />
U.S. <strong>Medical</strong> School Accepted Applicants<br />
Figure 10: Percentage of Accepted U.S. <strong>Medical</strong> School Applicants<br />
by Race and Ethnicity, 2010–2011 ....................................................25<br />
Figure 11: Percentage of Accepted U.S. <strong>Medical</strong> School Applicants<br />
by Gender and Race and Ethnicity, 2011 ..........................................26<br />
1<br />
Association of American <strong>Medical</strong> Colleges
Table of Contents<br />
<strong>Diversity</strong> <strong>in</strong> <strong>Medical</strong> <strong>Education</strong>: <strong>Facts</strong> & <strong>Figures</strong> <strong>2012</strong><br />
U.S. <strong>Medical</strong> School Matriculants<br />
Figure 12: Percentage of U.S. <strong>Medical</strong> School Matriculants<br />
by Race and Ethnicity, 2010–2011 ....................................................27<br />
Figure 13: Percentage of U.S. <strong>Medical</strong> School Matriculants<br />
by Gender and Race and Ethnicity, 2011 ..........................................28<br />
U.S. <strong>Medical</strong> School Graduates<br />
Figure 14: Number of U.S. <strong>Medical</strong> School Graduates by Gender,<br />
1980–2011 ...........................................................................................29<br />
Figure 15: Number of U.S. <strong>Medical</strong> School Graduates by Race and<br />
Ethnicity, 2002–2011 ..........................................................................30<br />
Figure 16: Number of U.S. <strong>Medical</strong> School Graduates<br />
by Hispanic or Lat<strong>in</strong>o Subgroups, 1980–2011 .................................31<br />
Figure 17: Number of Women U.S. <strong>Medical</strong> School Graduates<br />
by Race and Ethnicity, 2002–2011 .....................................................32<br />
U.S. <strong>Medical</strong> School Faculty<br />
Figure 18: Percentage and Number of U.S. <strong>Medical</strong> School Faculty<br />
by Race and Ethnicity, 2011 ...............................................................33<br />
Figure 19: Percentage of U.S. <strong>Medical</strong> School Faculty<br />
by Rank and Race and Ethnicity, 2011 .............................................34<br />
Figure 20: Percentage of U.S. <strong>Medical</strong> School Faculty by Rank, Gender,<br />
and Race and Ethnicity, 2011 ............................................................35<br />
IV. Additional <strong>Figures</strong><br />
Figure 21: How Students Spent Time Between College and Enter<strong>in</strong>g<br />
U.S. <strong>Medical</strong> School by Race and Ethnicity, 2011 Matriculants .....38<br />
Figure 22: Top Five Influenc<strong>in</strong>g Factors on Decision to Study Medic<strong>in</strong>e<br />
by Race and Ethnicity, 2011 Matriculants ........................................39<br />
Figure 23: Amount of Non-<strong>Education</strong>al Debt by Race and Ethnicity,<br />
2011 Matriculants ...............................................................................40<br />
Figure 24: Status of Premedical School Debt by Race and Ethnicity,<br />
2011 Matriculants ...............................................................................41<br />
Figure 25: Amount of Premedical <strong>Education</strong>al Loans Outstand<strong>in</strong>g<br />
by Race and Ethnicity, 2011 Matriculants ........................................42<br />
Figure 26: How College/Premedical School Costs Were Paid<br />
by Race and Ethnicity, 2011 Matriculants ........................................43<br />
2<br />
Association of American <strong>Medical</strong> Colleges
Table of Contents<br />
<strong>Diversity</strong> <strong>in</strong> <strong>Medical</strong> <strong>Education</strong>: <strong>Facts</strong> & <strong>Figures</strong> <strong>2012</strong><br />
Figure 27: How Matriculants Plan to F<strong>in</strong>ance Their <strong>Medical</strong> <strong>Education</strong><br />
by Race and Ethnicity, 2011 Matriculants ........................................44<br />
Figure 28: Career Intentions by Race and Ethnicity, 2011 Matriculants .........45<br />
Figure 29: Planned Specialty Once Certified, 2011 Matriculants .....................46<br />
Figure 30: Percentage of U.S. <strong>Medical</strong> School Matriculants<br />
Plann<strong>in</strong>g to Practice <strong>in</strong> an Underserved Area by Race<br />
and Ethnicity, 2011 Matriculants ......................................................47<br />
Figure 31: Percentage of U.S. <strong>Medical</strong> School Matriculants Plann<strong>in</strong>g<br />
to Practice <strong>in</strong> an Underserved Area by Race and Ethnicity<br />
and Year: 2000, 2005, and 2011 Matriculants ..................................48<br />
Figure 32: The Racial and Ethnic Composition of the Neighborhood<br />
Where I Grew Up, 2011 Matriculants ..............................................49<br />
Figure 33: The Racial and Ethnic Composition of the College<br />
Where I Graduated, 2011 Matriculants ............................................50<br />
Figure 34: The Racial and Ethnic Composition of My College Friends,<br />
2011 Matriculants ...............................................................................51<br />
Figure 35: The Perspectives of Individuals from Racial and Ethnic<br />
Groups Different Than My Own Were Often Brought Into<br />
My Undergraduate Coursework, 2011 Matriculants .......................52<br />
Figure 36: My Knowledge or Op<strong>in</strong>ions of Others Were Influenced or<br />
Changed by Becom<strong>in</strong>g Aware of Different Perspectives,<br />
2011 Matriculants ...............................................................................53<br />
V. Detailed Tables<br />
U.S. <strong>Medical</strong> School Applicants, Acceptants, Matriculants, Enrollment, and<br />
Graduates<br />
Table 1: Number of U.S. <strong>Medical</strong> School Applicants, Enrollment,<br />
and Graduates, 1924–2011 Academic Years .....................................55<br />
Table 2: Number (%) of U.S. <strong>Medical</strong> School Applicants and<br />
Accepted Applicants by Race and Ethnicity, 1970–2001 .................58<br />
Table 3: Number of U.S. <strong>Medical</strong> School Applicants and Accepted<br />
Applicants by Race and Ethnicity, 2002–2011 .................................63<br />
Table 4: Number (%) of First-Year U.S. <strong>Medical</strong> Students by Race<br />
and Ethnicity, 1968–2002 ...................................................................64<br />
Table 5: Number of First-Year U.S. <strong>Medical</strong> School Enrollees by Race<br />
and Ethnicity, 2003–2011 ...................................................................67<br />
Table 6: Number (%) of Total U.S. <strong>Medical</strong> School Enrollees by Race<br />
and Ethnicity, 1968–2001 ...................................................................68<br />
3<br />
Association of American <strong>Medical</strong> Colleges
<strong>Diversity</strong> <strong>in</strong> <strong>Medical</strong> <strong>Education</strong>: <strong>Facts</strong> & <strong>Figures</strong> <strong>2012</strong><br />
Table of Contents Table 7: U.S. <strong>Medical</strong> School Total Enrollment by Race and<br />
Ethnicity, 2002–2011 ..........................................................................71<br />
Table 8: Number (%) of U.S. <strong>Medical</strong> School Graduates by Race and<br />
Ethnicity, 1971–2010 ..........................................................................72<br />
Table 9: Number (%) of Applicants, Accepted Applicants, and<br />
Matriculants to U.S. <strong>Medical</strong> Schools for Women, 1960–2011 ......75<br />
Table 10: U.S. <strong>Medical</strong> School Applicants, First-Time Applicants,<br />
Acceptants, and Matriculants by Gender and Race and<br />
Ethnicity, 2009–2011 ..........................................................................77<br />
Table 11: Undergraduate Institutions Supply<strong>in</strong>g ≥200 Applicants to<br />
U.S. <strong>Medical</strong> Schools, 2011 ................................................................78<br />
Table 12: Undergraduate Institutions Supply<strong>in</strong>g ≥50 Asian Applicants<br />
to U.S. <strong>Medical</strong> Schools, 2011 ...........................................................79<br />
Table 13: Undergraduate Institutions Supply<strong>in</strong>g ≥ 20 Black or African<br />
American Applicants to U.S. <strong>Medical</strong> Schools, 2011 .......................80<br />
Table 14: Undergraduate Institutions Supply<strong>in</strong>g ≥15 Hispanic or<br />
Lat<strong>in</strong>o Applicants to U.S. <strong>Medical</strong> Schools, 2011 ............................81<br />
Table 15: Undergraduate Institutions Supply<strong>in</strong>g ≥ 5 Mexican American<br />
Applicants to U.S. <strong>Medical</strong> Schools, 2011 ........................................82<br />
Table 16: Undergraduate Institutions Supply<strong>in</strong>g ≥3 American Indian<br />
and Alaska Native Applicants to U.S. <strong>Medical</strong> Schools, 2011 .........83<br />
Table 17: Undergraduate Institutions Supply<strong>in</strong>g ≥3 Puerto Rican<br />
Applicants to U.S. <strong>Medical</strong> Schools, 2011 ........................................84<br />
Table 18: Undergraduate Institutions Supply<strong>in</strong>g ≥140 White Applicants<br />
to U.S. <strong>Medical</strong> Schools, 2011 ...........................................................85<br />
Table 19: Undergraduate Institutions Produc<strong>in</strong>g ≥8 Black or African<br />
American <strong>Medical</strong> School Graduates, 2011 ......................................86<br />
Table 20: Undergraduate Institutions Produc<strong>in</strong>g ≥2 American Indian<br />
or Alaska Native <strong>Medical</strong> School Graduates, 2011 ..........................87<br />
Table 21: Undergraduate Institutions Produc<strong>in</strong>g ≥8 Hispanic or Lat<strong>in</strong>o<br />
<strong>Medical</strong> School Graduates, 2011 .......................................................88<br />
Table 22: Undergraduate Institutions Produc<strong>in</strong>g ≥20 Asian <strong>Medical</strong><br />
School Graduates, 2011 ......................................................................89<br />
Table 23: Undergraduate Institutions Produc<strong>in</strong>g ≥65 White <strong>Medical</strong><br />
School Graduates, 2011 ......................................................................90<br />
Table 24a: U.S. <strong>Medical</strong> Schools by Number of Applications (≥300) from<br />
Blacks or African Americans, 2011 ....................................................91<br />
Table 24b: U.S. <strong>Medical</strong> Schools by Number of Black or African American<br />
Matriculants (≥10), 2011 ....................................................................92<br />
4<br />
Association of American <strong>Medical</strong> Colleges
Table of Contents<br />
<strong>Diversity</strong> <strong>in</strong> <strong>Medical</strong> <strong>Education</strong>: <strong>Facts</strong> & <strong>Figures</strong> <strong>2012</strong><br />
Table 25a: U.S. <strong>Medical</strong> Schools by Number of Applications (≥400)<br />
from Hispanics or Lat<strong>in</strong>os, 2011 .......................................................93<br />
Table 25b: U.S. <strong>Medical</strong> Schools by Number of Hispanic or Lat<strong>in</strong>o<br />
Matriculants (≥ 15), 2011 ...................................................................94<br />
Table 26a: U.S. <strong>Medical</strong> Schools by Number of Applications (≥8) from<br />
American Indians and Alaska Natives, 2011 ....................................95<br />
Table 26b: U.S. <strong>Medical</strong> Schools by Number of American Indians and<br />
Alaska Native Matriculants, 2011 ......................................................96<br />
Table 27a: U.S. <strong>Medical</strong> Schools by Number of Applications (≥1,500)<br />
from Asians, 2011 ...............................................................................97<br />
Table 27b: U.S. <strong>Medical</strong> Schools by Number of Asian Matriculants (≥ 35),<br />
2011 ......................................................................................................98<br />
Table 28a: U.S. <strong>Medical</strong> Schools by Number of Applications (≥ 2,500)<br />
from Whites, 2011 ..............................................................................99<br />
Table 28b: U.S. <strong>Medical</strong> Schools by Number of White Matriculants<br />
(≥ 100), 2011 ......................................................................................100<br />
Table 29a: Number of U.S. <strong>Medical</strong> School Applicants by Race and<br />
Ethnicity (Alone, and <strong>in</strong> Comb<strong>in</strong>ation), 2002–2011 .....................101<br />
Table 29b: Percentage of U.S. <strong>Medical</strong> School Applicants by Race and<br />
Ethnicity (Alone, and <strong>in</strong> Comb<strong>in</strong>ation), 2002–2011 .....................102<br />
Table 30: U.S. <strong>Medical</strong> School Applicants, First-Time Applicants,<br />
Acceptants, Matriculants, and Graduates by Gender,<br />
2002–2011 .......................................................................................103<br />
Table 31: U.S. <strong>Medical</strong> School Applicants by State, <strong>Medical</strong> School,<br />
Gender, and Race and Ethnicity, 2011 ...........................................104<br />
Table 32: U.S. <strong>Medical</strong> School Matriculants by State, <strong>Medical</strong> School,<br />
Gender, and Race and Ethnicity, 2011 ............................................118<br />
Table 33: Total Enrollment by U.S. <strong>Medical</strong> School and Gender,<br />
2007–2011 .......................................................................................130<br />
Table 34: U.S. <strong>Medical</strong> School Total Enrollment by Gender and Race<br />
and Ethnicity, 2002–2011 .................................................................134<br />
Table 35: Number of Graduates by State, U.S. <strong>Medical</strong> School, Gender,<br />
and Race and Ethnicity, 2011 ..........................................................135<br />
Table 36: U.S. <strong>Medical</strong> School M.D./Ph.D. Graduates by Race and<br />
Ethnicity, 1980–2011 ........................................................................146<br />
Table 37a: MCAT Scores and GPAs for U.S. <strong>Medical</strong> School Applicants<br />
by Race and Ethnicity, 2011 .............................................................147<br />
Table 37b: MCAT Scores and GPAs for U.S. <strong>Medical</strong> School<br />
Matriculants by Race and Ethnicity, 2011 ......................................147<br />
5<br />
Association of American <strong>Medical</strong> Colleges
Table of Contents<br />
<strong>Diversity</strong> <strong>in</strong> <strong>Medical</strong> <strong>Education</strong>: <strong>Facts</strong> & <strong>Figures</strong> <strong>2012</strong><br />
Table 38: Level of <strong>Education</strong> Indebtedness of <strong>Medical</strong> School<br />
Graduates by Race and Ethnicity and School Type, 2011 .............148<br />
Table 39: U.S. <strong>Medical</strong> School Graduates Report<strong>in</strong>g Specialty by<br />
Race and Ethnicity, 2011 ..................................................................149<br />
U.S. <strong>Medical</strong> School Faculty<br />
Table 40: U.S. <strong>Medical</strong> School Faculty by Gender and Race and<br />
Ethnicity, 2007–2011 ........................................................................150<br />
Table 41: U.S. <strong>Medical</strong> School Faculty by Gender, Race and<br />
Ethnicity, and Rank, 2011 ................................................................151<br />
Table 42: U.S. <strong>Medical</strong> School Faculty by Gender, Race and<br />
Ethnicity, and Degree, 2011 .............................................................152<br />
Table 43: U.S. <strong>Medical</strong> School Faculty by Gender, Race and<br />
Ethnicity, and Department, 2011 ....................................................153<br />
<strong>Medical</strong> <strong>Education</strong> Pipel<strong>in</strong>e<br />
Table 44: Total Fall Enrollment <strong>in</strong> Degree-Grant<strong>in</strong>g Institutions by<br />
Race and Ethnicity of Student and Type and Control of<br />
Institution: Selected Years, 1980–2009 ...........................................154<br />
Table 45: Fall Enrollment <strong>in</strong> Degree-Grant<strong>in</strong>g Institutions by Race<br />
and Ethnicity of Students and State of Jurisdiction: 2009 .............155<br />
Table 46: First Professional Degrees Conferred by Degree-Grant<strong>in</strong>g<br />
Institutions <strong>in</strong> Dentistry, Medic<strong>in</strong>e, and Law by Number of<br />
Institutions Conferr<strong>in</strong>g Degrees and Gender of Student:<br />
Selected Years, 1949–2008................................................................156<br />
Table 47: First Professional Degrees Conferred by Control of Degree-<br />
Grant<strong>in</strong>g Institution and Field of Study: Selected Years,<br />
1985–2008 ........................................................................................157<br />
Table 48: Bachelor’s Degrees Conferred by Degree-Grant<strong>in</strong>g<br />
Institutions, Race and Ethnicity, and Gender of Student:<br />
Selected Years, 1976–2008 ...............................................................158<br />
Table 49: Bachelor’s Degrees Conferred by Gender, Race and<br />
Ethnicity, and Selected Major Field of Study, 2006–2009 .............160<br />
U.S. Census<br />
Table 50: Intercensal Estimates of the Population by Gender, Race,<br />
and Hispanic Orig<strong>in</strong> for the United States: April 1, 2000 to<br />
July 1, 2010 ........................................................................................161<br />
6<br />
Association of American <strong>Medical</strong> Colleges
About this Document<br />
<strong>Diversity</strong> <strong>in</strong> <strong>Medical</strong> <strong>Education</strong>: <strong>Facts</strong> & <strong>Figures</strong> <strong>2012</strong><br />
The Association of American <strong>Medical</strong><br />
Colleges (<strong>AAMC</strong>) is pleased to present<br />
<strong>Diversity</strong> <strong>in</strong> <strong>Medical</strong> <strong>Education</strong>: <strong>Facts</strong> &<br />
<strong>Figures</strong> <strong>2012</strong>, the 17th databook <strong>in</strong> the<br />
<strong>Facts</strong> & <strong>Figures</strong> Data Series.<br />
This publication provides students,<br />
medical educators and adm<strong>in</strong>istrators,<br />
researchers, policymakers, and the<br />
general public with a compendium of<br />
detailed statistical <strong>in</strong>formation on race<br />
and ethnicity and gender <strong>in</strong> medical<br />
education <strong>in</strong> the United States for<br />
the 2011 academic year as well as<br />
nearly a decade’s worth of trend<strong>in</strong>g<br />
<strong>in</strong>formation for select topics. The<br />
publication also <strong>in</strong>cludes data related<br />
to the pre-college component of the<br />
education pipel<strong>in</strong>e lead<strong>in</strong>g to the M.D.<br />
degree and other health sciences and<br />
health professions careers.<br />
S<strong>in</strong>ce 2002, medical school applicants<br />
have had the option of report<strong>in</strong>g both<br />
their race and ethnicity—alone or <strong>in</strong><br />
comb<strong>in</strong>ation with some other race<br />
or ethnicity. This report<strong>in</strong>g option<br />
means that data start<strong>in</strong>g from 2002<br />
are not directly comparable to earlier<br />
years. For the purposes of this report,<br />
most of the race and ethnicity data<br />
reported <strong>in</strong> the figures are for one<br />
“race alone;” <strong>in</strong>dividuals who reported<br />
more than one race or ethnicity are<br />
<strong>in</strong>cluded under “More than One Non-<br />
Hispanic or Lat<strong>in</strong>o Race,” “Multiple<br />
Race,” or “Multiple/Hispanic/Lat<strong>in</strong>o.”<br />
Individuals that selected other races<br />
are classified under “Other Non-<br />
Hispanic or Lat<strong>in</strong>o Race.”<br />
7<br />
The <strong>Facts</strong> & <strong>Figures</strong> Data Series<br />
is supported, <strong>in</strong> part, by a grant<br />
from the Robert Wood Johnson<br />
Foundation. The Foundation’s<br />
longtime support of this publication<br />
as well as other diversity <strong>in</strong>itiatives is<br />
greatly appreciated.<br />
Furthermore, considerable <strong>AAMC</strong><br />
staff effort is <strong>in</strong>volved <strong>in</strong> extract<strong>in</strong>g<br />
the data, produc<strong>in</strong>g figures and tables,<br />
and writ<strong>in</strong>g the general narrative<br />
descriptions and thus reflects the<br />
dedication and contribution of the<br />
follow<strong>in</strong>g research staff from the<br />
<strong>Diversity</strong> Policy and Programs unit of<br />
the <strong>AAMC</strong>: Lutheria Peters, M.P.H.,<br />
Sarah Schoolcraft, M.S., Kehua Zhang,<br />
Ph.D., Anne Berl<strong>in</strong>, M.A., and Kate<br />
Gampfer. We also want to thank the<br />
follow<strong>in</strong>g DPP and wider <strong>AAMC</strong><br />
staff for their guidance and expertise:<br />
Norma Poll-Hunter, Ph.D., Coll<strong>in</strong>s<br />
Mikesell, A.L.M., Henry Sondheimer,<br />
M.D., L<strong>in</strong>dsay Roskovensky, L<strong>in</strong>gl<strong>in</strong>g<br />
Xie, Rae Sloane, and former DPP<br />
Director of Policy, Research and<br />
Knowledge Development, Gwen<br />
Garrison, Ph.D.<br />
We will cont<strong>in</strong>ue our efforts to meet<br />
readers’ needs for data on race,<br />
ethnicity, and gender <strong>in</strong> medical<br />
education and physician workforce.<br />
We welcome feedback regard<strong>in</strong>g this<br />
edition and suggestions for further<br />
editions of <strong>Facts</strong> & <strong>Figures</strong>.<br />
Marc Nivet, Ed.D.<br />
Chief <strong>Diversity</strong> Officer<br />
Laura Castillo-Page, Ph.D.<br />
Senior Director, <strong>Diversity</strong> Policy<br />
and Programs and Organizational<br />
Capacity Build<strong>in</strong>g Portfolio<br />
Association of American <strong>Medical</strong> Colleges
I. Emerg<strong>in</strong>g Topic:<br />
The Importance of<br />
Creat<strong>in</strong>g Diverse<br />
and Inclusive<br />
Environments<br />
<strong>Diversity</strong> <strong>in</strong> <strong>Medical</strong> <strong>Education</strong>: <strong>Facts</strong> & <strong>Figures</strong> <strong>2012</strong><br />
<strong>Diversity</strong> has long been viewed as<br />
a tool to enhance education, and<br />
research has shown that thoughtful,<br />
strategic diversity efforts can lead<br />
to improved cognitive and social<br />
outcomes among students. 1–3<br />
Furthermore, studies suggest be<strong>in</strong>g<br />
educated <strong>in</strong> diverse environments<br />
has long-term effects on psychosocial<br />
outcomes such as personal growth<br />
and sense of purpose. 4 Beyond these<br />
<strong>in</strong>dividual benefits, recent scholarship<br />
<strong>in</strong>dicates that diversity better enables<br />
<strong>in</strong>stitutions and organizations to<br />
excel. For <strong>in</strong>stance, teams comprised<br />
of vary<strong>in</strong>g viewpo<strong>in</strong>ts, perspectives,<br />
ideas, and backgrounds tend to<br />
outperform homogenous ones on<br />
problem solv<strong>in</strong>g tasks. 5<br />
The benefits of diversity, however,<br />
aren’t grounded <strong>in</strong> its mere existence;<br />
rather, for diversity’s true power to be<br />
realized, it must be embraced as core<br />
to an <strong>in</strong>stitution’s culture and valued<br />
<strong>in</strong> its climate. 6 Many def<strong>in</strong>itions<br />
of climate and culture exist <strong>in</strong> the<br />
literature. Climate, for example,<br />
can be def<strong>in</strong>ed as the perceptions,<br />
attitudes and behaviors reflect<strong>in</strong>g<br />
an <strong>in</strong>stitution’s culture. Culture can<br />
then be understood as deeply <strong>in</strong>stilled<br />
values and beliefs. 7 Both climate and<br />
culture have been shown to have a<br />
profound impact on organizational<br />
productivity. In the organizational<br />
literature, perceived pro-diversity<br />
climates by both employees and<br />
managers have been found to have<br />
significant, positive effects on key<br />
bus<strong>in</strong>ess <strong>in</strong>dicators, such as sales<br />
growth, employee attendance and<br />
retention. 8–10<br />
Perceptions of climate may vary<br />
across diverse <strong>in</strong>dividuals, even<br />
with<strong>in</strong> the same environment.<br />
9<br />
A study conducted with nearly<br />
3,000 employees with<strong>in</strong> the same<br />
organization found Caucasian men<br />
perceived the organization as more<br />
fair and <strong>in</strong>clusive than did Caucasian<br />
women, or men and women<br />
from racial and ethnic m<strong>in</strong>ority<br />
backgrounds. 11 Similar results have<br />
been found <strong>in</strong> the higher education<br />
literature. One review of <strong>in</strong>stitutional<br />
climate assessments <strong>in</strong>dicates that<br />
students from racial or ethnic<br />
m<strong>in</strong>ority backgrounds perceive more<br />
racial conflict and tension than their<br />
White counterparts. 12 Therefore,<br />
identification of the strengths and<br />
weaknesses of an <strong>in</strong>stitution as it<br />
relates to diversity, as well as the<br />
beliefs and perspectives of those<br />
with<strong>in</strong> that <strong>in</strong>stitution, are critical first<br />
steps <strong>in</strong> creat<strong>in</strong>g diverse and <strong>in</strong>clusive<br />
environments.<br />
To that end, many medical schools<br />
are beg<strong>in</strong>n<strong>in</strong>g to assess the climate<br />
and culture of their <strong>in</strong>stitutions.<br />
Attempts to assess climate and culture<br />
are legion, and at least one review<br />
of the literature identified over<br />
70 exist<strong>in</strong>g assessments. 13 Many of<br />
these assessments are grounded <strong>in</strong><br />
conceptual frameworks illustrat<strong>in</strong>g<br />
multiple aspects of culture and<br />
climate. One of the more widely<br />
cited frameworks outl<strong>in</strong>es five<br />
aspects of campus climate, and<br />
encourages researchers to collect<br />
qualitative and quantitative data<br />
regard<strong>in</strong>g their <strong>in</strong>stitution’s historical<br />
legacy of <strong>in</strong>clusion or exclusion,<br />
its compositional diversity, its<br />
organizational/structural diversity,<br />
the psychological perceptions of<br />
campus climate, and the behavioral<br />
dimension of diversity. 2 Additionally,<br />
recent research calls for perusal of<br />
an <strong>in</strong>stitution’s documents, such as<br />
Association of American <strong>Medical</strong> Colleges
I. Emerg<strong>in</strong>g Topic:<br />
The Importance of<br />
Creat<strong>in</strong>g Diverse<br />
and Inclusive<br />
Environments<br />
(cont<strong>in</strong>ued)<br />
<strong>Diversity</strong> <strong>in</strong> <strong>Medical</strong> <strong>Education</strong>: <strong>Facts</strong> & <strong>Figures</strong> <strong>2012</strong><br />
diversity action plans, to ensure that<br />
language does not <strong>in</strong>advertently<br />
marg<strong>in</strong>alize or segregate <strong>in</strong>dividuals<br />
from typically underrepresented<br />
backgrounds. 14 This comb<strong>in</strong>ed<br />
<strong>in</strong>formation, when analyzed and<br />
<strong>in</strong>terpreted, allows an <strong>in</strong>stitution to<br />
identify its strengths and p<strong>in</strong>po<strong>in</strong>t<br />
areas for improvement as it strives to<br />
move diversity and <strong>in</strong>clusion from<br />
its periphery to its core.<br />
Assess<strong>in</strong>g <strong>in</strong>stitutional climate<br />
and culture can be a significant<br />
time <strong>in</strong>vestment, and researchers<br />
undertak<strong>in</strong>g such an endeavor are<br />
faced with unique methodological<br />
challenges and considerations. 15<br />
However, truly <strong>in</strong>clusive<br />
environments are <strong>in</strong>tr<strong>in</strong>sically tied<br />
to collaboration, <strong>in</strong>novation and,<br />
ultimately, academic excellence. 6<br />
When recogniz<strong>in</strong>g that diversity<br />
10<br />
and <strong>in</strong>clusion are powerful tools for<br />
enhanc<strong>in</strong>g the medical education<br />
environment and ultimately the<br />
overall health of the nation, the<br />
pros of such an endeavor clearly<br />
outweigh the cons. Creat<strong>in</strong>g and<br />
support<strong>in</strong>g opportunities for<br />
medical students to comb<strong>in</strong>e their<br />
differ<strong>in</strong>g backgrounds, perspectives<br />
and skills as they work together<br />
to solve problems will enhance<br />
their ability to work with diverse<br />
peers and patients as they enter<br />
the workforce. Thus, diversity and<br />
excellence <strong>in</strong> medical education<br />
<strong>in</strong>evitably leads to excellence<br />
<strong>in</strong> health care, as physicians<br />
channel and leverage their diverse<br />
backgrounds, experiences, and skill<br />
sets to create new, effective ways to<br />
manage health and deliver care.<br />
Association of American <strong>Medical</strong> Colleges
References<br />
<strong>Diversity</strong> <strong>in</strong> <strong>Medical</strong> <strong>Education</strong>: <strong>Facts</strong> & <strong>Figures</strong> <strong>2012</strong><br />
1. Gur<strong>in</strong> P, Dey EL, Hurtado S,<br />
Gur<strong>in</strong> G. <strong>Diversity</strong> and higher<br />
education: Theory and impact on<br />
educational outcomes. Harv Edu<br />
Rev. 2002;72(3):330–366.<br />
2. Milem JF. The educational benefits<br />
of diversity: Evidence from multiple<br />
sectors. In: Chang M, Witt<br />
D, Jones J, Hakuta K. Compell<strong>in</strong>g<br />
Interest: Exam<strong>in</strong><strong>in</strong>g the Evidence<br />
on Racial Dynamics <strong>in</strong> Higher<br />
<strong>Education</strong>. Palo Alto, Ca: Stanford<br />
University Press; 2003.<br />
3. Milem JF, O’Brien C, M<strong>in</strong>er<br />
D, et al. The Important Role<br />
that Diverse Students Play <strong>in</strong><br />
Shap<strong>in</strong>g the <strong>Medical</strong> School<br />
Curriculum. http://www.coe.<br />
arizona.edu/sites/default/files/<br />
Milem,O’Brien,M<strong>in</strong>er,Bryan,Cast<br />
illo-Page,Schoolcraft(<strong>2012</strong>)-The_<br />
Important_Role_that_Diverse_<br />
Students_Play_<strong>in</strong>_Shap<strong>in</strong>g_the_<br />
<strong>Medical</strong>_School_Curriculum.pdf.<br />
Published <strong>2012</strong>.<br />
4. Bowman NA, Brandenberger<br />
JW, Hill PL, Lapsley DK. The<br />
long-term effects of college diversity<br />
experiences: Well-be<strong>in</strong>g and<br />
social concerns 13 years after<br />
graduation. J Coll Stud Dev.<br />
2011;52(6):729–739.<br />
5. Page SE. The Difference: How<br />
the Power of <strong>Diversity</strong> Creates<br />
Better Groups, Firms, Schools and<br />
Societies. Pr<strong>in</strong>ceton, NJ: Pr<strong>in</strong>ceton<br />
University Press; 2007.<br />
6. Nivet MA. Commentary: <strong>Diversity</strong><br />
3.0: A necessary systems<br />
upgrade. Acad Med. 2011;86(12):<br />
1487–1489.<br />
7. Peterson MW, Spencer MG.<br />
Understand<strong>in</strong>g academic culture<br />
and climate. New Dir Inst Res.<br />
1990;63:3–18.<br />
11<br />
8. McKay PF, Avery DR, Morris MA.<br />
A tale of two climates: <strong>Diversity</strong><br />
climate from subord<strong>in</strong>ates’ and<br />
managers’ perspectives and<br />
their role <strong>in</strong> store unit sales<br />
performance. Pers Psychol.<br />
2009;62(4):767–791.<br />
9. Avery DR, McKay PF, Wilson DC,<br />
Tonidandel S. Unequal attendance:<br />
The relationships between race,<br />
organizational diversity cues,<br />
and absenteeism. Pers Psychol.<br />
2007;60:875–901.<br />
10. McKay PF, Avery DR, Tonidandel<br />
S, Morris MA, Hernandez M,<br />
Hebl MR. Racial differences <strong>in</strong><br />
employee retention: Are diversity<br />
climate perceptions the key? Pers<br />
Psychol. 2007;60:35–62.<br />
11. Mor Barak ME, Cher<strong>in</strong> DA,<br />
Berkman S. Organizational and<br />
personal dimensions <strong>in</strong> diversity<br />
climate; Ethnic and gender differences<br />
<strong>in</strong> employee perceptions.<br />
J Appl Behav Sci. 1998;34:82–104.<br />
12. Haper SR, Hurtado S. N<strong>in</strong>e<br />
Themes <strong>in</strong> Campus Racial<br />
Climates and Implications for<br />
Institutional Transformation. New<br />
Dir Stud Serv. 2007;120:7–24.<br />
13. Jung T, Scott T, Davies, HTO,<br />
et al. Instruments for explor<strong>in</strong>g<br />
organizational culture: A review<br />
of the literature. Public Adm Rev.<br />
2009;69(6):1087–1096.<br />
14. Iverson SV. Construct<strong>in</strong>g outsiders:<br />
The discursive fram<strong>in</strong>g<br />
of access <strong>in</strong> university diversity<br />
policies. Rev High Educ.<br />
<strong>2012</strong>;35(2):149–177.<br />
15. Castillo-Page L, Milem J, O’Brien C,<br />
Schoolcraft S. Campus climate <strong>in</strong><br />
the medical school sett<strong>in</strong>g: What<br />
we don’t know may hurt us. Acad<br />
Med. <strong>2012</strong>;87(10):1313.<br />
Association of American <strong>Medical</strong> Colleges
II. Trends <strong>in</strong><br />
<strong>Medical</strong> <strong>Education</strong><br />
<strong>Diversity</strong> <strong>in</strong> <strong>Medical</strong> <strong>Education</strong>: <strong>Facts</strong> & <strong>Figures</strong> <strong>2012</strong><br />
The figures that follow throughout<br />
this publication illustrate a few<br />
noteworthy trends. Similar to years<br />
past, the pool of medical school<br />
applicants cont<strong>in</strong>ues to <strong>in</strong>crease<br />
(Figure 1). In 2011, nearly half<br />
of the applicants to U.S. medical<br />
schools were nonwhite, and Asians<br />
accounted for the second largest<br />
group of applicants (Figure 2).<br />
Consistent with the demographic<br />
shift of young adults <strong>in</strong> America<br />
from a predom<strong>in</strong>antly Caucasian<br />
to a non-majority population, it<br />
is noteworthy that the number of<br />
Caucasian applicants has dropped<br />
approximately 26% over the past<br />
three decades. Additionally, these<br />
figures po<strong>in</strong>t to <strong>in</strong>creases among<br />
all races and ethnicities <strong>in</strong> <strong>in</strong>tent to<br />
specialize <strong>in</strong> family practice, <strong>in</strong>ternal<br />
medic<strong>in</strong>e, or pediatrics s<strong>in</strong>ce 2005<br />
(Figure 29). However, there are<br />
two trends that deserve particular<br />
emphasis. The first is the persistent<br />
decl<strong>in</strong>e <strong>in</strong> Black or African American<br />
male medical school first-time<br />
applicants, accepted applicants, and<br />
matriculants (<strong>Figures</strong> 4, 11, and<br />
13). Second, the figures <strong>in</strong>dicate the<br />
cont<strong>in</strong>ued need to attract medical<br />
school faculty from racially and<br />
ethnically underrepresented m<strong>in</strong>ority<br />
backgrounds (Figure 20).<br />
Strengthen<strong>in</strong>g the Male Pipel<strong>in</strong>e<br />
Among applicants, accepted<br />
applicants, matriculants, and<br />
graduates, women have reached parity<br />
or surpassed their male counterparts<br />
with only a few exceptions by racial<br />
or ethnic group (<strong>Figures</strong> 4, 9, 11, and<br />
13). In particular, Black or African<br />
American women are apply<strong>in</strong>g to,<br />
be<strong>in</strong>g accepted to, matriculat<strong>in</strong>g <strong>in</strong>to,<br />
and graduat<strong>in</strong>g from U.S. medical<br />
schools <strong>in</strong> much greater numbers<br />
12<br />
than Black or African American men<br />
(<strong>Figures</strong> 4, 9, 11, and 13). In fact,<br />
women comprise approximately twothirds<br />
of Black or African American<br />
applicants (Figure 4).<br />
This positive trend for racial and<br />
ethnic m<strong>in</strong>ority women is not<br />
mirrored <strong>in</strong> their male counterparts:<br />
Black or African American males are<br />
apply<strong>in</strong>g to, be<strong>in</strong>g accepted to, and<br />
matriculat<strong>in</strong>g <strong>in</strong>to medical school<br />
<strong>in</strong> dim<strong>in</strong>ish<strong>in</strong>g numbers, which<br />
speaks to the <strong>in</strong>creas<strong>in</strong>g need for<br />
medical schools to <strong>in</strong>stitute plans and<br />
<strong>in</strong>itiatives aimed at strengthen<strong>in</strong>g<br />
the pipel<strong>in</strong>e. This pattern extends<br />
<strong>in</strong>to many of the science, technology,<br />
eng<strong>in</strong>eer<strong>in</strong>g, and math (STEM)<br />
fields as well. In response, <strong>in</strong>itiatives<br />
have been launched throughout the<br />
country <strong>in</strong> hopes of revers<strong>in</strong>g this<br />
trend and produc<strong>in</strong>g more graduates.<br />
<strong>Medical</strong> schools are already <strong>in</strong>vest<strong>in</strong>g<br />
<strong>in</strong> pipel<strong>in</strong>e programs, but it is clear<br />
that additional targeted efforts are<br />
necessary.<br />
Diversify<strong>in</strong>g Faculty<br />
The underrepresentation of various<br />
racial and ethnic groups among<br />
medical school faculty cont<strong>in</strong>ues<br />
to be apparent (<strong>Figures</strong> 18 and 19).<br />
Whites comprise approximately<br />
60 percent of U.S. medical school<br />
faculty, with Asians constitut<strong>in</strong>g<br />
13 percent of the pool; Hispanics<br />
or Lat<strong>in</strong>os comprise 4 percent,<br />
and Blacks or African Americans<br />
2.9 percent. Notably, this<br />
underrepresentation becomes starker<br />
among high-rank<strong>in</strong>g faculty.<br />
Therefore, these data not only<br />
demonstrate the cont<strong>in</strong>ued need to<br />
attract more diverse faculty candidates<br />
to the field of academic medic<strong>in</strong>e, but<br />
Association of American <strong>Medical</strong> Colleges
II. Trends <strong>in</strong><br />
<strong>Medical</strong> <strong>Education</strong><br />
(cont<strong>in</strong>ued)<br />
<strong>Diversity</strong> <strong>in</strong> <strong>Medical</strong> <strong>Education</strong>: <strong>Facts</strong> & <strong>Figures</strong> <strong>2012</strong><br />
also the need to create more <strong>in</strong>clusive<br />
environments <strong>in</strong> which diverse faculty<br />
thrive and ascend the ranks of academia.<br />
Responses from Enter<strong>in</strong>g<br />
<strong>Medical</strong> Students to Key Issues<br />
<strong>in</strong> <strong>Medical</strong> <strong>Education</strong><br />
Throughout the years, enter<strong>in</strong>g medical<br />
students (matriculants) have expressed<br />
concerns and provided <strong>in</strong>sights to<br />
various key medical education issues<br />
such as career choice, f<strong>in</strong>anc<strong>in</strong>g their<br />
medical education, <strong>in</strong>debtedness, and<br />
experiences with racial and ethnic<br />
diversity. In the past, this publication<br />
has provided snapshots of these<br />
questions to give constituents and<br />
policymakers some <strong>in</strong>sight <strong>in</strong>to the<br />
forthcom<strong>in</strong>g physician workforce. Black<br />
or African American matriculants have<br />
higher rates of premedical debt than<br />
other racial or ethnic groups (Figure<br />
24) and among all students carry<strong>in</strong>g<br />
premedical debt, most of it exceeds<br />
$25,000 (Figure 25). Most students<br />
mention be<strong>in</strong>g certa<strong>in</strong> that they want<br />
to be a practic<strong>in</strong>g cl<strong>in</strong>ical physician<br />
(Figure 28), and a grow<strong>in</strong>g number<br />
s<strong>in</strong>ce 2005 are seek<strong>in</strong>g to become<br />
general specialists <strong>in</strong> family medic<strong>in</strong>e,<br />
<strong>in</strong>ternal medic<strong>in</strong>e, and pediatrics<br />
(Figure 29). Black or African American<br />
and Asian matriculants, <strong>in</strong> particular,<br />
have expressed an even greater <strong>in</strong>terest<br />
than other racial and ethnic subgroups<br />
<strong>in</strong> general <strong>in</strong>ternal medic<strong>in</strong>e (Figure 29).<br />
While it is hoped that a wider expression<br />
of <strong>in</strong>terest <strong>in</strong> general specialties would<br />
translate <strong>in</strong>to care for the underserved,<br />
American Indian or Alaska Native, Asian,<br />
and White matriculants s<strong>in</strong>ce 2000 have<br />
become <strong>in</strong>creas<strong>in</strong>gly undecided about<br />
their <strong>in</strong>terest <strong>in</strong> serv<strong>in</strong>g the underserved.<br />
Black or African American and Hispanic<br />
or Lat<strong>in</strong>o matriculants have rema<strong>in</strong>ed<br />
13<br />
quite stable <strong>in</strong> their <strong>in</strong>terest regard<strong>in</strong>g<br />
serv<strong>in</strong>g the underserved (Figure 31).<br />
Look<strong>in</strong>g specifically at broader<br />
<strong>in</strong>stitutional culture and climate<br />
perceptions, the exposure to and<br />
experience with racial and ethnic<br />
diversity are key to understand<strong>in</strong>g<br />
and improv<strong>in</strong>g patient care as well as<br />
reduc<strong>in</strong>g health disparities. S<strong>in</strong>ce 2007,<br />
the <strong>AAMC</strong> has asked students about the<br />
composition of their neighborhoods,<br />
collegiate student body, and friends as<br />
well as how such <strong>in</strong>teractions might<br />
have shaped their experiences with<br />
and exposure to other po<strong>in</strong>ts of view<br />
(<strong>Figures</strong> 32–36). Black or African<br />
American and Hispanic or Lat<strong>in</strong>o<br />
matriculants are more likely to come<br />
from neighborhoods and colleges that<br />
are racially and ethnically diverse; nearly<br />
all subgroups have friends who are<br />
more diverse (<strong>Figures</strong> 32, 33, and 34).<br />
As a result, there appears to be greater<br />
experience with different racial and<br />
ethnic perspectives and an <strong>in</strong>creased<br />
sense of their overall <strong>in</strong>fluence on<br />
enter<strong>in</strong>g medical students’ knowledge<br />
and op<strong>in</strong>ions (<strong>Figures</strong> 35 and 36).<br />
Summary<br />
<strong>Medical</strong> schools and teach<strong>in</strong>g hospitals<br />
have taken great strides to attract students<br />
and faculty from various backgrounds to<br />
the field of medic<strong>in</strong>e. However, additional<br />
targeted efforts are necessary. To attract,<br />
reta<strong>in</strong>, and graduate more males from<br />
racial and ethnic m<strong>in</strong>ority backgrounds,<br />
it is imperative to focus attention,<br />
energy, and efforts on effective pipel<strong>in</strong>e<br />
programs. Similarly, medical schools that<br />
strive to create <strong>in</strong>clusive environments<br />
might better support both students<br />
and faculty represent<strong>in</strong>g a variety of<br />
races, ethnicities, ages, ability levels, and<br />
perspectives.<br />
Association of American <strong>Medical</strong> Colleges
Current Status of Racial and Ethnic<br />
M<strong>in</strong>orities <strong>in</strong> <strong>Medical</strong> <strong>Education</strong>
<strong>Diversity</strong> <strong>in</strong> <strong>Medical</strong> <strong>Education</strong>: <strong>Facts</strong> & <strong>Figures</strong> <strong>2012</strong><br />
III. Current Status of Racial and Ethnic M<strong>in</strong>orities <strong>in</strong><br />
<strong>Medical</strong> <strong>Education</strong><br />
U.S. <strong>Medical</strong> School Applicants<br />
Figure 1 displays the historical applicant pool trend from 1982 to 2011. Focus<strong>in</strong>g on just the last two years,<br />
2010 and 2011, the total number of applicants <strong>in</strong>creased 2.75%, to 43,919, and the number of women<br />
applicants <strong>in</strong>creased by 573, or 2.8%, compared with the previous year. The total number of first-time<br />
applicants <strong>in</strong> 2011 was 32,654, a 2.6% <strong>in</strong>crease relative to 2010.<br />
Figure 1: Number of U.S. <strong>Medical</strong> School Applicants by Gender, 1982–2011<br />
number of applicants<br />
30,000<br />
25,000<br />
20,000<br />
15,000<br />
10,000<br />
5,000<br />
0<br />
1982:<br />
men<br />
24,039<br />
1982:<br />
women<br />
11,681<br />
Source: <strong>AAMC</strong> Data Warehouse: Applicant Matriculant File, as of 1/26/<strong>2012</strong>.<br />
16<br />
year<br />
2011:<br />
men<br />
23,135<br />
2011:<br />
women<br />
20,780<br />
Women<br />
Men<br />
Association of American <strong>Medical</strong> Colleges
<strong>Diversity</strong> <strong>in</strong> <strong>Medical</strong> <strong>Education</strong>: <strong>Facts</strong> & <strong>Figures</strong> <strong>2012</strong><br />
Figure 2 illustrates the race and ethnicity of the 2011 applicant pool. Compared with 2010, <strong>in</strong> 2011 the<br />
percentage of Hispanic or Lat<strong>in</strong>o applicants <strong>in</strong>creased by 5.7% and the number of Black or African<br />
American applicants grew by 5%. However, there was a considerable decl<strong>in</strong>e of 11.4% for American<br />
Indians or Alaska Natives. In 2011, Hispanics or Lat<strong>in</strong>os and Blacks or African Americans comprised<br />
15.2% of all applicants, while American Indians or Alaska Natives (0.2%) and Native Hawaiians or Other<br />
Pacific Islanders (0.2%) comprised less than 1% of all applicants comb<strong>in</strong>ed.<br />
More than One Non-Hispanic<br />
or Lat<strong>in</strong>o Race 2.7% (1,197)<br />
Asian 20.4% (8,941)<br />
Figure 2: Percentage and Number of U.S. <strong>Medical</strong> School Applicants<br />
by Race and Ethnicity, 2011<br />
No Race Response 3.0%<br />
(1,304)<br />
Other Non-Hispanic or Lat<strong>in</strong>o<br />
Race 0.03% (13)<br />
*Incudes Cuban, Mexican American, Puerto Rican, Other Hispanic, and Multiple Hispanic.<br />
Source: <strong>AAMC</strong> Data Warehouse: Applicant Matriculant File, as of 1/26/<strong>2012</strong>.<br />
17<br />
Foriegn 3.75% (1,647)<br />
Hispanic or Lat<strong>in</strong>o* 7.9%<br />
(3,459)<br />
Black or African American 7.3%<br />
(3,215)<br />
American Indian or Alaska<br />
Native 0.2% (101)<br />
Native Hawaiian or Other<br />
Pacific Islander 0.2%<br />
(84)<br />
White 54.6%<br />
(23,958)<br />
Association of American <strong>Medical</strong> Colleges
<strong>Diversity</strong> <strong>in</strong> <strong>Medical</strong> <strong>Education</strong>: <strong>Facts</strong> & <strong>Figures</strong> <strong>2012</strong><br />
Figure 3 illustrates the race and ethnicity of the 2011 first-time applicant pool. In 2011, Hispanics or<br />
Lat<strong>in</strong>os and Blacks or African Americans represented 14.8% of all first-time applicants. Relative to<br />
2010, Black or African American and Hispanic or Lat<strong>in</strong>o first-time applicants <strong>in</strong>creased 6.8% and 8.0%,<br />
respectively. The percentage of first-time applicants was lowest for Other Non-Hispanics or Lat<strong>in</strong>os<br />
(0.03%), American Indians or Alaska Natives (0.2%), and Native Hawaiians or Other Pacific Islanders<br />
(0.2%) compared with other groups. The number of first-time applicants for American Indian or Alaska<br />
Native rema<strong>in</strong>ed the same as it was <strong>in</strong> 2010.<br />
Figure 3: Percentage and Number of First-Time U.S. <strong>Medical</strong> School Applicants<br />
by Race and Ethnicity, 2011<br />
Hispanic or Lat<strong>in</strong>o* 8.0%<br />
No Race Response 3.4%<br />
(2,619)<br />
(1,112) Foreign 4.0% (1,303)<br />
Other Non-Hispanic or Lat<strong>in</strong>o<br />
Race 0.03% (9)<br />
More than One Non-Hispanic<br />
or Lat<strong>in</strong>o Race 2.7% (878)<br />
Asian 20.0% (6,518)<br />
*Incudes Cuban, Mexican American, Puerto Rican, Other Hispanic, and Multiple Hispanic.<br />
Source: <strong>AAMC</strong> Data Warehouse:Applicant Matriculant File, as of 1/26/<strong>2012</strong>.<br />
18<br />
Black or African American<br />
6.8% (2,205)<br />
American Indian or Alaska<br />
Native 0.2% (78)<br />
Native Hawaiian or Other<br />
Pacific Islander 0.2% (63)<br />
White 54.7% (17,869)<br />
Association of American <strong>Medical</strong> Colleges
ace & ethnicity<br />
<strong>Diversity</strong> <strong>in</strong> <strong>Medical</strong> <strong>Education</strong>: <strong>Facts</strong> & <strong>Figures</strong> <strong>2012</strong><br />
Figure 4 displays the gender and race and ethnicity of the 2011 first-time applicant pool by percentage and<br />
number. The percentage of first-time female applicants was greatest for Other Non-Hispanic or Lat<strong>in</strong>o<br />
Race (77.8%) and Black or African American (65.1%) compared with other groups. Hispanic or Lat<strong>in</strong>o<br />
and American Indian or Alaska Native female first-time applicants equaled 53.3% and 51.3%, respectively.<br />
The percentage of male first-time applicants was greatest for White (54.2%) and No Race Response<br />
(52.6%) categories. The percentage of Asian and Foreign first-time applicants reflected near gender parity.<br />
Figure 4: Percentage and Number of First-Time U.S. <strong>Medical</strong> School Applicants<br />
by Gender and Race and Ethnicity, 2011<br />
American Indian or Alaska Native (n = 78)<br />
Asian (n = 6,518)<br />
Black or African American (n = 2,205)<br />
Hispanic or Lat<strong>in</strong>o* (n = 2,619)<br />
Native Hawaiian or Other Pacific Islander (n = 62)<br />
White (n = 17,868)<br />
Other Non-Hispanic or Lat<strong>in</strong>o Race (n = 9)<br />
More than One Non-Hispanic or Lat<strong>in</strong>o Race (n = 878)<br />
No Race Reponse (n = 1,111)<br />
Foreign (n = 1,303)<br />
Note: There were 4 students who did not report sex, so, they were excluded here.<br />
Includes Cuban, Mexican American, Puerto Rican, Other Hispanic, and Multiple Hispanic.<br />
Source: <strong>AAMC</strong> Data Warehouse: Applicant Matriculant File, as of 1/26/<strong>2012</strong>.<br />
19<br />
51.3%<br />
49.6%<br />
45.8%<br />
53.3%<br />
51.5%<br />
47.4%<br />
49.8%<br />
65.1%<br />
58.1%<br />
77.8%<br />
48.7%<br />
50.4%<br />
54.2%<br />
46.7%<br />
48.5%<br />
52.6%<br />
50.2%<br />
34.9%<br />
41.9%<br />
22.2%<br />
0% 20% 40% 60% 80% 100%<br />
percentage of first-time applicants<br />
Women Men<br />
Association of American <strong>Medical</strong> Colleges
number of applicants<br />
35,000<br />
30,000<br />
25,000<br />
20,000<br />
15,000<br />
10,000<br />
5,000<br />
0<br />
<strong>Diversity</strong> <strong>in</strong> <strong>Medical</strong> <strong>Education</strong>: <strong>Facts</strong> & <strong>Figures</strong> <strong>2012</strong><br />
Figure 5 illustrates the historical trend for the applicant pool from 1977 to 2011 by major racial and ethnic<br />
subgroups. Compared with 1977, <strong>in</strong> 2011 the number of Hispanic or Lat<strong>in</strong>o applicants more than tripled<br />
(3,459 compared with 955) and the number of Black or African American applicants grew 36%, from<br />
2,361 to 3,215. S<strong>in</strong>ce 1977, the percentage of American Indian or Alaska Native applicants decl<strong>in</strong>ed by<br />
19%, from 124 to 101.<br />
Figure 5: Number of U.S. <strong>Medical</strong> School Applicants by Race and Ethnicity, 1977–2011<br />
1977:<br />
White (32,210)<br />
1977:<br />
Black or African American ( 2,361)<br />
Asian ( 966)<br />
Hispanic or Lat<strong>in</strong>o* (955)<br />
American Indian or Alaska Native (124)<br />
Note: White, Asian, Black, and Native American, are Non-Hispanic. S<strong>in</strong>ce 2002, <strong>in</strong>dividuals have the option of report<strong>in</strong>g both their<br />
race and ethnicity alone or <strong>in</strong> comb<strong>in</strong>ation with some other race or ethnicity. In this figure, numbers are reported for race alone.<br />
*From 1974–2001, - <strong>in</strong>cludes Mexican American, Puerto Rican, and Other Hispanic. S<strong>in</strong>ce 2002, <strong>in</strong>cludes Cuban, Mexican American,<br />
Puerto Rican, Other Hispanic, and Multiple Hispanic.<br />
Source: <strong>AAMC</strong> Data Warehouse: Applicant Matriculant File, as of 1/26/<strong>2012</strong>.<br />
20<br />
year<br />
2011:<br />
Asian (8,941)<br />
Hispanic or Lat<strong>in</strong>o* (3,459)<br />
Black or African American (3,215)<br />
American Indian or Alaska Native (101)<br />
Black or African American<br />
American Indian or Alaska Native<br />
Hispanic or Lat<strong>in</strong>o<br />
Asian<br />
White<br />
2011:<br />
White (23,958)<br />
Association of American <strong>Medical</strong> Colleges
number of applicants<br />
1,600<br />
1,400<br />
1,200<br />
1,000<br />
800<br />
600<br />
400<br />
200<br />
0<br />
238<br />
265<br />
302<br />
<strong>Diversity</strong> <strong>in</strong> <strong>Medical</strong> <strong>Education</strong>: <strong>Facts</strong> & <strong>Figures</strong> <strong>2012</strong><br />
Figure 6 displays specific <strong>in</strong>formation on Hispanic or Lat<strong>in</strong>o subgroups. Compared with 2009, <strong>in</strong> 2011<br />
the percentage of medical school applicants was greatest among three subgroups: Other Hispanics, 45.2%;<br />
Cubans, 26.9%; and Multi-Hispanics, 29.2%. In contrast, Mexican American and Puerto Rican applicants<br />
decl<strong>in</strong>ed by 16.6% and 0.9%, respectively.<br />
978<br />
21<br />
816<br />
734 722<br />
683 677<br />
1,024<br />
1,402<br />
1,487<br />
Cuban Mexican American Puerto Rican<br />
Hispanic or Lat<strong>in</strong>o ethnicity<br />
Other Hispanic Multi-Hispanic*<br />
Year 2009<br />
*S<strong>in</strong>ce 2002, <strong>in</strong>dividuals have the option of report<strong>in</strong>g more than one Hispanic ethnicity.<br />
Source: <strong>AAMC</strong> Data Warehouse: Applicant Matriculant File, as of 1/26/<strong>2012</strong>.<br />
Figure 6: Number of U.S. <strong>Medical</strong> School Applicants by Hispanic<br />
or Lat<strong>in</strong>o Subgroup, 2009–2011<br />
137<br />
148<br />
177<br />
Year 2010<br />
Year 2011<br />
Association of American <strong>Medical</strong> Colleges
<strong>Diversity</strong> <strong>in</strong> <strong>Medical</strong> <strong>Education</strong>: <strong>Facts</strong> & <strong>Figures</strong> <strong>2012</strong><br />
Figure 7 displays specific <strong>in</strong>formation on Asian subgroups. In 2011, the three largest Asian subgroups were<br />
Asian Indian (29.2%), Ch<strong>in</strong>ese (24.7%), and Other Asians (13.9%). The three smallest Asian subgroups<br />
were Japanese (3.7%), Filip<strong>in</strong>o (4.8%), and Pakistani (5.5%) applicants.<br />
Figure 7: Percentage of U.S. <strong>Medical</strong> School Applicants by Asian Subgroups, 2011<br />
Other Asian 13.9% (1,555)<br />
Vietnamese 7.8% (876)<br />
Korean 10.4% (1,164)<br />
Japanese 3.7% (410)<br />
Filip<strong>in</strong>o 4.8% (543)<br />
Pakistani 5.5% (616)<br />
Note: In this figure numbers are reported for Non-Hispanic race alone or <strong>in</strong> comb<strong>in</strong>ation.<br />
Source: <strong>AAMC</strong> Data Warehouse: Applicant Matriculant File, as of 2/8/12.<br />
22<br />
Ch<strong>in</strong>ese 24.7% (2,762)<br />
Asian Indian 29.2% (3,270)<br />
Association of American <strong>Medical</strong> Colleges
year^ and sex<br />
2011 2010 2009<br />
<strong>Diversity</strong> <strong>in</strong> <strong>Medical</strong> <strong>Education</strong>: <strong>Facts</strong> & <strong>Figures</strong> <strong>2012</strong><br />
Figure 8 demonstrates the gender, race, and ethnicity of the applicant pool by percentage for 2009 through<br />
2011. Dur<strong>in</strong>g these three years, Black or African American women represented 65% or greater of any major<br />
subgroup, and the percentage of applicants who were American Indian or Alaska Native women decl<strong>in</strong>ed<br />
gradually from 54.1% to 52.5%. In 2010, the percentage of Hispanic/Lat<strong>in</strong>a women decl<strong>in</strong>ed to 50.7%,<br />
even greater than the 2011 decl<strong>in</strong>e of 52.2%.<br />
Men (n = 19,982)<br />
Women (n = 18,287)<br />
Men (n = 20,371)<br />
Women (n = 18,152)<br />
Men (n = 20,961)<br />
Women (n = 18,712)<br />
23<br />
32.5%<br />
34.6%<br />
34.4%<br />
45.8%<br />
45.9%<br />
43.9%<br />
49.3%<br />
46.5%<br />
43.6%<br />
43.6%<br />
49.1%<br />
48.7%<br />
47.8%<br />
47.5%<br />
52.2%<br />
52.5%<br />
56.1%<br />
54.2%<br />
54.1%<br />
50.7%<br />
53.5%<br />
48.0%<br />
50.9%<br />
51.3%<br />
52.0%<br />
56.4%<br />
56.4%<br />
67.5%<br />
65.4%<br />
65.6%<br />
0.0% 10.0% 20.0% 30.0% 40.0% 50.0% 60.0% 70.0% 80.0%<br />
percentage of applicants<br />
Note: Asian, Black, and Native American are Non-Hispanic. In this figure numbers are reported for race alone.<br />
*Includes Cuban, Mexican American, Puerto Rican, Other Hispanic, and Multiple Hispanic.<br />
^Three students <strong>in</strong> 2009, one student <strong>in</strong> 2010, and four students <strong>in</strong> 2011 did not report their sex and were excluded here.<br />
Source: <strong>AAMC</strong> Data Warehouse: Applicant Matriculant File, as of 1/26/<strong>2012</strong>.<br />
Figure 8: Percentage of U.S. <strong>Medical</strong> School Applicants<br />
by Gender and Race and Ethnicity, 2009–2011<br />
Asian<br />
Black or African American<br />
Hispanic or Lat<strong>in</strong>o*<br />
American Indian or Alaska Native<br />
White<br />
Association of American <strong>Medical</strong> Colleges
<strong>Diversity</strong> <strong>in</strong> <strong>Medical</strong> <strong>Education</strong>: <strong>Facts</strong> & <strong>Figures</strong> <strong>2012</strong><br />
Figure 9 displays specific gender <strong>in</strong>formation by Hispanic or Lat<strong>in</strong>o subgroups. Female applicants<br />
approximate about 48% of the applicant pool from 2009 to 2011. However, a higher percentage of<br />
applicants to U.S. medical schools were women (51.1% or greater) <strong>in</strong> every Hispanic or Lat<strong>in</strong>o subgroup<br />
except for Cuban (49.8%) <strong>in</strong> 2010 and Mexican American (46.3%) <strong>in</strong> 2010 and 2011. Multiple-Hispanic<br />
men (41.6% and 41.8%) represented the lowest percentage of applicants compared with all other<br />
Hispanic or Lat<strong>in</strong>o subgroups <strong>in</strong> 2009 and 2011, respectively.<br />
Figure 9: Percentage of U.S. <strong>Medical</strong> School Applicants<br />
by Gender and Hispanic or Lat<strong>in</strong>o Subgroups, 2009–2011<br />
Hispanic or Lat<strong>in</strong>o subgroup<br />
2011^ 2010^ 2009^<br />
Puerto Rican (n = 683)<br />
Cuban (n = 238)<br />
Mexican American (n = 978)<br />
Other Hispanic (n = 1,024)<br />
Multiple Hispanic* (n = 137)<br />
Puerto Rican (n = 722)<br />
Cuban (n = 265)<br />
Mexican American (n = 734)<br />
Other Hispanic (1,402)<br />
Multiple Hispanic* (n = 148)<br />
Puerto Rican (n = 677)<br />
Cuban (n = 302)<br />
Mexican American (n = 816)<br />
Other Hispanic (n = 1,487)<br />
Multiple Hispanic* (n = 177)<br />
24<br />
42.2%<br />
41.6%<br />
42.4%<br />
41.8%<br />
45.4%<br />
48.7%<br />
51.3%<br />
46.3%<br />
45.8%<br />
46.3%<br />
48.9%<br />
51.1%<br />
47.3%<br />
52.7%<br />
46.3%<br />
50.2%<br />
49.8%<br />
47.0%<br />
54.6%<br />
53.7%<br />
54.2%<br />
53.7%<br />
53.0%<br />
53.7%<br />
48.0%<br />
52.0%<br />
57.8%<br />
58.4%<br />
57.6%<br />
58.2%<br />
0% 10% 20% 30% 40% 50% 60% 70%<br />
^Three students <strong>in</strong> 2009, one student <strong>in</strong> 2010, and four students <strong>in</strong> 2011 did not report their sex and were excluded here.<br />
S<strong>in</strong>ce 2002, <strong>in</strong>dividuals have the option of report<strong>in</strong>g more than one Hispanic ethnicity.<br />
Source: <strong>AAMC</strong> Data Warehouse: Applicant Matriculant File, as of 1/26/<strong>2012</strong>.<br />
percentage of applicants<br />
men<br />
women<br />
Association of American <strong>Medical</strong> Colleges
ace and ethnicity<br />
<strong>Diversity</strong> <strong>in</strong> <strong>Medical</strong> <strong>Education</strong>: <strong>Facts</strong> & <strong>Figures</strong> <strong>2012</strong><br />
U.S. <strong>Medical</strong> School Accepted Applicants<br />
Figure 10 describes the percentage of accepted applicants by racial and ethnic subgroups. Overall, nearly<br />
46% of all applicants <strong>in</strong> 2010 and 2011 were accepted to medical school. Approximately 50% of applicants<br />
who <strong>in</strong>dicated ‘No Race Response’ and who were of Hispanic or Lat<strong>in</strong>o ethnicity were accepted to medical<br />
school dur<strong>in</strong>g those years. Less than 41% of Black or African American applicants were accepted dur<strong>in</strong>g<br />
the same period. The groups with the lowest percentage of applicants accepted <strong>in</strong> 2010 and 2011 <strong>in</strong>cluded:<br />
Other Non-Hispanic or Lat<strong>in</strong>o Race (33.3% and 30.8%), Native Hawaiians or Other Pacific Islanders<br />
(30.2% and 25.0%), and those who identified as Foreign (22% and 18.8%).<br />
American Indian or Alaska Native<br />
Native Hawaiian or Other Pacific Islander<br />
More than One Non-Hispanic or Lat<strong>in</strong>o Race<br />
Other Non-Hispanic or Lat<strong>in</strong>o Race<br />
Figure 10: Percentage of Accepted U.S. <strong>Medical</strong> School Applicants<br />
by Race and Ethnicity, 2010–2011<br />
Asian<br />
Black or African American<br />
Hispanic or Lat<strong>in</strong>o*<br />
White<br />
No Race Response<br />
Foreign<br />
All Applicants<br />
25<br />
22.2%<br />
18.8%<br />
30.2%<br />
25.0%<br />
33.3%<br />
30.8%<br />
40.0%<br />
38.3%<br />
48.2%<br />
45.5%<br />
45.5%<br />
45.1%<br />
47.9%<br />
48.3%<br />
48.1%<br />
50.4%<br />
46.0%<br />
45.9%<br />
49.3%<br />
49.2%<br />
50.6%<br />
50.2%<br />
0% 10% 20% 30% 40% 50% 60% 70%<br />
percentage of accepted applicants<br />
Note: Categories are Non-Hispanic, with the exception of Hispanics and foreign/unknown citizenship. In this figure numbers are reported for race alone;<br />
those that reported more than one race are <strong>in</strong>cluded under More than One Non-Hispanic or Lat<strong>in</strong>o Race.<br />
*Includes Cuban, Mexican American, Puerto Rican, Other Hispanic, and Multiple Hispanic.<br />
Source: <strong>AAMC</strong> Data Warehouse: Applicant Matriculant File, as of 1/26/<strong>2012</strong>.<br />
Year 2010<br />
Year 2011<br />
Association of American <strong>Medical</strong> Colleges
<strong>Diversity</strong> <strong>in</strong> <strong>Medical</strong> <strong>Education</strong>: <strong>Facts</strong> & <strong>Figures</strong> <strong>2012</strong><br />
Figure 11 illustrates the percentage of accepted applicants by gender for each racial and ethnic subgroup.<br />
Compar<strong>in</strong>g accepted applicants to medical school <strong>in</strong> 2011, three racial and ethnic subgroups did not<br />
reflect gender parity: Black or African American women (62.0%), American Indian or Alaska Native<br />
women (56.5%), and White men (56.4%). However, accepted Hispanic or Lat<strong>in</strong>o women applicants were<br />
near parity, at 51.6%, <strong>in</strong> 2011.<br />
race and ethnicity<br />
Figure 11: Percentage of Accepted U.S. <strong>Medical</strong> School Applicants<br />
by Gender and Race and Ethnicity, 2011<br />
American Indian or Alaska Native (n = 46)<br />
Asian (n = 4,029)<br />
Black or African American (n = 1,231)<br />
Hispanic or Lat<strong>in</strong>o* (n = 1,701)<br />
Native Hawaiian or Other Pacific Islander (n = 21)<br />
White (11,577)<br />
Other Non-Hispanic or Lat<strong>in</strong>o Race (n = 4)<br />
More than One Non-Hispanic or Lat<strong>in</strong>o Race (n = 603)<br />
No Race Response (n = 654)<br />
Foreign (n = 310)<br />
26<br />
49.2%<br />
43.6%<br />
51.6%<br />
52.4%<br />
50.0%<br />
50.4%<br />
49.4%<br />
56.5%<br />
51.0%<br />
62.0%<br />
Note: Categories are Non-Hispanic, with the exception of Hispanics and foreign.In this figure numbers are reported for race alone;<br />
those that reported more than one race are <strong>in</strong>cluded under More than One Non-Hispanic or Lat<strong>in</strong>o Race.<br />
*Includes Cuban, Mexican American, Puerto Rican, Other Hispanic, and Multiple Hispanic.<br />
Source: <strong>AAMC</strong> Data Warehouse: Applicant Matriculant File, as of 1/26/<strong>2012</strong>.<br />
50.8%<br />
56.4%<br />
48.4%<br />
47.6%<br />
50.0%<br />
49.6%<br />
50.6%<br />
43.5%<br />
49.0%<br />
38.0%<br />
0% 20% 40% 60% 80% 100%<br />
percentage of accepted applicants<br />
women<br />
men<br />
Association of American <strong>Medical</strong> Colleges
ace & ethnicity<br />
<strong>Diversity</strong> <strong>in</strong> <strong>Medical</strong> <strong>Education</strong>: <strong>Facts</strong> & <strong>Figures</strong> <strong>2012</strong><br />
U.S. <strong>Medical</strong> School Matriculants<br />
Figure 12 describes the percentage of matriculants for the racial and ethnic subgroups <strong>in</strong> 2011 compared<br />
with 2010. Over these two years, the percentage of White matriculants exceeded all other racial and ethnic<br />
groups by a substantial amount, 57.1% <strong>in</strong> 2010 and 57.5% <strong>in</strong> 2011, while Black or African American and<br />
Hispanic or Lat<strong>in</strong>o matriculants comb<strong>in</strong>ed were just 15% of all matriculants. For both years, certa<strong>in</strong> groups<br />
comprised less than 1% of the student body: American Indian or Alaska Native (0.3% and 0.2%), Native<br />
Hawaiian or Other Pacific Islander (0.1%), and Other Non-Hispanic or Lat<strong>in</strong>o Race (0.02%).<br />
American Indian or Alaska Native<br />
Asian<br />
Black or African American<br />
Hispanic or Lat<strong>in</strong>o<br />
Native Hawaiian and Other Pacific Islander<br />
White<br />
More than One Non-Hispanic or Lat<strong>in</strong>o Race<br />
Other Non-Hispanic or Lat<strong>in</strong>o Race<br />
No Race Response<br />
Foreign<br />
27<br />
0.3%<br />
0.2%<br />
0.1%<br />
0.1%<br />
2.8%<br />
3.0%<br />
0.02%<br />
0.02%<br />
3.3%<br />
3.2%<br />
1.5%<br />
1.2%<br />
6.3%<br />
6.1%<br />
8.2%<br />
8.5%<br />
Note: Those that reported more than one race are <strong>in</strong>cluded under Non-Hispanic or More than One Lat<strong>in</strong>o Race.<br />
*Includes Cuban, Mexican American, Puerto Rican, Other Hispanic, and Multiple Hispanic.<br />
Source: <strong>AAMC</strong> Data Warehouse: Applicant Matriculant File, as of 1/26/<strong>2012</strong>.<br />
Figure 12: Percentage of U.S. <strong>Medical</strong> School Matriculants<br />
by Race and Ethnicity, 2010–2011<br />
20.4%<br />
20.1%<br />
57.1%<br />
57.5%<br />
0% 10% 20% 30% 40% 50% 60%<br />
percentage of matriculants<br />
Year 2010<br />
Year 2011<br />
Association of American <strong>Medical</strong> Colleges
<strong>Diversity</strong> <strong>in</strong> <strong>Medical</strong> <strong>Education</strong>: <strong>Facts</strong> & <strong>Figures</strong> <strong>2012</strong><br />
Figure 13 illustrates the percentage of matriculants by gender for the racial and ethnic groups <strong>in</strong> 2011.<br />
Black or African American women (62.4%) and American Indian or Alaska Native women (58.5%)<br />
matriculated at higher percentages compared with other racial and ethnic groups. Hispanic or Lat<strong>in</strong>o<br />
female matriculants were slightly over parity, at 52%, while the follow<strong>in</strong>g groups of matriculants had<br />
proportions near gender parity: Other Non-Hispanic or Lat<strong>in</strong>o Race (50.0%), More than One Non-<br />
Hispanic or Lat<strong>in</strong>o Race (50.3%, women), and No Race Response (50.1%, women).<br />
Figure 13: Percentage of U.S. <strong>Medical</strong> School Matriculants<br />
by Gender and Race and Ethnicity, 2011<br />
race & ethnicity<br />
American Indian or Alaska Native (n = 41)<br />
Asian (n = 3,859)<br />
Black or African American (n = 1,182)<br />
Hispanic or Lat<strong>in</strong>o* (n = 1,633)<br />
Native Hawaiian or Other Pacific Islander (n = 21)<br />
White (n = 11,060)<br />
Other Non-Hispanic or Lat<strong>in</strong>o Race (n = 4)<br />
More than One Non-Hispanic or Lat<strong>in</strong>o Race (n = 579)<br />
No Race Response (n = 623)<br />
Foreign (n = 228)<br />
28<br />
49.0%<br />
43.5%<br />
51.6%<br />
52.4%<br />
50.0%<br />
50.3%<br />
50.1%<br />
Note: Those that reported more than one race are <strong>in</strong>cluded under Non-Hispanic or More than One Lat<strong>in</strong>o Race.<br />
*Includes Cuban, Mexican American, Puerto Rican, Other Hispanic, Multiple Hispanic.<br />
Source: <strong>AAMC</strong> Data Warehouse: Applicant Matriculant File, as of 1/26/<strong>2012</strong>.<br />
58.5%<br />
51.8%<br />
62.4%<br />
51.0%<br />
56.5%<br />
48.4%<br />
47.6%<br />
50.0%<br />
49.7%<br />
49.9%<br />
41.5%<br />
48.2%<br />
37.6%<br />
0% 20% 40% 60% 80% 100%<br />
percentage of matriculants<br />
women<br />
men<br />
Association of American <strong>Medical</strong> Colleges
number of graduates<br />
14,000<br />
12,000<br />
10,000<br />
8,000<br />
6,000<br />
4,000<br />
2,000<br />
0<br />
<strong>Diversity</strong> <strong>in</strong> <strong>Medical</strong> <strong>Education</strong>: <strong>Facts</strong> & <strong>Figures</strong> <strong>2012</strong><br />
U.S. <strong>Medical</strong> School Graduates<br />
Figure 14 shows the historical trend of medical school graduates by gender from 1980 to 2011. In 2011,<br />
women had nearly reached parity (8,396) with men (8,968) compared with the gap that existed <strong>in</strong> 1980.<br />
Then, the number of male graduates (11,584) was more than three times that of female graduates (3,524).<br />
Figure 14: Number of U.S. <strong>Medical</strong> School Graduates by Gender, 1980–2011<br />
1980:<br />
men (11,584)<br />
1980:<br />
women (3,524)<br />
Source: <strong>AAMC</strong> Data Warehouse: Student File, as of 2/3/<strong>2012</strong>.<br />
29<br />
graudation year<br />
2011:<br />
men (8,968)<br />
2011:<br />
women (8,396)<br />
Women<br />
Men<br />
Association of American <strong>Medical</strong> Colleges
<strong>Diversity</strong> <strong>in</strong> <strong>Medical</strong> <strong>Education</strong>: <strong>Facts</strong> & <strong>Figures</strong> <strong>2012</strong><br />
Figure 15 focuses on approximately the last decade of medical school graduates by racial and ethnic<br />
subgroup. Between 2002 and 2011, Whites and Asians cont<strong>in</strong>ued to comprise the largest number of<br />
graduates by racial and ethnic groups. In 2011, compared with 2002, the number of Native Hawaiian<br />
or Other Pacific Islander graduates decreased by 10.9%. Conversely, the number of Black or African<br />
American graduates experienced a 3.9% <strong>in</strong>crease. Graduates across American Indian or Alaska Native<br />
(9.8%), White (7.4%), Asian (23.8%), and Hispanic or Lat<strong>in</strong>o (39.3%) groups <strong>in</strong>creased dur<strong>in</strong>g the<br />
same period.<br />
Figure 15: Number of U.S. <strong>Medical</strong> School Graduates by Race and Ethnicity, 2002–2011<br />
number of graduates<br />
12,000<br />
10,000<br />
8,000<br />
6,000<br />
4,000<br />
2,000<br />
0<br />
2002:<br />
White (10,044)<br />
2002:<br />
Asian (3,042)<br />
Black or African American (1,087)<br />
Hispanic or Lat<strong>in</strong>o (959)<br />
American Indian or Alaska Native (123)<br />
Native Hawaiian or Other Pacific Islander (55)<br />
*Hispanic or Lat<strong>in</strong>o <strong>in</strong>cludes Mexican American, Puerto Rican, and Other Hispanic or Lat<strong>in</strong>o.<br />
Source: <strong>AAMC</strong> Web Site: Data and Analysis, <strong>2012</strong>: Table 29.<br />
30<br />
graduation year<br />
White<br />
Asian<br />
2011:<br />
White (10,783)<br />
2011:<br />
Asian (3,767)<br />
Hispanic or Lat<strong>in</strong>o (1,336)<br />
Black or African American (1,129)<br />
American Indian or Alaska Native (135)<br />
Native Hawaiian or Other Pacific Islander (49)<br />
Black or African American<br />
Hispanic or Lat<strong>in</strong>o*<br />
American Indian or Alaska<br />
Native<br />
Native Hawaiian or Other<br />
Pacific Islander<br />
Association of American <strong>Medical</strong> Colleges
number of graduates<br />
500<br />
450<br />
400<br />
350<br />
300<br />
250<br />
200<br />
150<br />
100<br />
50<br />
0<br />
<strong>Diversity</strong> <strong>in</strong> <strong>Medical</strong> <strong>Education</strong>: <strong>Facts</strong> & <strong>Figures</strong> <strong>2012</strong><br />
Figure 16 displays the historical trend for medical school graduates by Hispanic or Lat<strong>in</strong>o subgroups.<br />
Start<strong>in</strong>g <strong>in</strong> 1980, the number of graduates from Hispanic or Lat<strong>in</strong>o subgroups rose steadily through 2011,<br />
and two groups were the largest over differ<strong>in</strong>g periods. First, between 1983 and 1995, the number of<br />
Puerto Rican graduates (which ranged from 286 to 366) exceeded the number of Other Hispanic or Lat<strong>in</strong>o<br />
subgroups (which ranged from 205 to 291). Second, from 1996 to 2006, the number of Mexican American<br />
graduates (rang<strong>in</strong>g between 384 and 437) exceeded the other groups. In 2011, the Other Hispanic or Lat<strong>in</strong>o<br />
(422) group represented the second greatest number of graduates across Hispanic or Lat<strong>in</strong>o subgroups<br />
while Puerto Rican graduates represented the fewest (357).<br />
Source: <strong>AAMC</strong> Data Book, <strong>2012</strong>: Table B8.<br />
1980:<br />
Mexican American (192)<br />
Puerto Rican (189)<br />
Other Hispanic or Lat<strong>in</strong>o (81)<br />
31<br />
Figure 16: Number of U.S. <strong>Medical</strong> School Graduates<br />
by Hispanic or Lat<strong>in</strong>o Subgroups, 1980–2011<br />
graduation year<br />
2011:<br />
Mexican American (456)<br />
Other Hispanic or Lat<strong>in</strong>o (422)<br />
Puerto Rican (357)<br />
Mexican American<br />
Puerto Rican<br />
Other Hispanic or Lat<strong>in</strong>o<br />
Association of American <strong>Medical</strong> Colleges
6,000<br />
5,000<br />
4,000<br />
3,000<br />
2,000<br />
1,000<br />
0<br />
<strong>Diversity</strong> <strong>in</strong> <strong>Medical</strong> <strong>Education</strong>: <strong>Facts</strong> & <strong>Figures</strong> <strong>2012</strong><br />
Figure 17 illustrates the near decadal trend for female graduates by racial and ethnic groups. Relative<br />
to 2002, the number of White and Asian women graduates <strong>in</strong> 2011 rose 17.3% and 42.1%, respectively.<br />
In 2011 compared with 2002, racial and ethnic m<strong>in</strong>ority women graduates showed the follow<strong>in</strong>g<br />
<strong>in</strong>creases: Hispanic or Lat<strong>in</strong>o (54.0%), American Indian or Alaska Native (14.3%), and Black or African<br />
American (4.4%).<br />
number of graduates<br />
Figure 17: Number of Women U.S. <strong>Medical</strong> School Graduates<br />
by Race and Ethnicity, 2002–2011<br />
2002:<br />
White (4,236)<br />
Asian (1,350)<br />
Black or African American (689)<br />
Hispanic or Lat<strong>in</strong>o (428)<br />
American Indian or Alaska Native (63)<br />
2002 2003 2004 2005 2006 2007 2008 2009 2010 2011<br />
graduation year<br />
White<br />
*Includes Mexican American, Puerto Rican, and Other Hispanic or Lat<strong>in</strong>o.<br />
Source: <strong>AAMC</strong> Website: Data and Analysis, <strong>2012</strong>: Table 29.<br />
32<br />
2011:<br />
White (4,966)<br />
Asian (1,918)<br />
Black or African American (719)<br />
Hispanic or Lat<strong>in</strong>o (659)<br />
American Indian or Alaska Native (72)<br />
Asian<br />
Black or African American<br />
Hispanic or Lat<strong>in</strong>o*<br />
American Indian or Alaska<br />
Native<br />
Association of American <strong>Medical</strong> Colleges
<strong>Diversity</strong> <strong>in</strong> <strong>Medical</strong> <strong>Education</strong>: <strong>Facts</strong> & <strong>Figures</strong> <strong>2012</strong><br />
U.S. <strong>Medical</strong> School Faculty<br />
Figure 18 displays the U.S. medical school faculty by racial and ethnic subgroup. In 2011, of the<br />
137,925 medical school faculty at all ranks, White academicians comprised the largest portion (61.1%),<br />
followed by Asians (12.5%). Comb<strong>in</strong>ed, Black or African American (2.9%), Hispanic or Lat<strong>in</strong>o (4%), and<br />
Multiple Race (1.9%) groups were 8.8% of the faculty. American Indian or Alaska Native (0.1%) and<br />
Native Hawaiian or Other Pacific Islander (0.1%) groups together comprised less than 0.5% of all faculty.<br />
Other/Unknown 17.5%<br />
(24,077)<br />
Figure 18: Percentage and Number of U.S. <strong>Medical</strong> School Faculty<br />
by Race and Ethnicity, 2011<br />
Hispanic or Lat<strong>in</strong>o* 4.0%<br />
(5,491)<br />
Multiple Race 1.9% (2,620)<br />
*Includes Mexican American, Puerto Rican, Cuban, Other Hispanic or Lat<strong>in</strong>o, and Multiple Hispanic.<br />
Other and Unknown were merged, and all <strong>in</strong>dividual Hispanic groups were put together.<br />
Source: <strong>AAMC</strong> Faculty Roster System, 12/31/2011.<br />
33<br />
Asian 12.5% (17,195)<br />
Black or African<br />
American 2.9% (3,954)<br />
American Indian or Alaska<br />
Native 0.1% (190)<br />
Native Hawaiian or Other<br />
Pacific Islander 0.1% (176)<br />
White 61.1% (84,222)<br />
Association of American <strong>Medical</strong> Colleges
<strong>Diversity</strong> <strong>in</strong> <strong>Medical</strong> <strong>Education</strong>: <strong>Facts</strong> & <strong>Figures</strong> <strong>2012</strong><br />
Figure 19 shows faculty by rank and by racial and ethnic subgroup. Regardless of racial and ethnic<br />
group, the dom<strong>in</strong>ant rank across medical school faculty <strong>in</strong> 2011 was assistant professor. Faculty who<br />
represented the greatest percentage of full professors by race and ethnicity were White, 31.0%, relative<br />
to Hispanic or Lat<strong>in</strong>o, 19.3%; Multiple Race, 16.0%; and Asian, 15.9%. Faculty who had the lowest<br />
representation by race and ethnicity across the full professor rank were: Black or African American,<br />
11.3%; Other, 11.1%; American Indian and Alaska Native, 6.8%; and Native Hawaiian or Other Pacific<br />
Islander, 5.1%.<br />
race & ethnicity<br />
Figure 19: Percentage of U.S. <strong>Medical</strong> School Faculty<br />
by Rank and Race and Ethnicity, 2011<br />
American Indian and Alaska Native (190)<br />
Asian (17,195)<br />
Black or African American (3,954)<br />
Hispanic or Lat<strong>in</strong>o* (5,491)<br />
Native Hawaiian and Other Pacific Islander (176)<br />
White (84,222)<br />
Multiple Race (2,620)<br />
Other (404)<br />
Unknown (23,600)<br />
*Includes Mexican American, Puerto Rican, Cuban, Other Hispanic or Lat<strong>in</strong>o, and Multiple Hispanic.<br />
Source: <strong>AAMC</strong> Faculty Roster System, 12/31/2011.<br />
34<br />
6.8%<br />
14.2%<br />
2.1%<br />
15.3%<br />
15.9%<br />
20.5%<br />
2.1%<br />
9.5%<br />
11.3%<br />
18.7%<br />
1.4%<br />
11.0%<br />
19.3%<br />
21.5%<br />
1.7%<br />
7.8%<br />
5.1%<br />
11.4%<br />
1.1%<br />
9.7%<br />
7.0%<br />
1.5%<br />
23.7%<br />
31.0%<br />
36.9%<br />
16.0%<br />
25.3%<br />
6.0%<br />
1.8%<br />
11.1%<br />
5.9%<br />
3.2%<br />
7.1%<br />
10.1%<br />
21.5%<br />
6.2%<br />
24.0%<br />
52.0%<br />
49.6%<br />
50.8%<br />
52.6%<br />
57.6%<br />
58.2%<br />
61.6%<br />
72.7%<br />
0% 10% 20% 30% 40% 50% 60% 70% 80%<br />
percentage of faculty<br />
Professor Associate Professor Assistant Professor Instructor Other<br />
Association of American <strong>Medical</strong> Colleges
ace, ethnicity, & rank^<br />
Black or<br />
African<br />
Hispanic or American<br />
Lat<strong>in</strong>o* (5,489) (3,952) Asian (17,174)White (84,195)<br />
American<br />
Indian and<br />
Alaska Native<br />
(190)<br />
<strong>Diversity</strong> <strong>in</strong> <strong>Medical</strong> <strong>Education</strong>: <strong>Facts</strong> & <strong>Figures</strong> <strong>2012</strong><br />
Figure 20 shows gender by professorial rank for each major racial and ethnic subgroup. In 2011, male<br />
faculty members were the majority across every racial and ethnic group for the professor and associate<br />
professor ranks (57.5% or greater). Women comprised less than 31% of full professors across all racial and<br />
ethnic groups. Furthermore, Black or African American women were less than 50% at the full professor<br />
(26.6%) and associate professor (42.5%) ranks; however, gender parity occurred across the Other faculty<br />
rank for White (women = 51.0%) and Hispanic or Lat<strong>in</strong>o (women = 50.5%) groups.<br />
Figure 20: Percentage of U.S. <strong>Medical</strong> School Faculty by Rank, Gender,<br />
and Race and Ethnicity, 2011<br />
Professor<br />
Associate Professor<br />
Assistant Professor<br />
Instructor<br />
Other<br />
Professor<br />
Associate Professor<br />
Assistant Professor<br />
Instructor<br />
Other<br />
Professor<br />
Associate Professor<br />
Assistant Professor<br />
Instructor<br />
Other<br />
Professor<br />
Associate Professor<br />
Assistant Professor<br />
Instructor<br />
Other<br />
Professor<br />
Associate Professor<br />
Assistant Professor<br />
Instructor<br />
Other<br />
19.1%<br />
21.9%<br />
22.5%<br />
25.0%<br />
35<br />
31.7%<br />
31.2%<br />
26.6%<br />
33.8%<br />
30.8%<br />
40.7%<br />
41.5%<br />
42.3%<br />
37.0%<br />
42.5%<br />
42.9%<br />
43.6%<br />
38.5%<br />
47.0%<br />
48.2%<br />
50.0%<br />
44.8%<br />
52.7%<br />
51.0%<br />
56.3%<br />
64.4%<br />
80.9%<br />
78.1%<br />
77.5%<br />
75.0%<br />
68.3%<br />
68.8%<br />
73.4%<br />
66.2%<br />
69.2%<br />
59.3%<br />
58.5%<br />
57.7%<br />
63.0%<br />
57.5%<br />
57.1%<br />
56.4%<br />
61.5%<br />
53.0%<br />
51.8%<br />
50.0%<br />
55.2%<br />
47.3%<br />
49.0%<br />
43.7%<br />
35.6%<br />
0% 10% 20% 30% 40% 50% 60% 70% 80% 90% 100%<br />
percentage of faculty<br />
Note: The figure excludes 127 faculty with miss<strong>in</strong>g sex data.<br />
*Includes Mexican American, Puerto Rican, Cuban, Other Hispanic or Lat<strong>in</strong>o, and Multiple Hispanic.<br />
^The category “Other” <strong>in</strong>cludes all faculty at ranks other than Instructor, Assistant Professor, Associate Professor, or Full Professor.<br />
Source: <strong>AAMC</strong> Faculty Roster System, 12/31/2011.<br />
women men<br />
Association of American <strong>Medical</strong> Colleges
Additional <strong>Figures</strong>
<strong>Diversity</strong> <strong>in</strong> <strong>Medical</strong> <strong>Education</strong>: <strong>Facts</strong> & <strong>Figures</strong> <strong>2012</strong><br />
IV. Additional <strong>Figures</strong><br />
The follow<strong>in</strong>g figures illustrate medical student perceptions regard<strong>in</strong>g key educational issues and themes. The<br />
data featured display aspirations and expectations about career preparation and choice, student body diversity,<br />
and <strong>in</strong>debtedness. All additional figures were generated us<strong>in</strong>g MSQ (Matriculat<strong>in</strong>g Student Questionnaire)<br />
data. The MSQ is adm<strong>in</strong>istered annually by the Association of American <strong>Medical</strong> Colleges (<strong>AAMC</strong>) and<br />
gathers <strong>in</strong>formation about <strong>in</strong>com<strong>in</strong>g medical students to assist U.S. LCME-accredited medical schools <strong>in</strong> the<br />
advancement of medical education. The response rate for the MSQ survey of 2011 matriculants was 68.2% and<br />
therefore did not reflect all matriculants. For the same year, 72.3% of the MSQ respondents were White and<br />
23% were Asian. Hispanics or Lat<strong>in</strong>os, Blacks or African Americans, and American Indians or Alaska Natives<br />
represented 7.8%, 7.0%, and 1.3% of all 2011 MSQ respondents, respectively. Respondents were allowed to<br />
report multiple races and as a result, the totals by race and ethnicity may not equal 100%.<br />
Figure 21 shows how medical students spent their time before enter<strong>in</strong>g medical school, disaggregated by<br />
racial and ethnic subgroups. In 2011, nearly three-fifths of all matriculants worked before enter<strong>in</strong>g medical<br />
school. A greater percentage of American Indian or Alaska Native matriculants took a course to strengthen<br />
their application (42.7%) or worked to secure f<strong>in</strong>anc<strong>in</strong>g (36.6%) compared with others. A lower percentage of<br />
American Indian or Alaska Native (22.0%) and Black or African American (22.4%) matriculants spent this time<br />
travel<strong>in</strong>g compared with others. Hispanic or Lat<strong>in</strong>o matriculants were less likely to <strong>in</strong>dicate us<strong>in</strong>g the time to raise<br />
a family (4.1%) or take a premedical course for the first time (13.1%) relative to other activities.<br />
Figure 21: How Students Spent Time Between College and Enter<strong>in</strong>g<br />
U.S. <strong>Medical</strong> School by Race and Ethnicity, 2011 Matriculants<br />
activities<br />
Worked at Another Career<br />
Worked to Secure F<strong>in</strong>anc<strong>in</strong>g<br />
Took Course to Strengthen Application<br />
Took Premedical Course for the First Time<br />
Pursued Graduate Studies<br />
Raised a Family<br />
Traveled<br />
Note: Percentage respond<strong>in</strong>g “Yes.”<br />
Source: <strong>AAMC</strong> Data Warehouse: Matriculat<strong>in</strong>g Student Questionnaire, as of 2/16/<strong>2012</strong>.<br />
12.2%<br />
7.4%<br />
8.1%<br />
13.1%<br />
17.1%<br />
26.8%<br />
24.6%<br />
28.0%<br />
23.6%<br />
23.0%<br />
8.5%<br />
1.6%<br />
7.1%<br />
4.1%<br />
4.6%<br />
22.0%<br />
35.6%<br />
22.4%<br />
31.6%<br />
34.9%<br />
38<br />
36.6%<br />
21.7%<br />
25.7%<br />
29.6%<br />
20.9%<br />
42.7%<br />
26.9%<br />
39.0%<br />
34.3%<br />
27.4%<br />
65.9%<br />
61.5%<br />
59.5%<br />
57.1%<br />
68.8%<br />
0% 10% 20% 30% 40% 50% 60% 70% 80%<br />
percentage of matriculants<br />
American Indian or Alaska Native<br />
Asian<br />
Black or African American<br />
Hispanic or Lat<strong>in</strong>o<br />
White<br />
Association of American <strong>Medical</strong> Colleges
<strong>in</strong>fluenc<strong>in</strong>g factors<br />
<strong>Diversity</strong> <strong>in</strong> <strong>Medical</strong> <strong>Education</strong>: <strong>Facts</strong> & <strong>Figures</strong> <strong>2012</strong><br />
Figure 22 illustrates the top five factors that <strong>in</strong>fluenced an enter<strong>in</strong>g medical student’s decision to study<br />
medic<strong>in</strong>e. In 2011, the top <strong>in</strong>fluenc<strong>in</strong>g factor across all matriculants by race and ethnicity was the media<br />
and Hispanics or Lat<strong>in</strong>os (59.7%) and Blacks or African Americans (56.6%) were most <strong>in</strong>fluenced by this<br />
factor. Asians (23.6%) and Whites (24.6%) represented the lowest percentage of matriculants who were<br />
<strong>in</strong>fluenced by an experience with illness or accident compared with other groups. American Indian or<br />
Alaska Native matriculants were most <strong>in</strong>fluenced by three factors as they contemplated pursu<strong>in</strong>g medic<strong>in</strong>e:<br />
the media (50.7%), a parent (35.0%), or an experience with illness/accident (35.0%).<br />
Competitiveness/Challenge of<br />
Medic<strong>in</strong>e<br />
Experience with Illness/Accident<br />
Figure 22: Top Five Influenc<strong>in</strong>g Factors on Decision to Study Medic<strong>in</strong>e<br />
by Race and Ethnicity, 2011 Matriculants<br />
Parent<br />
Science Course<br />
Media<br />
Note:Percentage respond<strong>in</strong>g “Very Important.”<br />
Source: <strong>AAMC</strong> Data Warehouse: Matriculat<strong>in</strong>g Student Questionnaire, as of 2/21/<strong>2012</strong>.<br />
39<br />
23.6%<br />
28.6%<br />
26.9%<br />
29.4%<br />
30.5%<br />
34.2%<br />
24.6%<br />
35.0%<br />
37.2%<br />
31.3%<br />
35.0%<br />
32.4%<br />
41.1%<br />
34.2%<br />
28.6%<br />
30.0%<br />
33.1%<br />
36.0%<br />
39.3%<br />
36.4%<br />
50.7%<br />
53.4%<br />
56.6%<br />
59.7%<br />
54.6%<br />
0% 10% 20% 30% 40% 50% 60% 70% 80%<br />
percentage of matriculants<br />
American Indian or Alaska Native<br />
.<br />
Asian<br />
Black or African American<br />
Hispanic or Lat<strong>in</strong>o<br />
White<br />
Association of American <strong>Medical</strong> Colleges
Less than $5K<br />
$5K - $9,999<br />
$10K - $14,999<br />
$15K- $19,999<br />
$20K - $24,999<br />
$25K or More<br />
Less than $5K<br />
$5K - $9,999<br />
$10K - $14,999<br />
$15K- $19,999<br />
$20K - $24,999<br />
$25K or More<br />
Less than $5K<br />
$5K - $9,999<br />
$10K - $14,999<br />
$15K- $19,999<br />
$20K - $24,999<br />
$25K or More<br />
Less than $5K<br />
$5K - $9,999<br />
$10K - $14,999<br />
$15K- $19,999<br />
$20K - $24,999<br />
$25K or More<br />
Less than $5K<br />
$5K - $9,999<br />
$10K - $14,999<br />
$15K- $19,999<br />
$20K - $24,999<br />
$25K or More<br />
7.7%<br />
9.4%<br />
5.1%<br />
5.1%<br />
3.4%<br />
8.3%<br />
7.1%<br />
6.8%<br />
7.4%<br />
4.4%<br />
6.3%<br />
<strong>Diversity</strong> <strong>in</strong> <strong>Medical</strong> <strong>Education</strong>: <strong>Facts</strong> & <strong>Figures</strong> <strong>2012</strong><br />
Figure 23 displays the amount of matriculant noneducational <strong>in</strong>debtedness by racial and ethnic<br />
subgroup. Of all 2011 matriculants, 46 percent or more, especially Asians (55.1%) and Blacks or African<br />
Americans (47.5%), had less than $5,000 <strong>in</strong> noneducational debt, except for American Indians or Alaska<br />
Natives (28.2%). About 46% of Hispanic or Lat<strong>in</strong>o matriculants reported they had less than $5,000 <strong>in</strong><br />
noneducational debt, while 9.5% of this same group had $25,000 or more. Relative to other racial and<br />
ethnic groups, Whites (10.7%) and Asians (10.2%) represented the lowest percentage of matriculants<br />
who reported they had $20,000 or more <strong>in</strong> noneducational debt.<br />
Figure 23: Amount of Non-<strong>Education</strong>al Debt by Race and Ethnicity, 2011 Matriculants<br />
race & ethnicity<br />
Black or<br />
American<br />
African<br />
Indian or<br />
American Asian Alaska Native<br />
Hispanic or<br />
Lat<strong>in</strong>o<br />
White<br />
7.7%<br />
7.7%<br />
7.6%<br />
10.4%<br />
13.2%<br />
9.8%<br />
9.5%<br />
40<br />
12.4%<br />
14.5%<br />
17.5%<br />
17.9%<br />
18.5%<br />
20.8%<br />
28.2%<br />
38.4%<br />
45.7%<br />
47.5%<br />
46.6%<br />
55.1%<br />
0% 10% 20% 30%<br />
percentage of matriculants<br />
40% 50% 60%<br />
Note: This figure only <strong>in</strong>cluded those who had debt.<br />
Source: <strong>AAMC</strong> Data Warehouse: Matriculat<strong>in</strong>g Student Questionniare, as of 2/16/<strong>2012</strong>.<br />
Association of American <strong>Medical</strong> Colleges
ace & ethnicity<br />
<strong>Diversity</strong> <strong>in</strong> <strong>Medical</strong> <strong>Education</strong>: <strong>Facts</strong> & <strong>Figures</strong> <strong>2012</strong><br />
Figure 24 illustrates by race and ethnicity the proportion of 2011 matriculants carry<strong>in</strong>g debt. Asian<br />
(71.0%) and White (63.6%) matriculants reported <strong>in</strong> the greatest percentages that they had no premedical<br />
school debt <strong>in</strong> comparison with other racial and ethnic groups. A greater percentage of Black or African<br />
American (60.5%) matriculants reported they had premedical school debt relative to Hispanic or Lat<strong>in</strong>o<br />
(45.7%) and American Indian or Alaska Native (42.1%) groups.<br />
Figure 24: Status of Premedical School Debt by Race and Ethnicity, 2011 Matriculants<br />
American Indian or Alaska<br />
Native<br />
Asian<br />
Black or African American<br />
Hispanic or Lat<strong>in</strong>o<br />
White<br />
29.0%<br />
41<br />
42.1%<br />
36.4%<br />
45.7%<br />
60.5%<br />
71.0%<br />
57.9%<br />
63.6%<br />
54.3%<br />
39.5%<br />
0% 20% 40% 60% 80% 100%<br />
percentage of matriculants<br />
Source: <strong>AAMC</strong> Data Warehouse: Matriculat<strong>in</strong>g Student Questionnaire, as of 2/17/<strong>2012</strong>.<br />
Debt No Debt<br />
Association of American <strong>Medical</strong> Colleges
Less than $5K<br />
$5K - $9,999<br />
$10K - $14,999<br />
$15K- $19,999<br />
$20K - $24,999<br />
$25K or More<br />
Less than $5K<br />
$5K - $9,999<br />
$10K - $14,999<br />
$15K- $19,999<br />
$20K - $24,999<br />
$25K or More<br />
Less than $5K<br />
$5K - $9,999<br />
$10K - $14,999<br />
$15K- $19,999<br />
$20K - $24,999<br />
$25K or More<br />
Less than $5K<br />
$5K - $9,999<br />
$10K - $14,999<br />
$15K- $19,999<br />
$20K - $24,999<br />
$25K or More<br />
Less than $5K<br />
$5K - $9,999<br />
$10K - $14,999<br />
$15K- $19,999<br />
$20K - $24,999<br />
$25K or More<br />
3.5%<br />
3.6%<br />
5.3%<br />
5.8%<br />
9.1%<br />
9.3%<br />
8.7%<br />
11.1%<br />
5.1%<br />
<strong>Diversity</strong> <strong>in</strong> <strong>Medical</strong> <strong>Education</strong>: <strong>Facts</strong> & <strong>Figures</strong> <strong>2012</strong><br />
Figure 25 shows the amount of outstand<strong>in</strong>g premedical educational loans by major racial and<br />
ethnic subgroup. In 2011, nearly two-fifths of all matriculants reported they had $25,000 or more <strong>in</strong><br />
outstand<strong>in</strong>g premedical educational loans. Black or African American (56.0%) and American Indian<br />
or Alaska Native (53.7%) groups represented the highest percentage of matriculants who reported the<br />
most <strong>in</strong> outstand<strong>in</strong>g premedical educational loans ($25,000 or more). About 45% of Hispanic or Lat<strong>in</strong>o<br />
matriculants had $25,000 or more <strong>in</strong> outstand<strong>in</strong>g premedical educational loans.<br />
Figure 25: Amount of Premedical <strong>Education</strong>al Loans Outstand<strong>in</strong>g<br />
race & ethnicity<br />
Black or<br />
American<br />
African<br />
Indian or<br />
American Asian Alaska Native<br />
by Race and Ethnicity, 2011 Matriculants<br />
Hispanic or<br />
Lat<strong>in</strong>o<br />
White<br />
12.5%<br />
9.8%<br />
11.9%<br />
13.9%<br />
13.9%<br />
13.0%<br />
8.4%<br />
13.5%<br />
10.3%<br />
10.3%<br />
13.0%<br />
10.7%<br />
11.7%<br />
12.5%<br />
14.5%<br />
42<br />
21.4%<br />
37.5%<br />
44.5%<br />
45.4%<br />
53.7%<br />
56.0%<br />
0% 10% 20% 30% 40% 50% 60%<br />
percentage of matriculants<br />
Note: This figure only <strong>in</strong>cluded those who had debt.<br />
Source: <strong>AAMC</strong> Data warehouse: Matriculat<strong>in</strong>g Student Questionniare, as of 2/16/<strong>2012</strong>.<br />
Association of American <strong>Medical</strong> Colleges
ace & ethnicity<br />
American<br />
Indian or<br />
Alaska<br />
Native<br />
Black or<br />
African<br />
American Asian<br />
Hispanic or<br />
Lat<strong>in</strong>o<br />
White<br />
<strong>Diversity</strong> <strong>in</strong> <strong>Medical</strong> <strong>Education</strong>: <strong>Facts</strong> & <strong>Figures</strong> <strong>2012</strong><br />
Figure 26 describes how matriculants f<strong>in</strong>anced their undergraduate education. In 2011, a greater percentage<br />
of Asian (50.8%) and White (49.2%) matriculants relied on personal/family or spousal support over<br />
any other source to cover the costs of college/premedical school compared with other racial and ethnic<br />
groups. Nearly two-fifths or more of Black or African American (48.4%), Hispanic or Lat<strong>in</strong>o (46.0%), and<br />
American Indian or Alaska Native (43.6%) matriculants covered the costs of college/premedical school<br />
with scholarships or awards.<br />
Scholarships or Awards<br />
Loans<br />
Work-Study Program<br />
Personal/Family/Spouse<br />
Other<br />
Scholarships or Awards<br />
Loans<br />
Work-Study Program<br />
Personal/Family/Spouse<br />
Other<br />
Scholarships or Awards<br />
Loans<br />
Work-Study Program<br />
Personal/Family/Spouse<br />
Other<br />
Scholarships or Awards<br />
Loans<br />
Work-Study Program<br />
Personal/Family/Spouse<br />
Other<br />
Scholarships or Awards<br />
Loans<br />
Work-Study Program<br />
Personal/Family/Spouse<br />
Other<br />
1.1%<br />
1.5%<br />
1.6%<br />
1.2%<br />
0.8%<br />
1.1%<br />
43<br />
2.1%<br />
1.2%<br />
0.9%<br />
2.1%<br />
Source: <strong>AAMC</strong> Data Warehouse: Matriculat<strong>in</strong>g Student Questionnaire, as of 2/16/<strong>2012</strong>.<br />
Figure 26: How College/Premedical School Costs Were Paid<br />
by Race and Ethnicity, 2011 Matriculants<br />
11.0%<br />
15.4%<br />
14.5%<br />
19.9%<br />
24.1%<br />
25.2%<br />
32.5%<br />
35.8%<br />
35.5%<br />
34.3%<br />
43.6%<br />
46.0%<br />
48.4%<br />
50.8%<br />
49.2%<br />
0% 10% 20% 30% 40% 50% 60%<br />
percentage of matriculants<br />
Association of American <strong>Medical</strong> Colleges
0.3%<br />
1.2%<br />
0.4%<br />
1.4%<br />
<strong>Diversity</strong> <strong>in</strong> <strong>Medical</strong> <strong>Education</strong>: <strong>Facts</strong> & <strong>Figures</strong> <strong>2012</strong><br />
Figure 27 shows how matriculants planned to pay for medical school. Regardless of race or ethnicity,<br />
all 2011 matriculants, especially Whites (62.4%), Blacks or African Americans (62.1%), and Hispanics<br />
or Lat<strong>in</strong>os (60.8%), planned to f<strong>in</strong>ance their medical education with loans more than with any other<br />
f<strong>in</strong>ancial resource. Furthermore, Black or African American and American Indian or Alaska Native<br />
matriculants planned to f<strong>in</strong>ance their medical education by seek<strong>in</strong>g scholarships and awards (30.1% and<br />
26.6%, respectively).<br />
Figure 27: How Matriculants Plan to F<strong>in</strong>ance Their <strong>Medical</strong> <strong>Education</strong><br />
race & ethnicity<br />
Black or<br />
American<br />
African<br />
Indian or<br />
American Asian Alaska Native<br />
by Race and Ethnicity, 2011 Matriculants<br />
Hispanic or<br />
Lat<strong>in</strong>o<br />
White<br />
Scholarships or Awards<br />
Loans<br />
Work-Study Program<br />
Personal/Family/Spouse<br />
Other<br />
Scholarships or Awards<br />
Loans<br />
Work-Study Program<br />
Personal/Family/Spouse<br />
Other<br />
Scholarships or Awards<br />
Loans<br />
Work-Study Program<br />
Personal/Family/Spouse<br />
Other<br />
Scholarships or Awards<br />
Loans<br />
Work-Study Program<br />
Personal/Family/Spouse<br />
Other<br />
Scholarships or Awards<br />
Loans<br />
Work-Study Program<br />
Personal/Family/Spouse<br />
Other<br />
1.1%<br />
1.6%<br />
0.5%<br />
1.0%<br />
0.4%<br />
0.9%<br />
6.5%<br />
Source: <strong>AAMC</strong> Data Warehouse: Matriculat<strong>in</strong>g Student Questionnaire, as of 2/16/<strong>2012</strong>.<br />
44<br />
12.9%<br />
15.1%<br />
14.1%<br />
14.9%<br />
20.8%<br />
23.4%<br />
26.6%<br />
27.9%<br />
30.1%<br />
57.0%<br />
55.4%<br />
62.1%<br />
60.8%<br />
62.4%<br />
0% 10% 20% 30% 40% 50% 60% 70%<br />
percentage of matriculants<br />
Association of American <strong>Medical</strong> Colleges
Career Intentions<br />
<strong>Diversity</strong> <strong>in</strong> <strong>Medical</strong> <strong>Education</strong>: <strong>Facts</strong> & <strong>Figures</strong> <strong>2012</strong><br />
Figure 28 <strong>in</strong>dicates <strong>in</strong>itial career <strong>in</strong>tentions as medical students began their degrees. In 2011, the majority<br />
of matriculants planned to pursue a career <strong>in</strong> full-time cl<strong>in</strong>ical practice as opposed to full-time academic<br />
faculty (between 5.7% and 12.8%) and other careers (between 7.9% and 11.2%). American Indian or<br />
Alaska Native (69.3%) groups had the highest percentage of matriculants who planned to pursue full-time<br />
cl<strong>in</strong>ical practice. A greater percentage of Asian (23.9%) and Hispanic or Lat<strong>in</strong>o (21.7%) matriculants were<br />
undecided about their career <strong>in</strong>tentions compared with other groups. The majority of Black or African<br />
American matriculants <strong>in</strong>tended to pursue full-time cl<strong>in</strong>ical practice (61.3%) while 19.4% were undecided.<br />
Full-Time Academic Faculty<br />
Full-Time Cl<strong>in</strong>ical Practice<br />
Other<br />
Undecided<br />
Figure 28: Career Intentions by Race and Ethnicity, 2011 Matriculants<br />
5.7%<br />
12.8%<br />
8.1%<br />
9.0%<br />
9.3%<br />
7.9%<br />
8.4%<br />
11.2%<br />
8.8%<br />
8.1%<br />
45<br />
17.1%<br />
23.9%<br />
19.4%<br />
21.7%<br />
19.5%<br />
69.3%<br />
54.9%<br />
61.3%<br />
60.5%<br />
63.1%<br />
0% 10% 20% 30% 40% 50% 60% 70% 80%<br />
percentage of matriculants<br />
American Indian or Alaska Native<br />
Source: <strong>AAMC</strong> Data Warehouse: Matriculat<strong>in</strong>g Student Questionnaire, as of 2/16/<strong>2012</strong>.<br />
Asian<br />
Black or African American<br />
Hispanic or Lat<strong>in</strong>o<br />
White<br />
Association of American <strong>Medical</strong> Colleges
4.6%<br />
8.5%<br />
5.9%<br />
9.2%<br />
7.2%<br />
9.9%<br />
2.0%<br />
3.8%<br />
10.0%<br />
16.7%<br />
6.8%<br />
10.5%<br />
3.1%<br />
6.7%<br />
9.1%<br />
15.8%<br />
10.6%<br />
11.1%<br />
2.4%<br />
5.5%<br />
7.8%<br />
12.9%<br />
9.6%<br />
13.4%<br />
3.0%<br />
7.7%<br />
7.0%<br />
12.7%<br />
7.4%<br />
10.9%<br />
<strong>Diversity</strong> <strong>in</strong> <strong>Medical</strong> <strong>Education</strong>: <strong>Facts</strong> & <strong>Figures</strong> <strong>2012</strong><br />
Figure 29 <strong>in</strong>dicates how matriculants’ general career specialty <strong>in</strong>tentions changed between 2005 and 2011.<br />
Although 66% or greater of the 2005 and 2011 matriculants planned to practice <strong>in</strong> “Other” specialties rather<br />
than family practice, <strong>in</strong>ternal medic<strong>in</strong>e, or pediatrics, percentages decl<strong>in</strong>ed by 10% or greater <strong>in</strong> 2011 relative<br />
to 2005. Asian (16.7%), Black or African American (15.8%), and White (12.7%) groups represented a greater<br />
percentage of 2011 matriculants who planned to pursue general <strong>in</strong>ternal medic<strong>in</strong>e compared with family<br />
practice and pediatric medic<strong>in</strong>e once licensed. A greater percentage of Hispanic or Lat<strong>in</strong>o (13.4%) and<br />
American Indian or Alaska Native (9.9%) matriculants planned to pursue pediatrics over family practice<br />
and general <strong>in</strong>ternal medic<strong>in</strong>e.<br />
Figure 29: Planned Specialty Once Certified, 2011 Matriculants<br />
American Indian<br />
or Alaska Native<br />
race & ethnicity<br />
Black or African<br />
American Asian<br />
Hispanic or<br />
Lat<strong>in</strong>o<br />
White<br />
Family Practice<br />
Internal Medic<strong>in</strong>e<br />
Pediatrics<br />
Others<br />
Family Practice<br />
Internal Medic<strong>in</strong>e<br />
Pediatrics<br />
Others<br />
Family Practice<br />
Internal Medic<strong>in</strong>e<br />
Pediatrics<br />
Others<br />
Family Practice<br />
Internal Medic<strong>in</strong>e<br />
Pediatrics<br />
Others<br />
Family Practice<br />
Internal Medic<strong>in</strong>e<br />
Pediatrics<br />
Others<br />
46<br />
69.0%<br />
66.4%<br />
68.2%<br />
68.7%<br />
72.3%<br />
77.2%<br />
82.2%<br />
81.2%<br />
80.2%<br />
82.6%<br />
0% 10% 20% 30% 40% 50% 60% 70% 80% 90% 100%<br />
percentage of matriculants<br />
Source: <strong>AAMC</strong> Data Warehouse: Matriculat<strong>in</strong>g Student Questionnaire, as of 2/15/<strong>2012</strong>.<br />
Year 2005<br />
Year 2011<br />
Association of American <strong>Medical</strong> Colleges
ace & ethnicity<br />
<strong>Diversity</strong> <strong>in</strong> <strong>Medical</strong> <strong>Education</strong>: <strong>Facts</strong> & <strong>Figures</strong> <strong>2012</strong><br />
Figure 30 illustrates the enter<strong>in</strong>g student <strong>in</strong>tention to serve <strong>in</strong> an underserved area. About 61% of all<br />
matriculants <strong>in</strong> 2011 were undecided about their plans to practice <strong>in</strong> an underserved area. By race and<br />
ethnicity, 54.6% of Black or African American, 36.0% of Hispanic or Lat<strong>in</strong>o, and 33.6% of American Indian<br />
or Alaska Native matriculants had considered practic<strong>in</strong>g <strong>in</strong> an underserved area. A greater percentage of<br />
White (16.7%), Asian (14.8%), and American Indian or Alaska Native (14.3%) matriculants compared<br />
with Hispanic or Lat<strong>in</strong>o (10.1%) and Black or African American (3.9%) groups reported they did not plan<br />
to practice <strong>in</strong> an underserved area.<br />
Figure 30: Percentage of U.S. <strong>Medical</strong> School Matriculants Plann<strong>in</strong>g to Practice <strong>in</strong> an<br />
Underserved Area by Race and Ethnicity, 2011 Matriculants<br />
All Matriculants<br />
American Indian or Alaska Native<br />
Asian<br />
Black or African American<br />
Hispanic or Lat<strong>in</strong>o<br />
White<br />
24.1%<br />
19.4%<br />
21.4%<br />
47<br />
33.6%<br />
36.0%<br />
Source: <strong>AAMC</strong> Data Warehouse: Matriculat<strong>in</strong>g Student Questionnaire, as of 2/14/<strong>2012</strong>.<br />
14.8%<br />
54.6%<br />
15.0%<br />
16.7%<br />
14.3%<br />
10.1%<br />
3.9%<br />
60.9%<br />
65.8%<br />
61.9%<br />
52.1%<br />
53.9%<br />
41.5%<br />
0% 10% 20% 30% 40% 50% 60% 70% 80% 90% 100%<br />
percentage of matriculants<br />
Yes No Undecided<br />
Association of American <strong>Medical</strong> Colleges
5.8%<br />
7.2%<br />
3.9%<br />
<strong>Diversity</strong> <strong>in</strong> <strong>Medical</strong> <strong>Education</strong>: <strong>Facts</strong> & <strong>Figures</strong> <strong>2012</strong><br />
Figure 31 illustrates how matriculants’ expectations have changed regard<strong>in</strong>g plans to practice <strong>in</strong><br />
underserved communities over the last decade. Between 2000 and 2011, all groups were <strong>in</strong>creas<strong>in</strong>gly<br />
undecided about their plans to practice <strong>in</strong> an underserved area. Of the Black or African American<br />
matriculants, 51.0% or greater planned to practice <strong>in</strong> an underserved area compared with 44.6% or<br />
fewer for other racial and ethnic groups. In 2011, 36% of Hispanic or Lat<strong>in</strong>o and 33.6% of American<br />
Indian or Alaska Native matriculants reported they were consider<strong>in</strong>g practic<strong>in</strong>g <strong>in</strong> this area.<br />
Figure 31: Percentage of U.S. <strong>Medical</strong> School Matriculants Plann<strong>in</strong>g to Practice <strong>in</strong> an<br />
Underserved Area by Race and Ethnicity and Year: 2000, 2005, and 2011 Matriculants<br />
American<br />
Indian or<br />
Alaska Native<br />
race & ethnicity<br />
Black or<br />
African<br />
American Asian<br />
Hispanic or<br />
Lat<strong>in</strong>o<br />
White<br />
Yes<br />
No<br />
Undecided<br />
Yes<br />
No<br />
Undecided<br />
Yes<br />
No<br />
Undecided<br />
Yes<br />
No<br />
Undecided<br />
Yes<br />
No<br />
Undecided<br />
13.5%<br />
13.9%<br />
10.1%<br />
48<br />
17.3%<br />
14.4%<br />
14.3%<br />
16.6%<br />
23.2%<br />
19.4%<br />
27.8%<br />
21.4%<br />
14.8%<br />
19.0%<br />
20.2%<br />
21.4%<br />
28.4%<br />
24.7%<br />
16.7%<br />
35.9%<br />
33.1%<br />
36.0%<br />
41.4%<br />
41.8%<br />
41.5%<br />
44.6%<br />
39.5%<br />
33.6%<br />
38.1%<br />
46.1%<br />
52.1%<br />
52.8%<br />
51.0%<br />
54.6%<br />
50.6%<br />
53.0%<br />
53.9%<br />
52.6%<br />
55.1%<br />
61.9%<br />
55.6%<br />
55.4%<br />
65.8%<br />
0% 10% 20% 30% 40% 50% 60% 70%<br />
percentage of matriculants<br />
2000<br />
Source: <strong>AAMC</strong> Data Warehouse: Matriculat<strong>in</strong>g Student Questionnaire, as of 2/14/<strong>2012</strong>.<br />
2005<br />
2011<br />
Association of American <strong>Medical</strong> Colleges
percentage of matriculants<br />
50%<br />
45%<br />
40%<br />
35%<br />
30%<br />
25%<br />
20%<br />
15%<br />
10%<br />
5%<br />
0%<br />
16.4%<br />
10.7%<br />
8.6%<br />
36.4%<br />
11.7%<br />
9.6%<br />
<strong>Diversity</strong> <strong>in</strong> <strong>Medical</strong> <strong>Education</strong>: <strong>Facts</strong> & <strong>Figures</strong> <strong>2012</strong><br />
The follow<strong>in</strong>g figures show the reported general experience of 2011 matriculants with racial and ethnic<br />
diversity. In Figure 32, matriculants describe the racial and ethnic composition of the neighborhood<br />
where they grew up. In 2011, White (42.0% to 43.6%) respondents represented the greatest percentage of<br />
matriculants who reported they grew up <strong>in</strong> a neighborhood compris<strong>in</strong>g mostly white <strong>in</strong>dividuals, followed<br />
by those who were Asian (39.4%) and American Indian or Alaska Native (36.4%). Black or African<br />
American (33.4%) and Hispanic or Lat<strong>in</strong>o (25.1%) respondents represented the greatest percentage of<br />
matriculants who grew up <strong>in</strong> a nearly all-m<strong>in</strong>ority neighborhood.<br />
American Indian or<br />
Alaska Native<br />
27.9%<br />
21.9%<br />
49<br />
39.4%<br />
Source: <strong>AAMC</strong> Data Warehouse, Matriculat<strong>in</strong>g Student Questionnaire, 2011.<br />
Figure 32: The Racial and Ethnic Composition of the Neighborhood<br />
Where I Grew Up, 2011 Matriculants<br />
17.5%<br />
33.4%<br />
16.3%<br />
15.2%<br />
23.1%<br />
12.1%<br />
25.1%<br />
17.4%<br />
14.0%<br />
28.2%<br />
15.4%<br />
2.8%<br />
1.3%<br />
43.6%<br />
42.0%<br />
10.3%<br />
Asian Black or African American Hispanic or Lat<strong>in</strong>o White<br />
race & ethnicity<br />
Nearly All M<strong>in</strong>orities Mostly M<strong>in</strong>orities 50-50 Mostly White Nearly All White<br />
Association of American <strong>Medical</strong> Colleges
8.0% 7.7%<br />
5.8%<br />
4.4% 4.8%<br />
2.2%<br />
<strong>Diversity</strong> <strong>in</strong> <strong>Medical</strong> <strong>Education</strong>: <strong>Facts</strong> & <strong>Figures</strong> <strong>2012</strong><br />
Figure 33 illustrates how matriculants described the racial and ethnic composition of the college from<br />
which they graduated. In 2011, among all matriculants by race and ethnicity, about 44% or greater<br />
reported that they graduated from a college that was composed of mostly White <strong>in</strong>dividuals, especially<br />
respondents who were White (55.9%), Black or African American (54.8%), and American Indian or<br />
Alaska Native (52.2%). Asian (40.5%) and Hispanic or Lat<strong>in</strong>o (32.1%) matriculants represented the<br />
greatest percentage of students who graduated from a college composed of a 50–50 split of m<strong>in</strong>ority and<br />
majority <strong>in</strong>dividuals.<br />
Figure 33: The Racial and Ethnic Composition of the College<br />
Where I Graduated, 2011 Matriculants<br />
percentage of matriculants<br />
60%<br />
50%<br />
20%<br />
10%<br />
0%<br />
29.7%<br />
52.2%<br />
American Indian or Alaska<br />
Native<br />
40.5%<br />
44.8%<br />
Source: <strong>AAMC</strong> Data Warehouse, Matriculat<strong>in</strong>g Student Questionnaire, 2011.<br />
50<br />
11.5%<br />
4.2%<br />
13.5%<br />
54.8%<br />
16.0%<br />
9.3%<br />
6.9%<br />
32.1%<br />
44.1%<br />
7.6%<br />
1.0%<br />
4.4%<br />
29.7%<br />
Asian Black or African American Hispanic or Lat<strong>in</strong>o White<br />
race & ethnicity<br />
Nearly All M<strong>in</strong>orities Mostly M<strong>in</strong>orities 50-50 Mostly White Nearly All White<br />
55.9%<br />
9.4%<br />
Association of American <strong>Medical</strong> Colleges
percentage of matriculants<br />
60%<br />
50%<br />
40%<br />
30%<br />
20%<br />
10%<br />
0%<br />
8.0%<br />
13.0%<br />
36.9%<br />
8.5%<br />
31.2%<br />
<strong>Diversity</strong> <strong>in</strong> <strong>Medical</strong> <strong>Education</strong>: <strong>Facts</strong> & <strong>Figures</strong> <strong>2012</strong><br />
Figure 34 illustrates matriculant descriptions of the racial and ethnic composition of their collegiate<br />
friends. In 2011, the greatest percentages of respondents who reported “Mostly White” were White (52.8%),<br />
American Indian or Alaska Native (34.1%), and Hispanic or Lat<strong>in</strong>o (24.4%). Black or African American<br />
respondents represented the greatest percentage of matriculants who reported that their college friends<br />
were composed of “Nearly All M<strong>in</strong>orities” (15.9%). Asian (41.7%) and Hispanic or Lat<strong>in</strong>o (42.4%)<br />
matriculants reported <strong>in</strong> the greatest percentages that their college friends were equally composed of<br />
m<strong>in</strong>ority and majority <strong>in</strong>dividuals.<br />
34.1%<br />
8.0%<br />
American Indian or Alaska<br />
Native<br />
41.7%<br />
51<br />
15.8%<br />
Source: <strong>AAMC</strong> Data Warehouse, Matriculat<strong>in</strong>g Student Questionnaire, 2011.<br />
2.9%<br />
Figure 34: The Racial and Ethnic Composition of<br />
My College Friends, 2011 Matriculants<br />
15.9%<br />
30.3%<br />
37.9%<br />
12.9%<br />
2.9%<br />
10.4%<br />
18.9%<br />
42.4%<br />
24.4%<br />
3.8%<br />
1.1%<br />
4.5%<br />
28.7%<br />
Asian Black or African American Hispanic or Lat<strong>in</strong>o White<br />
race & ethnicity<br />
Nearly All M<strong>in</strong>orities Mostly M<strong>in</strong>orities 50-50 Mostly White Nearly All White<br />
52.8%<br />
13.0%<br />
Association of American <strong>Medical</strong> Colleges
<strong>Diversity</strong> <strong>in</strong> <strong>Medical</strong> <strong>Education</strong>: <strong>Facts</strong> & <strong>Figures</strong> <strong>2012</strong><br />
Figure 35 displays matriculants’ responses regard<strong>in</strong>g their exposure to other racial and ethnic viewpo<strong>in</strong>ts<br />
<strong>in</strong> their collegiate curriculum. In 2011, about 41% or greater of all respondents agreed and about 27%<br />
or greater strongly agreed that the perspectives of <strong>in</strong>dividuals from racial and ethnic groups different<br />
from their own were often brought <strong>in</strong>to their undergraduate coursework. Furthermore, American<br />
Indian or Alaska Native (33.6%) and Asian (30.3%) respondents represented the greatest percentages<br />
of matriculants who strongly agreed. In contrast, a greater percentage of Black or African American<br />
(11.3%) and Hispanic or Lat<strong>in</strong>o (10.2%) matriculants disagreed.<br />
Figure 35: The Perspectives of Individuals from Racial and Ethnic Groups<br />
Different Than My Own Were Often Brought Into My Undergraduate<br />
Coursework, 2011 Matriculants<br />
percentage of matriculants<br />
50%<br />
45%<br />
40%<br />
35%<br />
30%<br />
25%<br />
20%<br />
15%<br />
10%<br />
5%<br />
0%<br />
33.6%<br />
41.4%<br />
18.6%<br />
5.0%<br />
American Indian or Alaska<br />
Native<br />
30.3%<br />
45.5%<br />
15.8%<br />
52<br />
7.1%<br />
1.4% 1.3%<br />
Source: <strong>AAMC</strong> Data Warehouse, Matriculat<strong>in</strong>g Student Questionnaire, 2011.<br />
28.3%<br />
40.9%<br />
26.6%<br />
44.7%<br />
16.7% 16.4%<br />
11.3%<br />
10.2%<br />
2.8% 2.2%<br />
27.1%<br />
44.9%<br />
Asian Black or African American Hispanic or Lat<strong>in</strong>o White<br />
race & ethnicity<br />
Strongly Agree Agree No Op<strong>in</strong>ion/Indifferent Disagree Strongly Disagree<br />
17.9%<br />
8.8%<br />
1.3%<br />
Association of American <strong>Medical</strong> Colleges
percentage of matriculants<br />
60%<br />
50%<br />
40%<br />
30%<br />
20%<br />
10%<br />
0%<br />
37.1%<br />
45.0%<br />
12.9%<br />
46.6%<br />
43.6%<br />
<strong>Diversity</strong> <strong>in</strong> <strong>Medical</strong> <strong>Education</strong>: <strong>Facts</strong> & <strong>Figures</strong> <strong>2012</strong><br />
Figure 36 illustrates how matriculants’ knowledge or op<strong>in</strong>ions were <strong>in</strong>fluenced or changed by becom<strong>in</strong>g<br />
aware of different perspectives. In 2011, between 37.1% and 48.9% of all matriculants and, <strong>in</strong> particular,<br />
Black or African American (48.9%) and White (47.9%) respondents agreed that a greater percentage of<br />
matriculants were aware of the <strong>in</strong>fluence of different perspectives. Moreover, Asians (43.6%) comprised<br />
the greatest percentage of respondents who strongly agreed relative to other racial and ethnic groups. In<br />
contrast, about a tenth of American Indian or Alaska Native (12.9%), Hispanic or Lat<strong>in</strong>o (11.1%), and<br />
White (11.1%) matriculants revealed that they had no op<strong>in</strong>ion or were <strong>in</strong>different about whether their<br />
knowledge or op<strong>in</strong>ions of others were <strong>in</strong>fluenced or changed by becom<strong>in</strong>g aware of different perspectives.<br />
Figure 36: My Knowledge or Op<strong>in</strong>ions of Others Were Influenced or Changed<br />
by Becom<strong>in</strong>g Aware of Different Perspectives, 2011 Matriculants<br />
3.6%<br />
1.4%<br />
American Indian or Alaska<br />
Native<br />
53<br />
8.0%<br />
Source: <strong>AAMC</strong> Data Warehouse, Matriculat<strong>in</strong>g Student Questionnaire, 2011.<br />
39.5%<br />
48.9%<br />
9.0%<br />
42.9%<br />
43.8%<br />
38.2%<br />
47.9%<br />
11.1% 11.1%<br />
1.5% 1.5% 1.9% 2.1%<br />
0.3% 1.1% 0.4% 0.7%<br />
Asian Black or African American Hispanic or Lat<strong>in</strong>o White<br />
race & ethnicity<br />
Strongly Agree Agree No Op<strong>in</strong>ion/Indifferent Disagree Strongly Disagree<br />
Association of American <strong>Medical</strong> Colleges
Detailed Tables
<strong>Diversity</strong> <strong>in</strong> <strong>Medical</strong> <strong>Education</strong>: <strong>Facts</strong> & <strong>Figures</strong> <strong>2012</strong><br />
V. Detailed Tables<br />
This section provides detailed tables on racial and ethnic m<strong>in</strong>orities <strong>in</strong> medical education as well as data from the National<br />
Center for <strong>Education</strong> Statistics (NCES).<br />
Table 1: Number of U.S. <strong>Medical</strong> Table 1: School Number Applicants, of U.S. <strong>Medical</strong> Matriculants, School Applicants, Enrollment, Enrollment, and Graduates,<br />
and Graduates, 1924-2011 Academic Years<br />
1924–2011 Academic Years<br />
Academic First-Time Accepted Acceptance First-Year Total Active<br />
Year Applicants Applicants* Applicants Ratio Matriculants Enrollment† Enrollment Graduates<br />
1924-25 — — — — — 5,492 — —<br />
1925-26 — — — — — 5,753 — —<br />
1926-27 10,250 — 6,420 1.6 — 6,099 — —<br />
1927-28 11,287 — 6,496 1.7 — 6,199 — 4,262<br />
1928-29 12,420 — 6,794 1.8 — 6,277 — 4,446<br />
1929-30 13,655 — 7,035 1.9 — 6,457 — 4,565<br />
1930-31 — — — — — 6,456 — 4,735<br />
1931-32 — — — — — 6,260 — 4,936<br />
1932-33 12,280 — 7,357 1.7 — 6,426 22,466 4,895<br />
1933-34 12,128 — 7,578 1.6 — 6,457 22,799 5,035<br />
1934-35 12,779 — 7,419 1.7 — 6,356 22,888 5,101<br />
1935-36 12,740 — 6,900 1.8 — 6,605 22,564 5,183<br />
1936-37 12,192 — 6,465 1.9 — 5,910 22,095 5,377<br />
1937-38 12,207 — 6,410 1.9 — 5,791 21,587 5,194<br />
1938-39 12,131 — 6,223 1.9 — 5,764 21,302 5,089<br />
1939-40 11,800 — 6,211 1.9 — 5,794 21,271 5,097<br />
1940-41 11,854 — 6,328 1.9 — 5,837 21,379 5,275<br />
1941-42 11,940 — 6,822 1.8 — 6,218 22,031 5,163<br />
1942-43 14,034 — 6,835 2.1 — 6,425 22,631 5,223<br />
1943-44 — — — — — 6,561 23,529 5,134<br />
1944-45 — — — — — 6,648 24,666 5,169<br />
1944-45 — — — — — 6,523 24,028 5,136<br />
1945-46 — — — — — 6,060 23,216 5,826<br />
1946-47 — — — — — 6,564 23,900 6,389<br />
1947-48 18,829 — 6,512 2.9 — 6,487 22,739 5,543<br />
1948-49 24,242 — 6,973 3.5 — 6,688 23,670 5,094<br />
1949-50 24,434 — 7,150 3.4 — 7,042 25,103 5,553<br />
1950-51 22,279 — 7,254 3.1 — 7,177 26,186 6,135<br />
1951-52 19,920 — 7,663 2.6 — 7,436 27,076 6,080<br />
1952-53 16,763 — 7,778 2.2 — 7,425 27,688 6,668<br />
1953-54 14,678 — 7,756 1.9 — 7,449 28,227 6,861<br />
1954-55 14,538 — 7,878 1.8 — 7,576 28,583 6,977<br />
1955-56 14,937 — 7,969 1.9 — 7,686 28,639 6,845<br />
1956-57 15,917 — 8,263 1.9 — 8,014 29,130 6,796<br />
1957-58 15,791 — 8,302 1.9 7,852 8,030 29,473 6,861<br />
1958-59 15,170 — 8,366 1.8 7,920 8,128 29,614 6,860<br />
1959-60 14,992 — 8,512 1.8 7,983 8,173 30,084 7,081<br />
1960-61 14,397 — 8,560 1.7 8,069 8,298 30,288 6,994<br />
55<br />
Cont<strong>in</strong>ues on next page<br />
Association of American <strong>Medical</strong> Colleges
<strong>Diversity</strong> <strong>in</strong> <strong>Medical</strong> <strong>Education</strong>: <strong>Facts</strong> & <strong>Figures</strong> <strong>2012</strong><br />
Table 1: Number of U.S. <strong>Medical</strong> School Applicants, Enrollment, and Graduates,<br />
Table 1: Number of U.S. <strong>Medical</strong> School Applicants, Matriculants, Enrollment,<br />
1924–2011 Academic Years (cont<strong>in</strong>ued)<br />
and Graduates, 1924-2011 Academic Years (cont<strong>in</strong>ued)<br />
Academic First-Time Accepted Acceptance First-Year Total Active<br />
Year Applicants Applicants* Applicants Ratio Matriculants Enrollment† Enrollment Graduates<br />
1961-62 14,331 — 8,682 1.7 8,143 8,483 31,078 7,168<br />
1962-63 15,847 — 8,959 1.8 8,394 8,642 31,491 7,265<br />
1963-64 17,668 — 9,063 1.9 8,565 8,772 31,981 7,336<br />
1964-65 19,168 — 9,043 2.1 8,587 8,856 32,428 7,409<br />
1965-66 18,703 — 9,012 2.1 8,554 8,759 32,835 7,574<br />
1966-67 18,250 — 9,123 2.0 8,775 8,964 33,423 7,743<br />
1967-68 18,724 — 9,702 1.9 9,314 9,479 34,538 7,973<br />
1968-69 21,118 — 10,092 2.1 9,740 9,863 35,833 8,059<br />
1969-70 24,465 — 10,547 2.3 10,269 10,422 37,669 8,367<br />
1970-71 24,987 — 11,500 2.2 11,169 11,348 40,487 8,974<br />
1971-72 29,172 — 12,335 2.4 12,088 12,361 43,650 9,558<br />
1972-73 36,135 — 13,757 2.6 13,570 13,677 47,366 10,396<br />
1973-74 40,495 — 14,335 2.8 13,771 14,154 50,751 11,365<br />
1974-75 42,614 — 15,065 2.8 14,575 14,763 53,554 12,716<br />
1975-76 42,282 — 15,360 2.8 14,897 15,295 55,818 13,634<br />
1976-77 42,064 — 15,771 2.7 15,266 15,613 57,765 13,614<br />
1977-78 40,560 — 15,980 2.5 15,492 16,136 60,039 14,391<br />
1978-79 36,626 — 16,526 2.2 16,054 16,501 62,213 14,784<br />
1979-80 36,135 — 16,886 2.1 16,311 16,930 63,800 15,113<br />
1980-81 36,083 — 17,141 2.1 16,587 17,186 65,189 15,632<br />
1981-82 36,717 — 17,285 2.1 16,660 17,268 66,298 16,012<br />
1982-83 35,720 24,774 17,294 2.1 16,567 17,254 66,748 15,802<br />
1983-84 35,189 24,641 17,208 2.0 16,480 17,150 67,327 16,343<br />
1984-85 35,917 25,333 17,193 2.1 16,395 16,997 67,016 16,318<br />
1985-86 32,885 22,932 17,225 1.9 16,268 16,963 66,585 16,117<br />
1986-87 31,314 22,578 17,092 1.8 16,103 16,819 66,125 15,830<br />
1987-88 28,118 20,455 17,025 1.7 15,927 16,713 65,735 15,919<br />
1988-89 26,702 20,276 17,102 1.6 15,969 16,868 65,300 15,630<br />
1989-90 26,909 20,960 16,974 1.6 15,867 16,756 65,016 15,398<br />
1990-91 29,241 23,020 17,206 1.7 15,998 16,876 65,163 15,427<br />
1991-92 33,297 26,184 17,435 1.9 16,211 17,071 65,602 15,356<br />
1992-93 37,402 28,767 17,465 2.1 16,289 17,079 65,606 15,474<br />
1993-94 42,806 31,389 17,361 2.5 16,307 17,121 66,202 15,504<br />
1994-95 45,360 31,903 17,318 2.6 16,287 17,085 66,815 15,883<br />
56<br />
Cont<strong>in</strong>ues on next page<br />
Association of American <strong>Medical</strong> Colleges
<strong>Diversity</strong> <strong>in</strong> <strong>Medical</strong> <strong>Education</strong>: <strong>Facts</strong> & <strong>Figures</strong> <strong>2012</strong><br />
Table 1: Number of U.S. <strong>Medical</strong> School Applicants, Enrollment, and Graduates,<br />
Table 1: Number of U.S. <strong>Medical</strong> School Applicants, Matriculants, 1924–2011 Enrollment,<br />
Academic Years (cont<strong>in</strong>ued)<br />
and Graduates, 1924-2011 Academic Years (cont<strong>in</strong>ued)<br />
Academic First-Time Accepted Acceptance First-Year Total Active<br />
Year Applicants Applicants* Applicants Ratio Matriculants Enrollment† Enrollment Graduates<br />
1995-96 46,586 31,697 17,356 2.7 16,252 17,058 66,947 15,886<br />
1996-97 46,965 31,377 17,385 2.7 16,201 16,935 66,913 15,890<br />
1997-98‡ 43,016 28,627 17,312 2.5 16,164 16,867 69,089 15,958<br />
1998-99‡ 40,996 27,534 17,373 2.4 16,170 16,790 69,297 16,003<br />
1999-00‡ 38,443 26,126 17,421 2.2 16,221 16,856 69,303 15,718<br />
2000-01 37,088 25,757 17,535 2.1 16,301 16,699 69,413 15,796<br />
2001-02 34,860 24,910 17,454 2.0 16,365 16,875 69,518 15,676<br />
2002-03 33,624 24,884 17,592 1.9 16,488 16,953 69,929 15,531<br />
2003-04 34,791 26,160 17,542 2.0 16,541 17,035 70,314 15,829<br />
2004-05 35,735 27,190 17,662 2.0 16,648 17,059 71,030 15,760<br />
2005-06 37,372 28,291 17,986 2.1 17,003 17,376 72,000 15,927<br />
2006-07 39,108 29,583 18,418 2.1 17,361 17,826 73,113 16,140<br />
2007-08 42,315 31,946 18,858 2.2 17,759 18,287 74,519 16,168<br />
2008-09 42,231 31,019 19,135 2.2 18,036 18,370 76,002 16,467<br />
2009-10 42,268 31,062 19,331 2.2 18,390 18,853 77,624 16,838<br />
2010-11 42,741 31,832 19,641 2.2 18,665 19,082 79,070 17,364<br />
2011-12 43,919 32,654 20,176 2.2 19,230 19,947 80,299<br />
* First-time applicants def<strong>in</strong>ed as those who have not filed an application <strong>in</strong> the n<strong>in</strong>e years prior to the year be<strong>in</strong>g<br />
† Includes new entrants and those repeat<strong>in</strong>g the <strong>in</strong>itial year.<br />
‡ First-Year Enrollment data derived from LCME Part II.<br />
Notes: All data for 1930-31 through 1967-68 derived from JAMA <strong>Education</strong> Issue. Data start<strong>in</strong>g <strong>in</strong> 1992-93 may be slightly<br />
undercounted (less than !%) due to <strong>in</strong>sufficient enrollment status <strong>in</strong>formation.<br />
Applicants, Acceptances, and Matriculants<br />
Notes: 1949-50 through 1953-54 data for University of Chicago, Rush <strong>Medical</strong> College, and Duke were unavailable. From<br />
1970-71 through 1972-73 data derived from F<strong>in</strong>al National Admission Action Summaries. Applicant data 1973-74 forward<br />
derived from the <strong>AAMC</strong> DW: AMF as of 12/21/2011.<br />
Sources: JAMA <strong>Education</strong> Issue; F<strong>in</strong>al National Admission Action Summaries; <strong>AAMC</strong> DW: AMF<br />
Enrollment<br />
Notes: From 1933-34 through 1934-35 data for University of Chicago, Rush <strong>Medical</strong> College, and Duke were unavailable.<br />
There were no data for Rush <strong>Medical</strong> College and the University of Chicago School of Medic<strong>in</strong>e for 1931-32, 1932-33,<br />
1936-37, 1937-38, and 1939-40. Beg<strong>in</strong>n<strong>in</strong>g 2000-01, First-Year Enrollment data are from <strong>AAMC</strong> DW: Student; data for<br />
2011-12 derived from DW: SRS as of 1/5/<strong>2012</strong>. Beg<strong>in</strong>n<strong>in</strong>g 1992-93, Total Active Enrollment data are from <strong>AAMC</strong> DW:<br />
Student; data 1999-00 forward derived from DW: Student as of 1/5/<strong>2012</strong>.<br />
Sources: JAMA <strong>Education</strong> Issue; <strong>AAMC</strong> FEQ; <strong>AAMC</strong> DW: Student<br />
Graduates<br />
Notes: In 1944-45, an accelerated program altered report<strong>in</strong>g periods. For the 1946-47 academic year, 10 schools<br />
graduated two classes, add<strong>in</strong>g graduates to the total. From 1978-79 through 1980-81 data derived from <strong>AAMC</strong> Reported<br />
Graduates Report. From 1981-82 forward, Graduates data are from <strong>AAMC</strong> DW: Student; data 2001-02 forward derived<br />
from DW: Student as of 1/5/<strong>2012</strong>.<br />
Sources: JAMA <strong>Education</strong> Issue; <strong>AAMC</strong> Reported Graduates Report; <strong>AAMC</strong> DW: Student<br />
Contact: <strong>AAMC</strong> FACTS, facts@aamc.org<br />
57<br />
Association of American <strong>Medical</strong> Colleges
<strong>Diversity</strong> <strong>in</strong> <strong>Medical</strong> <strong>Education</strong>: <strong>Facts</strong> & <strong>Figures</strong> <strong>2012</strong><br />
Table 2: Number (%) of U.S. <strong>Medical</strong> School Applicants and Accepted Applicants by Race and<br />
Ethnicity, 1970–2001<br />
Table 2: Number (%) of U.S. <strong>Medical</strong> School Applicants and Accepted Applicants<br />
by Race and Ethnicity, 1970-2001<br />
First-Year<br />
Class<br />
# of<br />
Apps<br />
Black/African American<br />
% of All<br />
Apps<br />
# of<br />
Accs<br />
58<br />
% of<br />
Accs<br />
# of<br />
Apps<br />
Native American*<br />
% of All<br />
Apps<br />
# of<br />
Accs<br />
1970-71 1,250 5.0% — — — — — —<br />
1971-72 1,552 5.3% — — — — — —<br />
1972-73 2,186 6.0% — — — — — —<br />
% of<br />
Accs<br />
1973-74 1,929 4.8% 845 43.8% 117 0.3% 37 31.6%<br />
1974-75 2,295 5.4% 1,027 44.7% 127 0.3% 63 49.6%<br />
1975-76 2,061 4.9% 858 41.6% 119 0.3% 54 45.4%<br />
1976-77 2,362 5.6% 896 37.9% 124 0.3% 40 32.3%<br />
1977-78 2,360 5.8% 888 37.6% 122 0.3% 43 35.2%<br />
1978-79 2,423 6.6% 964 39.8% 139 0.4% 57 41.0%<br />
1979-80 2,453 6.8% 1,004 40.9% 153 0.4% 66 43.1%<br />
1980-81 2,507 6.9% 1,043 41.6% 156 0.4% 65 41.7%<br />
1981-82 2,572 7.0% 1,018 39.6% 169 0.5% 70 41.4%<br />
1982-83 2,545 7.1% 993 39.0% 139 0.4% 57 41.0%<br />
1983-84 2,486 7.1% 995 40.0% 162 0.5% 71 43.8%<br />
1984-85 2,494 6.9% 1,015 40.7% 152 0.4% 72 47.4%<br />
1985-86 2,303 7.0% 956 41.5% 125 0.4% 54 43.2%<br />
1986-87 2,286 7.3% 1,027 44.9% 123 0.4% 61 49.6%<br />
1987-88 2,121 7.5% 1,040 49.0% 127 0.5% 67 52.8%<br />
1988-89 2,087 7.8% 1,048 50.2% 121 0.5% 74 61.2%<br />
1989-90 2,130 7.9% 1,071 50.3% 136 0.5% 86 63.2%<br />
1990-91 2,261 7.7% 1,102 48.7% 137 0.5% 73 53.3%<br />
1991-92 2,564 7.7% 1,146 44.7% 169 0.5% 95 56.2%<br />
1992-93 2,885 7.7% 1,263 43.8% 234 0.6% 121 51.7%<br />
1993-94 3,393 7.9% 1,349 39.8% 285 0.7% 138 48.4%<br />
1994-95 3,539 7.8% 1,386 39.2% 317 0.7% 134 42.3%<br />
1995-96 3,489 7.5% 1,366 39.2% 361 0.8% 155 42.9%<br />
1996-97 3,527 7.5% 1,268 36.0% 385 0.8% 155 40.3%<br />
1997-98 3,186 7.4% 1,213 38.1% 328 0.8% 138 42.1%<br />
1998-99 3,171 7.7% 1,282 40.4% 296 0.7% 157 53.0%<br />
1999-00 2,959 7.7% 1,208 40.8% 251 0.7% 117 46.6%<br />
2000-01 2,947 7.9% 1,177 39.9% 280 0.8% 129 46.1%<br />
2001-02 2,887 8.3% 1,230 42.6% 263 0.8% 134 51.0%<br />
Cont<strong>in</strong>ues on next page<br />
Association of American <strong>Medical</strong> Colleges
<strong>Diversity</strong> <strong>in</strong> <strong>Medical</strong> <strong>Education</strong>: <strong>Facts</strong> & <strong>Figures</strong> <strong>2012</strong><br />
Table 2: Number Table (%) of 2: Number U.S. <strong>Medical</strong> (%) of U.S. School <strong>Medical</strong> Applicants School Applicants and Accepted and Accepted Applicants by Race and<br />
by Race and Ethnicity, 1970-2001 (cont<strong>in</strong>ued)<br />
Ethnicity, 1970–2001 (cont<strong>in</strong>ued)<br />
First-Year<br />
Class<br />
# of<br />
Apps<br />
Mexican American/Chicano Ma<strong>in</strong>land Puerto Rican†<br />
% of All<br />
Apps<br />
59<br />
# of<br />
Accs<br />
% of<br />
Accs<br />
# of<br />
Apps<br />
% of All<br />
Apps<br />
# of<br />
Accs<br />
1970-71 — — — — — — — —<br />
1971-72 — — — — — — — —<br />
1972-73 — — — — — — — —<br />
% of<br />
Accs<br />
1973-74 304 0.8% 148 48.7% 85 0.2% 38 44.7%<br />
1974-75 424 1.0% 213 50.2% 113 0.3% 57 50.4%<br />
1975-76 348 0.8% 177 50.9% 141 0.3% 68 48.2%<br />
1976-77 400 1.0% 192 48.0% 153 0.4% 65 42.5%<br />
1977-78 431 1.1% 185 42.9% 149 0.4% 68 45.6%<br />
1978-79 441 1.2% 246 55.8% 150 0.4% 80 53.3%<br />
1979-80 458 1.3% 267 58.3% 156 0.4% 85 54.5%<br />
1980-81 454 1.3% 241 53.1% 159 0.4% 90 56.6%<br />
1981-82 520 1.4% 282 54.2% 190 0.5% 100 52.6%<br />
1982-83 508 1.4% 286 56.3% 181 0.5% 102 56.4%<br />
1983-84 510 1.4% 265 52.0% 190 0.5% 102 53.7%<br />
1984-85 560 1.6% 288 51.4% 215 0.6% 112 52.1%<br />
1985-86 523 1.6% 295 56.4% 226 0.7% 129 57.1%<br />
1986-87 511 1.6% 293 57.3% 172 0.5% 96 55.8%<br />
1987-88 470 1.7% 294 62.6% 163 0.6% 108 66.3%<br />
1988-89 438 1.6% 267 61.0% 161 0.6% 105 65.2%<br />
1989-90 503 1.9% 309 61.4% 173 0.6% 117 67.6%<br />
1990-91 495 1.7% 281 56.8% 173 0.6% 105 60.7%<br />
1991-92 572 1.7% 328 57.3% 205 0.6% 119 58.0%<br />
1992-93 715 1.9% 428 59.9% 200 0.5% 116 58.0%<br />
1993-94 749 1.7% 399 53.3% 212 0.5% 105 49.5%<br />
1994-95 867 1.9% 477 55.0% 240 0.5% 137 57.1%<br />
1995-96 933 2.0% 504 54.0% 267 0.6% 117 43.8%<br />
1996-97 972 2.1% 470 48.4% 274 0.6% 148 54.0%<br />
1997-98 841 2.0% 423 50.3% 216 0.5% 118 54.6%<br />
1998-99 825 2.0% 438 53.1% 218 0.5% 111 50.9%<br />
1999-00 782 2.0% 418 53.5% 214 0.6% 118 55.1%<br />
2000-01 828 2.2% 419 50.6% 233 0.6% 129 55.4%<br />
2001-02 752 2.2% 403 53.6% 197 0.6% 119 60.4%<br />
Cont<strong>in</strong>ues on next page<br />
Association of American <strong>Medical</strong> Colleges
<strong>Diversity</strong> <strong>in</strong> <strong>Medical</strong> <strong>Education</strong>: <strong>Facts</strong> & <strong>Figures</strong> <strong>2012</strong><br />
Table 2: Number (%) of U.S. <strong>Medical</strong> School Applicants and Accepted Applicants by Race and<br />
Ethnicity, 1970–2001 (cont<strong>in</strong>ued)<br />
Table 2: Number (%) of U.S. <strong>Medical</strong> School Applicants and Accepted Applicants<br />
by Race and Ethnicity, 1970-2001 (cont<strong>in</strong>ued)<br />
First-Year<br />
Class<br />
# of<br />
Apps<br />
Commonwealth Puerto Rican† Other Hispanic<br />
% of All<br />
Apps<br />
# of<br />
Accs<br />
60<br />
% of<br />
Accs<br />
# of<br />
Apps<br />
% of All<br />
Apps<br />
# of<br />
Accs<br />
1970-71 — — — — — — — —<br />
1971-72 — — — — — — — —<br />
1972-73 — — — — — — — —<br />
% of<br />
Accs<br />
1973-74 63 0.2% 10 15.9% 6 0.0% 2 33.3%<br />
1974-75 300 0.7% 109 36.3% 0 0.0% 0 0.0%<br />
1975-76 251 0.6% 101 40.2% 16 0.0% 8 50.0%<br />
1976-77 341 0.8% 117 34.3% 8 0.0% 2 25.0%<br />
1977-78 363 0.9% 118 32.5% 11 0.0% 1 9.1%<br />
1978-79 390 1.1% 170 43.6% 266 0.7% 77 28.9%<br />
1979-80 397 1.1% 171 43.1% 566 1.6% 238 42.0%<br />
1980-81 518 1.4% 243 46.9% 633 1.8% 258 40.8%<br />
1981-82 533 1.5% 269 50.5% 669 1.8% 264 39.5%<br />
1982-83 580 1.6% 223 38.4% 622 1.7% 285 45.8%<br />
1983-84 555 1.6% 245 44.1% 620 1.8% 269 43.4%<br />
1984-85 577 1.6% 252 43.7% 731 2.0% 272 37.2%<br />
1985-86 562 1.7% 265 47.2% 661 2.0% 288 43.6%<br />
1986-87 477 1.5% 241 50.5% 634 2.0% 291 45.9%<br />
1987-88 457 1.6% 223 48.8% 543 1.9% 285 52.5%<br />
1988-89 422 1.6% 240 56.9% 567 2.1% 287 50.6%<br />
1989-90 371 1.4% 205 55.3% 567 2.1% 292 51.5%<br />
1990-91 403 1.4% 216 53.6% 638 2.2% 307 48.1%<br />
1991-92 400 1.2% 215 53.8% 746 2.2% 335 44.9%<br />
1992-93 461 1.2% 223 48.4% 815 2.2% 303 37.2%<br />
1993-94 458 1.1% 219 47.8% 907 2.1% 302 33.3%<br />
1994-95 446 1.0% 209 46.9% 978 2.2% 330 33.7%<br />
1995-96 480 1.0% 217 45.2% 1,042 2.2% 326 31.3%<br />
1996-97 448 1.0% 212 47.3% 1,064 2.3% 338 31.8%<br />
1997-98 440 1.0% 213 48.4% 929 2.2% 298 32.1%<br />
1998-99 457 1.1% 204 44.6% 917 2.2% 334 36.4%<br />
1999-00 425 1.1% 212 49.9% 943 2.5% 381 40.4%<br />
2000-01 366 1.0% 198 54.1% 879 2.4% 339 38.6%<br />
2001-02 435 1.2% 216 49.7% 794 2.3% 338 42.6%<br />
Cont<strong>in</strong>ues on next page<br />
Association of American <strong>Medical</strong> Colleges
<strong>Diversity</strong> <strong>in</strong> <strong>Medical</strong> <strong>Education</strong>: <strong>Facts</strong> & <strong>Figures</strong> <strong>2012</strong><br />
Table 2: Number (%) Table of 2: U.S. Number <strong>Medical</strong> (%) of School U.S. <strong>Medical</strong> Applicants School Applicants and Accepted and Accepted Applicants by Race and<br />
by Race and Ethnicity, 1970-2001 (cont<strong>in</strong>ued)<br />
Ethnicity, 1970–2001 (cont<strong>in</strong>ued)<br />
First-Year<br />
Class<br />
# of<br />
Apps<br />
% of All<br />
Apps<br />
White Asian / Other Pacific Islander<br />
61<br />
# of<br />
Accs<br />
% of<br />
Accs<br />
# of<br />
Apps<br />
% of All<br />
Apps<br />
# of<br />
Accs<br />
1970-71 — — — — — — — —<br />
1971-72 — — — — — — — —<br />
1972-73 — — — — — — — —<br />
1973-74 11,464 28.3% 767 6.7% 152 0.4% 15 9.9%<br />
% of<br />
Accs<br />
1974-75 34,785 81.6% 12,441 35.8% 1,217 2.9% 385 31.6%<br />
1975-76 32,877 77.7% 12,259 37.3% 820 1.9% 289 35.2%<br />
1976-77 33,181 78.8% 12,926 39.0% 811 1.9% 307 37.9%<br />
1977-78 32,211 79.4% 13,057 40.5% 966 2.4% 307 31.8%<br />
1978-79 30,102 82.2% 14,171 47.1% 1,584 4.3% 620 39.1%<br />
1979-80 29,543 81.8% 14,304 48.4% 1,482 4.1% 601 40.6%<br />
1980-81 29,256 81.1% 14,345 49.0% 1,643 4.6% 696 42.4%<br />
1981-82 29,492 80.3% 14,319 48.6% 1,845 5.0% 797 43.2%<br />
1982-83 28,318 79.3% 14,215 50.2% 2,113 5.9% 953 45.1%<br />
1983-84 27,734 78.8% 14,056 50.7% 2,192 6.2% 1,010 46.1%<br />
1984-85 27,858 77.6% 13,814 49.6% 2,619 7.3% 1,182 45.1%<br />
1985-86 25,250 76.8% 13,679 54.2% 2,581 7.8% 1,356 52.5%<br />
1986-87 23,527 75.1% 13,340 56.7% 2,841 9.1% 1,543 54.3%<br />
1987-88 20,535 73.0% 12,930 63.0% 3,037 10.8% 1,872 61.6%<br />
1988-89 18,994 71.1% 12,729 67.0% 3,230 12.1% 2,117 65.5%<br />
1989-90 18,714 69.5% 12,362 66.1% 3,557 13.2% 2,259 63.5%<br />
1990-91 19,949 68.2% 12,200 61.2% 4,253 14.5% 2,599 61.1%<br />
1991-92 22,149 66.5% 12,008 54.2% 5,350 16.1% 2,828 52.9%<br />
1992-93 24,860 66.5% 11,941 48.0% 6,007 16.1% 2,733 45.5%<br />
1993-94 27,968 65.3% 11,806 42.2% 7,520 17.6% 2,780 37.0%<br />
1994-95 29,073 64.1% 11,373 39.1% 8,455 18.6% 3,021 35.7%<br />
1995-96 29,335 63.0% 11,282 38.5% 9,241 19.8% 3,164 34.2%<br />
1996-97 29,495 62.8% 11,363 38.5% 9,330 19.9% 3,215 34.5%<br />
1997-98 26,847 62.4% 11,221 41.8% 8,854 20.6% 3,449 39.0%<br />
1998-99 25,357 61.9% 11,160 44.0% 8,390 20.5% 3,378 40.3%<br />
1999-00 23,750 61.8% 11,126 46.8% 7,730 20.1% 3,533 45.7%<br />
2000-01 22,806 61.5% 11,221 49.2% 7,444 20.1% 3,533 47.5%<br />
2001-02 21,408 61.4% 11,060 51.7% 6,764 19.4% 3,459 51.1%<br />
Cont<strong>in</strong>ues on next page<br />
Association of American <strong>Medical</strong> Colleges
<strong>Diversity</strong> <strong>in</strong> <strong>Medical</strong> <strong>Education</strong>: <strong>Facts</strong> & <strong>Figures</strong> <strong>2012</strong><br />
Table 2: Number (%) of U.S. <strong>Medical</strong> School Applicants and Accepted Applicants by Race and<br />
Table 2: Number (%) of U.S. <strong>Medical</strong> School Applicants and Accepted Applicants<br />
Ethnicity, 1970–2001 (cont<strong>in</strong>ued)<br />
by Race and Ethnicity, 1970-2001 (cont<strong>in</strong>ued)<br />
Unknown<br />
Total<br />
First-Year<br />
Class<br />
# of<br />
Apps<br />
% of All<br />
Apps<br />
# of<br />
Accs<br />
% of<br />
Accs<br />
Apps Accs<br />
1970-71 — — — — 24,987 11,500<br />
1971-72 — — — — 29,172 12,335<br />
1972-73 — — — — 36,135 13,757<br />
1973-74 23,603 58.3% 11,938 50.6% 40,495 14,335<br />
1974-75 1,092 2.6% 421 38.6% 42,617 15,066<br />
1975-76 2,559 6.1% 672 26.3% 42,288 15,363<br />
1976-77 1,251 3.0% 228 18.2% 42,094 15,771<br />
1977-78 526 1.3% 150 28.5% 40,561 15,980<br />
1978-79 245 0.7% 50 20.4% 36,626 16,526<br />
1979-80 207 0.6% 61 29.5% 36,135 16,886<br />
1980-81 160 0.4% 76 47.5% 36,083 17,141<br />
1981-82 159 0.4% 57 35.8% 36,717 17,285<br />
1982-83 139 0.4% 66 47.5% 35,720 17,294<br />
1983-84 73 0.2% 43 58.9% 35,189 17,208<br />
1984-85 72 0.2% 44 61.1% 35,917 17,193<br />
1985-86 70 0.2% 47 67.1% 32,886 17,225<br />
1986-87 78 0.2% 51 65.4% 31,314 17,092<br />
1987-88 60 0.2% 26 43.3% 28,118 17,026<br />
1988-89 112 0.4% 56 50.0% 26,702 17,103<br />
1989-90 127 0.5% 46 36.2% 26,909 16,974<br />
1990-91 195 0.7% 67 34.4% 29,241 17,206<br />
1991-92 225 0.7% 100 44.4% 33,297 17,435<br />
1992-93 224 0.6% 74 33.0% 37,402 17,465<br />
1993-94 213 0.5% 57 26.8% 42,806 17,361<br />
1994-95 234 0.5% 47 20.1% 45,360 17,318<br />
1995-96 261 0.6% 40 15.3% 46,586 17,357<br />
1996-97 234 0.5% 42 17.9% 46,965 17,385<br />
1997-98 234 0.5% 62 26.5% 43,016 17,313<br />
1998-99 243 0.6% 129 53.1% 40,996 17,373<br />
1999-00 222 0.6% 113 50.9% 38,443 17,421<br />
2000-01 267 0.7% 176 65.9% 37,089 17,536<br />
2001-02 358 1.0% 265 74.0% 34,860 17,454<br />
* Native American <strong>in</strong>cludes Alaskan Natives and Native Hawaiians.<br />
† Ma<strong>in</strong>land and Commonwealth Puerto Rican are def<strong>in</strong>ed by state of legal residence.<br />
Source: The data from 1970-71 through 1972-73 are from F<strong>in</strong>al National Admission Action Summaries.<br />
The data from 1973-74 through 2001-02 are from <strong>AAMC</strong> DW: AMF. Archived 1/2004Contact: <strong>AAMC</strong> FACTS, facts@aamc.org<br />
62<br />
Association of American <strong>Medical</strong> Colleges
<strong>Diversity</strong> <strong>in</strong> <strong>Medical</strong> <strong>Education</strong>: <strong>Facts</strong> & <strong>Figures</strong> <strong>2012</strong><br />
Table 3: Number of U.S. <strong>Medical</strong> School Applicants and Accepted Applicants by Race and Ethnicity, 2002-2011<br />
Black/<br />
African American<br />
Year Apps Acc Apps Acc Apps Acc Apps Acc Apps Acc Apps Acc<br />
2002-03 2,858 1,284 344 163 6,500 3,511 95 37 20,446 11,152 30,202 16,124<br />
2003-04 2,963 1,228 342 168 6,834 3,562 98 38 21,330 11,332 31,342 16,132<br />
2004-05 3,004 1,264 383 176 7,464 3,585 103 37 22,007 11,443 32,163 16,148<br />
2005-06 3,013 1,228 383 171 8,089 3,862 102 41 22,801 11,471 33,454 16,330<br />
2006-07 3,073 1,280 332 149 8,257 3,830 180 67 23,567 11,672 34,852 16,716<br />
2007-08 3,322 1,282 349 148 9,134 4,113 182 58 25,071 11,755 37,502 17,105<br />
2008-09 3,168 1,265 333 154 8,971 4,089 187 57 24,717 11,715 37,343 17,274<br />
2009-10 3,313 1,293 312 140 9,219 4,226 180 62 24,426 11,709 37,569 17,527<br />
2010-11 3,264 1,319 362 178 9,473 4,322 164 56 24,408 11,704 37,764 17,651<br />
2011-12 3,407 1,332 308 135 9,818 4,472 139 48 25,074 12,145 38,813 18,165<br />
Year Apps Acc Apps Acc Apps Acc Apps Acc Apps Acc Apps Acc<br />
2002-03 798 410 683 353 182 90 909 404 2,443 1,193 943 274<br />
2003-04 869 395 577 319 195 94 1,013 401 2,490 1,146 959 264<br />
2004-05 923 443 571 323 192 110 1,062 448 2,546 1,242 1,026 272<br />
2005-06 989 472 593 350 204 122 1,111 463 2,713 1,328 1,204 328<br />
2006-07 1,012 490 619 338 244 114 1,023 458 2,779 1,339 1,477 363<br />
2007-08 1,093 487 688 336 254 119 1,083 456 3,003 1,347 1,810 406<br />
2008-09 1,058 508 739 371 294 162 1,132 495 3,086 1,469 1,801 391<br />
2009-10 1,030 488 750 385 300 146 1,120 510 3,060 1,468 1,639 336<br />
2010-11 791 432 789 420 328 145 1,514 682 3,271 1,611 1,706 379<br />
2011-12 888 472 761 404 375 189 1,614 710 3,459 1,701 1,647 310<br />
Year Apps Acc<br />
2002-03 33,624 17,592<br />
2003-04 34,791 17,542<br />
2004-05 35,735 17,662<br />
2005-06 37,372 17,986<br />
2006-07 39,108 18,418<br />
2007-08 42,315 18,858<br />
2008-09 42,231 19,135<br />
2009-10 42,268 19,331<br />
2010-11 42,741 19,641<br />
2011-12 43,919 20,176<br />
Note: These data reflect the results of the new separate race and ethnicity questions allow<strong>in</strong>g multiple responses, first used<br />
by AMCAS <strong>in</strong> 2002, and are not directly comparable to prior years. Data from 2002-03 forward derived from <strong>AAMC</strong> DW: AMF as<br />
of 12/21/2011.<br />
Contact: <strong>AAMC</strong> FACTS, facts@aamc.org<br />
Hispanic Ethnicities Alone or <strong>in</strong> Comb<strong>in</strong>ation, of any Race<br />
Mexican American Puerto Rican Cuban Other Hispanic U.S. Hispanic* Foreign<br />
Total†<br />
* U.S. Non-Hispanic and U.S. Hispanic totals are unduplicated totals and may not be equal to the sum of their subcategories.<br />
† Total <strong>in</strong>cludes students whose citizenship and/or race or Hispanic ethnicity could not be determ<strong>in</strong>ed.<br />
Source: <strong>AAMC</strong> DW: AMF<br />
Table 3: Number of U.S. <strong>Medical</strong> School Applicants and Accepted Applicants by Race and<br />
Ethnicity, 2002–2011<br />
Race Alone or <strong>in</strong> Comb<strong>in</strong>ation, Non-Hispanic<br />
American Indian or<br />
Alaska Native<br />
63<br />
Asian & Other Pacific<br />
Islander<br />
Native Hawaiian or<br />
OPI White<br />
U.S.<br />
Non-Hispanic*<br />
Association of American <strong>Medical</strong> Colleges
<strong>Diversity</strong> <strong>in</strong> <strong>Medical</strong> <strong>Education</strong>: <strong>Facts</strong> & <strong>Figures</strong> <strong>2012</strong><br />
Table 4: Number (%) of First-Year U.S. <strong>Medical</strong> Students by Race and Ethnicity,<br />
1968 - 2002<br />
Table 4: Number (%) of First-Year U.S. <strong>Medical</strong> Students by Race and Ethnicity, 1968–2002<br />
Black/African American Native American*<br />
Mexican American/<br />
Chicano<br />
Number % of Total Number % of Total Number % of Total<br />
Year Enrolled First-Year Enrolled First-Year Enrolled First-Year<br />
1968-69 266 2.7% 3 0.0% 20 0.2%<br />
1969-70 440 4.2% 7 0.1% 44 0.4%<br />
1970-71 697 6.1% 11 0.1% 73 0.6%<br />
1971-72 882 7.1% 23 0.2% 118 1.0%<br />
1972-73 957 7.0% 34 0.2% 137 1.0%<br />
1973-74 1,023 7.2% 44 0.3% 174 1.2%<br />
1974-75 1,106 7.5% 71 0.5% 227 1.5%<br />
1975-76 1,036 6.8% 60 0.4% 224 1.5%<br />
1976-77 1,040 6.7% 43 0.3% 245 1.6%<br />
1977-78 1,085 6.7% 51 0.3% 246 1.5%<br />
1978-79 1,061 6.4% 47 0.3% 260 1.6%<br />
1979-80 1,108 6.5% 63 0.4% 290 1.7%<br />
1980-81 1,128 6.6% 67 0.4% 258 1.5%<br />
1981-82 1,196 6.9% 70 0.4% 300 1.7%<br />
1982-83 1,145 6.6% 62 0.4% 305 1.8%<br />
1983-84 1,173 6.8% 75 0.4% 301 1.8%<br />
1984-85 1,148 6.8% 77 0.5% 329 1.9%<br />
1985-86 1,117 6.6% 60 0.4% 331 2.0%<br />
1986-87 1,174 7.0% 61 0.4% 331 2.0%<br />
1987-88 1,221 7.3% 68 0.4% 308 1.8%<br />
1988-89 1,210 7.2% 76 0.5% 295 1.7%<br />
1989-90 1,221 7.3% 82 0.5% 307 1.8%<br />
1990-91 1,263 7.5% 76 0.5% 285 1.7%<br />
1991-92 1,304 7.6% 93 0.5% 351 2.1%<br />
1992-93 1,425 8.3% 123 0.7% 447 2.6%<br />
1993-94 1,489 8.7% 129 0.8% 437 2.6%<br />
1994-95 1,519 8.9% 131 0.8% 501 2.9%<br />
1995-96 1,528 9.0% 150 0.9% 535 3.1%<br />
1996-97 1,423 8.4% 149 0.9% 501 3.0%<br />
1997-98 1,351 8.0% 137 0.8% 455 2.7%<br />
1997-98§ 1,347 8.0% 138 0.8% 464 2.8%<br />
1998-99§ 1,354 8.1% 165 1.0% 453 2.7%<br />
1999-00§ — — — — — —<br />
2000-01 1,243 7.4% 131 0.8% 434 2.6%<br />
2001-02 1,301 7.7% 129 0.8% 420 2.5%<br />
2002-03|| 1,394 8.2% 194 1.1% 428 2.5%<br />
64<br />
Cont<strong>in</strong>ues on next page<br />
Association of American <strong>Medical</strong> Colleges
<strong>Diversity</strong> <strong>in</strong> <strong>Medical</strong> <strong>Education</strong>: <strong>Facts</strong> & <strong>Figures</strong> <strong>2012</strong><br />
Table 4: Number (%) of First-Year U.S. <strong>Medical</strong> Students by Race and Ethnicity, 1968–2002<br />
Table 4: Number (%) of First-Year U.S. <strong>Medical</strong> Students by Race and Ethnicity, (cont<strong>in</strong>ued)<br />
1968 - 2002 (cont<strong>in</strong>ued)<br />
Ma<strong>in</strong>land<br />
Puerto Rican<br />
Commonwealth<br />
Puerto Rican<br />
Other Hispanic<br />
Number % of Total Number % of Total Number % of Total<br />
Year Enrolled First-Year Enrolled First-Year Enrolled First-Year<br />
1968-69 3 0.0% — — — —<br />
1969-70 10 0.1% — — — —<br />
1970-71 27 0.2% — — — —<br />
1971-72 40 0.3% — — — —<br />
1972-73 44 0.3% — — — —<br />
1973-74 56 0.4% — — — —<br />
1974-75 69 0.5% — — — —<br />
1975-76 71 0.5% — — 461 3.0%<br />
1976-77 72 0.5% — — 195 1.2%<br />
1977-78 68 0.4% 144 0.9% 157 1.0%<br />
1978-79 75 0.5% 179 1.1% 151 0.9%<br />
1979-80 86 0.5% 226 1.3% 188 1.1%<br />
1980-81 95 0.6% 241 1.4% 224 1.3%<br />
1981-82 105 0.6% 250 1.4% 247 1.4%<br />
1982-83 114 0.7% 229 1.3% 278 1.6%<br />
1983-84 109 0.6% 235 1.4% 248 1.4%<br />
1984-85 118 0.7% 236 1.4% 243 1.4%<br />
1985-86 136 0.8% 249 1.5% 259 1.5%<br />
1986-87 111 0.7% 236 1.4% 276 1.6%<br />
1987-88 116 0.7% 220 1.3% 283 1.7%<br />
1988-89 128 0.8% 239 1.4% 288 1.7%<br />
1989-90 139 0.8% 201 1.2% 317 1.9%<br />
1990-91 120 0.7% 216 1.3% 312 1.8%<br />
1991-92 128 0.7% 212 1.2% 315 1.8%<br />
1992-93 126 0.7% 236 1.4% 294 1.7%<br />
1993-94 106 0.6% 221 1.3% 309 1.8%<br />
1994-95 137 0.8% 214 1.3% 314 1.8%<br />
1995-96 127 0.7% 216 1.3% 331 1.9%<br />
1996-97 150 0.9% 219 1.3% 337 2.0%<br />
1997-98 113 0.7% 231 1.4% 299 1.8%<br />
1997-98§ 112 0.7% 234 1.4% 287 1.7%<br />
1998-99§ 116 0.7% 214 1.3% 319 1.9%<br />
1999-00§ — — — — — —<br />
2000-01 52 0.3% 187 1.1% 349 2.1%<br />
2001-02 38 0.2% 218 1.3% 352 2.1%<br />
2002-03|| 112 0.7% 231 1.4% 456 2.7%<br />
65<br />
Cont<strong>in</strong>ues on next page<br />
Association of American <strong>Medical</strong> Colleges
<strong>Diversity</strong> <strong>in</strong> <strong>Medical</strong> <strong>Education</strong>: <strong>Facts</strong> & <strong>Figures</strong> <strong>2012</strong><br />
Table 4: Table Number 4: Number (%) of First-Year (%) of First-Year U.S. <strong>Medical</strong> U.S. Students <strong>Medical</strong> by Students Race and by Ethnicity, Race and 1968–2002 Ethnicity,<br />
(cont<strong>in</strong>ued)<br />
1968 - 2002 (cont<strong>in</strong>ued)<br />
White<br />
Number % of Total<br />
Asian / Other Pacific<br />
Islander<br />
Number % of Total<br />
Unknown†<br />
Number % of Total Total First-Year<br />
Year Enrolled First-Year Enrolled First-Year Enrolled First-Year Enrollment‡<br />
1968-69 — — — — — — 9,863<br />
1969-70 — — — — — — 10,422<br />
1970-71 — — — — — — 11,348<br />
1971-72 — — — — — — 12,361<br />
1972-73 — — — — — — 13,677<br />
1973-74 — — — — — — 14,154<br />
1974-75 — — — — — — 14,763<br />
1975-76 13,156 86.0% 282 1.8% 5 0.0% 15,295<br />
1976-77 13,383 85.7% 348 2.2% 287 1.8% 15,613<br />
1977-78 13,732 85.1% 395 2.4% 258 1.6% 16,136<br />
1978-79 14,074 85.3% 452 2.7% 202 1.2% 16,501<br />
1979-80 14,259 84.2% 502 3.0% 208 1.2% 16,930<br />
1980-81 14,262 83.0% 572 3.3% 339 2.0% 17,186<br />
1981-82 14,218 82.3% 765 4.4% 117 0.7% 17,268<br />
1982-83 14,085 81.6% 936 5.4% 100 0.6% 17,254<br />
1983-84 13,909 81.1% 983 5.7% 117 0.7% 17,150<br />
1984-85 13,606 80.0% 1,124 6.6% 116 0.7% 16,997<br />
1985-86 13,378 78.9% 1,295 7.6% 138 0.8% 16,963<br />
1986-87 12,987 77.2% 1,514 9.0% 129 0.8% 16,819<br />
1987-88 12,511 74.9% 1,827 10.9% 159 1.0% 16,713<br />
1988-89 12,386 73.4% 2,100 12.4% 147 0.9% 16,868<br />
1989-90 12,039 71.8% 2,257 13.5% 193 1.2% 16,756<br />
1990-91 11,830 70.1% 2,527 15.0% 247 1.5% 16,876<br />
1991-92 11,677 68.4% 2,744 16.1% 247 1.4% 17,071<br />
1992-93 11,562 67.7% 2,615 15.3% 251 1.5% 17,079<br />
1993-94 11,463 67.0% 2,761 16.1% 206 1.2% 17,121<br />
1994-95 11,076 64.8% 2,943 17.2% 250 1.5% 17,085<br />
1995-96 10,907 63.9% 3,046 17.9% 218 1.3% 17,058<br />
1996-97 10,916 64.5% 3,039 17.9% 201 1.2% 16,935<br />
1997-98 10,784 63.9% 3,253 19.3% 103 0.6% 16,867<br />
1997-98§ 11,001 65.3% 3,129 18.6% 217 1.3% 16,844<br />
1998-99§ 10,846 64.6% 3,182 19.0% 128 0.8% 16,790<br />
1999-00§ — — — — — — 16,856<br />
2000-01 10,487 62.8% 3,265 19.6% 551 3.3% 16,699<br />
2001-02 10,509 62.3% 3,312 19.6% 596 3.5% 16,875<br />
2002-03|| 11,404 67.3% 3,657 21.6% 297 1.8% 16,953<br />
* Beg<strong>in</strong>n<strong>in</strong>g <strong>in</strong> 1997-98 the category "Native American" <strong>in</strong>cludes American Indians, Alaska Natives, and Native Hawaiians. Prior to that<br />
it <strong>in</strong>cluded only Native Americans and Alaska Natives.<br />
† After 1999-00, Unknown <strong>in</strong>cludes foreign students, students with unknown citizenship, and students with unknown race/ethnicity.<br />
‡ Includes new entrants and those repeat<strong>in</strong>g the <strong>in</strong>itial year.<br />
§ Data derived from the LCME Part II Questionnaire. Part II is adm<strong>in</strong>istered <strong>in</strong> the spr<strong>in</strong>g.<br />
|| Counts for 2002-03 may <strong>in</strong>dicate races and ethnicities <strong>in</strong> comb<strong>in</strong>ation or alone; thus they do not add to the unduplicated<br />
total first-year enrollment.<br />
Note: Races and ethnicities are reported only for U.S. citizens and permanent residents; prior to 1981 only U.S. citizens were <strong>in</strong>cluded.<br />
From 1998-99 forward, Commonwealth and Ma<strong>in</strong>land Puerto Rican status is calculated based on state of legal residence. Start<strong>in</strong>g<br />
<strong>in</strong> 2002-03, applicants have the option of report<strong>in</strong>g both their race and ethnicity alone or <strong>in</strong> comb<strong>in</strong>ation with some other race or ethnicity -<br />
thus, the data <strong>in</strong> this table cannot be directly compared with the follow<strong>in</strong>g years' data.<br />
Sources: <strong>AAMC</strong> FEQ 1968-69 through 1997-98; LCME Part II Questionnaire 1997-98 through 1999-00; <strong>AAMC</strong> DW: Student 2000-01<br />
forward. Archived 1/2004.<br />
Contact: <strong>AAMC</strong> FACTS, facts@aamc.org<br />
66<br />
Association of American <strong>Medical</strong> Colleges
<strong>Diversity</strong> <strong>in</strong> <strong>Medical</strong> <strong>Education</strong>: <strong>Facts</strong> & <strong>Figures</strong> <strong>2012</strong><br />
Table 5: Number of First-Year U.S. <strong>Medical</strong> School Enrollees by Race and Ethnicity, 2003–2011<br />
Table 5: Number of First-Year U.S. <strong>Medical</strong> School Enrolles by Race and Ethnicity,<br />
2003 - 2011<br />
Year<br />
African<br />
American<br />
American Indian<br />
or Alaska Native Asian<br />
67<br />
Hawaiian or<br />
OPI White<br />
U.S.<br />
Non-Hispanic*<br />
2003-04 1,277 160 3,515 37 10,841 15,651<br />
2004-05 1,276 178 3,491 36 10,969 15,950<br />
2005-06 1,260 173 3,730 42 10,919 15,790<br />
2006-07 1,294 148 3,666 61 11,150 16,166<br />
2007-08 1,380 179 3,981 64 12,128 16,521<br />
2008-09 1,367 181 4,032 64 12,066 16,609<br />
2009-10 1,417 168 4,206 66 12,268 17,112<br />
2010-11 1,431 203 4,315 61 12,293 17,175<br />
2011-12 1,384 129 4,442 52 11,951 17,989<br />
Year<br />
Race Alone or <strong>in</strong> Comb<strong>in</strong>ation, Non-Hispanic<br />
Hispanic Ethnicities<br />
Alone or <strong>in</strong> Comb<strong>in</strong>ation, of any Race<br />
Mexican<br />
American Puerto Rican Cuban<br />
Other<br />
Hispanic<br />
U.S.<br />
Hispanic* Foreign Total†<br />
2003-04 397 334 86 404 1,157 219 17,035<br />
2004-05 434 323 108 432 1,297 230 17,059<br />
2005-06 472 348 120 459 1,320 263 17,376<br />
2006-07 505 347 110 450 1,351 303 17,826<br />
2007-08 502 392 115 454 1,410 356 18,287<br />
2008-09 520 366 166 474 1,458 303 18,370<br />
2009-10 499 390 144 517 1,485 256 18,853<br />
2010-11 443 432 148 660 1,612 295 19,082<br />
2011-12 478 417 186 700 1,707 251 19,947<br />
* U.S. Non-Hispanic and U.S. Hispanic totals are unduplicated totals and may not be equal to the sum of their subcategories.<br />
† Total <strong>in</strong>cludes students whose citizenship and/or race or Hispanic ethnicity could not be determ<strong>in</strong>ed.<br />
Note: These data <strong>in</strong>clude new entrants and those repeat<strong>in</strong>g the <strong>in</strong>itial year. They also reflect the results of the new separate<br />
race and ethnicity questions allow<strong>in</strong>g multiple responses, first used by AMCAS <strong>in</strong> 2002, and are not directly comparable to<br />
prior years. Data from 2002-03 are not presented <strong>in</strong> this table because less than 50% of enrolled students had data<br />
from the new separate race and ethnicity questions. Data from 2011-12 derived from <strong>AAMC</strong> DW: SRS as of 12/8/2011; AMF<br />
as of 12/10/2011.<br />
Source: <strong>AAMC</strong> DW: Student file; DW: AMF<br />
Contact: <strong>AAMC</strong> FACTS, facts@aamc.org<br />
Association of American <strong>Medical</strong> Colleges
<strong>Diversity</strong> <strong>in</strong> <strong>Medical</strong> <strong>Education</strong>: <strong>Facts</strong> & <strong>Figures</strong> <strong>2012</strong><br />
Table 6: Number (%) of Total U.S. <strong>Medical</strong> School Enrollees by Race and Ethnicity, 1968–2001<br />
Table 6: Number (%) of Total U.S. <strong>Medical</strong> School Enrollees by Race and Ethnicity,<br />
1968 - 2001<br />
Black/African American<br />
Number % of Total Number % of Total Number % of Total<br />
Year Enrolled Enrollment Enrolled Enrollment Enrolled Enrollment<br />
1968-69 783 2.2% 9 0.0% 59 0.2%<br />
1969-70 1,042 2.8% 18 0.0% 92 0.2%<br />
1970-71 1,509 3.7% 18 0.0% 148 0.4%<br />
1971-72 2,055 4.7% 42 0.1% 252 0.6%<br />
1972-73 2,582 5.5% 69 0.1% 361 0.8%<br />
1973-74 3,049 6.0% 97 0.2% 496 1.0%<br />
1974-75 3,355 6.3% 159 0.3% 638 1.2%<br />
1975-76 3,456 6.2% 172 0.3% 699 1.3%<br />
1976-77 3,517 6.1% 186 0.3% 780 1.4%<br />
1977-78 3,587 6.0% 201 0.3% 831 1.4%<br />
1978-79 3,537 5.7% 202 0.3% 882 1.4%<br />
1979-80 3,627 5.7% 212 0.3% 964 1.5%<br />
1980-81 3,708 5.7% 221 0.3% 951 1.5%<br />
1981-82 3,884 5.9% 229 0.3% 1,040 1.6%<br />
1982-83 3,869 5.8% 235 0.4% 1,071 1.6%<br />
1983-84 3,892 5.8% 258 0.4% 1,082 1.6%<br />
1984-85 3,944 5.9% 257 0.4% 1,126 1.7%<br />
1985-86 3,849 5.8% 235 0.4% 1,143 1.7%<br />
1986-87 3,892 5.9% 242 0.4% 1,153 1.7%<br />
1987-88 3,968 6.0% 233 0.4% 1,144 1.7%<br />
1988-89 3,995 6.1% 237 0.4% 1,128 1.7%<br />
1989-90 4,145 6.4% 258 0.4% 1,087 1.7%<br />
1990-91 4,241 6.5% 277 0.4% 1,109 1.7%<br />
1991-92 4,334 6.6% 301 0.5% 1,205 1.8%<br />
1992-93 4,514 6.9% 353 0.5% 1,301 2.0%<br />
1993-94 4,789 7.2% 415 0.6% 1,423 2.1%<br />
1994-95 5,092 7.6% 465 0.7% 1,612 2.4%<br />
1995-96 5,309 7.9% 534 0.8% 1,781 2.7%<br />
1996-97 5,380 8.0% 563 0.8% 1,818 2.7%<br />
1997-98 5,298 7.9% 571 0.9% 1,843 2.8%<br />
1998-99 5,149 7.7% 585 0.9% 1,813 2.7%<br />
1999-00 5,033 7.6% 566 0.9% 1,734 2.6%<br />
2000-01 4,881 7.4% 530 0.8% 1,655 2.5%<br />
2001-02 4,746 7.2% 527 0.8% 1,630 2.5%<br />
68<br />
Native American*<br />
Mexican American/<br />
Chicano<br />
Cont<strong>in</strong>ues on next page<br />
Association of American <strong>Medical</strong> Colleges
<strong>Diversity</strong> <strong>in</strong> <strong>Medical</strong> <strong>Education</strong>: <strong>Facts</strong> & <strong>Figures</strong> <strong>2012</strong><br />
Table 6: Number (%) of Total U.S. <strong>Medical</strong> School Enrollees by Race and Ethnicity, 1968–2001<br />
Table 6: Number (%) of Total U.S. <strong>Medical</strong> School Enrollees by Race and Ethnici (cont<strong>in</strong>ued)<br />
1968 - 2001 (cont<strong>in</strong>ued)<br />
Ma<strong>in</strong>land<br />
Puerto Rican<br />
Number % of Total Number % of Total Number % of Total<br />
Year Enrolled Enrollment Enrolled Enrollment Enrolled Enrollment<br />
1968-69 3 0.0% — — — —<br />
1969-70 26 0.1% — — — —<br />
1970-71 48 0.1% — — — —<br />
1971-72 76 0.2% — — — —<br />
1972-73 90 0.2% — — — —<br />
1973-74 123 0.2% — — — —<br />
1974-75 172 0.3% — — — —<br />
1975-76 197 0.4% — — — —<br />
1976-77 232 0.4% — — — —<br />
1977-78 261 0.4% 532 0.9% 426 0.7%<br />
1978-79 277 0.4% 617 1.0% 489 0.8%<br />
1979-80 283 0.4% 700 1.1% 567 0.9%<br />
1980-81 329 0.5% 798 1.2% 683 1.0%<br />
1981-82 350 0.5% 856 1.3% 847 1.3%<br />
1982-83 369 0.6% 903 1.4% 962 1.4%<br />
1983-84 368 0.5% 925 1.4% 983 1.5%<br />
1984-85 380 0.6% 917 1.4% 987 1.5%<br />
1985-86 428 0.6% 896 1.3% 991 1.5%<br />
1986-87 435 0.7% 918 1.4% 1,015 1.5%<br />
1987-88 467 0.7% 899 1.4% 1,038 1.6%<br />
1988-89 438 0.7% 909 1.4% 1,091 1.7%<br />
1989-90 452 0.7% 817 1.3% 1,181 1.8%<br />
1990-91 457 0.7% 796 1.2% 1,176 1.8%<br />
1991-92 485 0.7% 817 1.2% 1,138 1.7%<br />
1992-93 455 0.7% 833 1.3% 1,199 1.8%<br />
1993-94 444 0.7% 859 1.3% 1,216 1.8%<br />
1994-95 466 0.7% 854 1.3% 1,231 1.8%<br />
1995-96 458 0.7% 870 1.3% 1,253 1.9%<br />
1996-97 489 0.7% 837 1.3% 1,282 1.9%<br />
1997-98 508 0.8% 831 1.2% 1,266 1.9%<br />
1998-99 485 0.7% 819 1.2% 1,268 1.9%<br />
1999-00 482 0.7% 786 1.2% 1,291 1.9%<br />
2000-01 467 0.7% 761 1.2% 1,307 2.0%<br />
2001-02 447 0.7% 764 1.2% 1,326 2.0%<br />
69<br />
Commonwealth<br />
Puerto Rican<br />
Other Hispanic<br />
Cont<strong>in</strong>ues on next page<br />
Association of American <strong>Medical</strong> Colleges
<strong>Diversity</strong> <strong>in</strong> <strong>Medical</strong> <strong>Education</strong>: <strong>Facts</strong> & <strong>Figures</strong> <strong>2012</strong><br />
Table 6: Number (%) of Total U.S. <strong>Medical</strong> School Enrollees by Race and Ethnicity, 1968–2001<br />
(cont<strong>in</strong>ued)<br />
Table 6: Number (%) of Total U.S. <strong>Medical</strong> School Enrollees by Race and Ethnicity,<br />
1968 - 2001 (cont<strong>in</strong>ued)<br />
White<br />
Number % of Total Number % of Total Number % of Total<br />
Year Enrolled Enrollment Enrolled Enrollment Enrolled Enrollment Enrollment<br />
1968-69 — — — — — — 35,833<br />
1969-70 — — — — — — 37,669<br />
1970-71 — — — — — — 40,487<br />
1971-72 — — — — — — 43,650<br />
1972-73 — — — — — — 47,366<br />
1973-74 — — — — — — 50,751<br />
1974-75 — — — — — — 53,554<br />
1975-76 — — — — — — 55,818<br />
1976-77 — — — — — — 57,765<br />
1977-78 51,974 86.6% 1,422 2.4% 941 1.6% 60,039<br />
1978-79 53,746 86.4% 1,592 2.6% 873 1.4% 62,213<br />
1979-80 54,854 86.0% 1,777 2.8% 998 1.6% 63,800<br />
1980-81 55,434 85.0% 1,924 3.0% 1,218 1.9% 65,189<br />
1981-82 56,201 84.8% 2,518 3.8% 646 1.0% 66,298<br />
1982-83 56,032 83.9% 2,936 4.4% 393 0.6% 66,748<br />
1983-84 56,167 83.4% 3,290 4.9% 419 0.6% 67,327<br />
1984-85 55,232 82.4% 3,763 5.6% 505 0.8% 67,016<br />
1985-86 54,335 81.6% 4,289 6.4% 319 0.5% 66,585<br />
1986-87 53,136 80.4% 4,883 7.4% 511 0.8% 66,125<br />
1987-88 51,728 78.7% 5,738 8.7% 578 0.9% 65,735<br />
1988-89 50,366 77.1% 6,595 10.1% 556 0.9% 65,300<br />
1989-90 48,961 75.3% 7,489 11.5% 756 1.2% 65,016<br />
1990-91 47,893 73.5% 8,436 12.9% 915 1.4% 65,163<br />
1991-92 47,094 71.8% 9,438 14.4% 1,003 1.5% 65,602<br />
1992-93 45,880 69.9% 9,988 15.2% 232 0.4% 65,591<br />
1993-94 45,427 68.6% 10,525 15.9% 245 0.4% 66,188<br />
1994-95 44,976 67.3% 11,065 16.6% 229 0.3% 66,796<br />
1995-96 44,374 66.3% 11,440 17.1% 175 0.3% 66,932<br />
1996-97 43,880 65.6% 11,876 17.8% 116 0.2% 66,903<br />
1997-98 43,284 64.7% 12,560 18.8% 91 0.1% 66,879<br />
1998-99 42,945 64.6% 12,741 19.2% 99 0.1% 66,476<br />
1999-00 42,609 64.3% 12,978 19.6% 161 0.2% 66,237<br />
2000-01 42,154 63.9% 13,264 20.1% 264 0.4% 65,963<br />
2001-02 41,737 63.2% 13,139 19.9% 330 0.5% 65,989<br />
* Beg<strong>in</strong>n<strong>in</strong>g <strong>in</strong> 1997-98, the category "Native American" <strong>in</strong>cludes American Indians, Alaska Natives, and Native Hawaiians.<br />
Prior to that it <strong>in</strong>cluded only American Indians and Alaska Natives.<br />
† After 1991-92, Unknown may or may not <strong>in</strong>clude foreign and unknown citizenship citizens.<br />
Note: Races and ethnicities are reported only for U.S. citizens and permanent residents; prior to 1981 only U.S. citizens were<br />
<strong>in</strong>cluded. S<strong>in</strong>ce 1998-99, Commonwealth and Ma<strong>in</strong>land Puerto Rican status is calculated based on state of legal residence at<br />
the time of application to medical school. Start<strong>in</strong>g 1992-93, data derived from DW: Student section reflect<strong>in</strong>g actively enrolled<br />
students as of 10/31 of the enrollment year. Data start<strong>in</strong>g <strong>in</strong> 1992-93 may be slightly undercounted (less than 1%) due<br />
to <strong>in</strong>sufficient enrollment status <strong>in</strong>formation.<br />
Source: <strong>AAMC</strong> FEQ, 1968-69 through 1997-98; <strong>AAMC</strong> DW: Student 1998-99 forward. Archived 1/04<br />
Contact: <strong>AAMC</strong> FACTS, facts@aamc.org<br />
70<br />
Asian / Other Pacific<br />
Islander<br />
Unknown†<br />
Total<br />
Association of American <strong>Medical</strong> Colleges
<strong>Diversity</strong> <strong>in</strong> <strong>Medical</strong> <strong>Education</strong>: <strong>Facts</strong> & <strong>Figures</strong> <strong>2012</strong><br />
Table 7: U.S. <strong>Medical</strong> School Total Enrollment by Race and Ethnicity,<br />
2002 - 2011<br />
Year<br />
Black/<br />
African American<br />
American<br />
Indian<br />
or Alaska<br />
Native Asian<br />
71<br />
Native<br />
Hawaiian or<br />
OPI White<br />
U.S.<br />
Non-Hispanic*<br />
2002-03 5,178 500 14,120 168 43,790 63,744<br />
2003-04 5,189 534 14,255 167 44,149 64,115<br />
2004-05 5,272 600 14,466 175 44,700 64,697<br />
2005-06 5,295 655 14,970 170 45,244 65,421<br />
2006-07 5,310 647 15,295 190 45,962 66,237<br />
2007-08 5,389 656 15,836 207 46,495 67,299<br />
2008-09 5,408 630 16,285 226 46,899 68,451<br />
2009-10 5,515 620 16,794 238 47,299 69,922<br />
2010-11 5,548 654 17,375 240 47,525 71,156<br />
2011-12 5,580 626 17,778 237 47,919 72,223<br />
Year<br />
Table 7: U.S. <strong>Medical</strong> School Total Enrollment by Race and Ethnicity, 2002–2011<br />
Race Alone or <strong>in</strong> Comb<strong>in</strong>ation, Non-Hispanic<br />
Hispanic Ethnicities<br />
Alone or <strong>in</strong> Comb<strong>in</strong>ation, of any Race<br />
Mexican<br />
American Puerto Rican Cuban<br />
Other<br />
Hispanic<br />
U.S.<br />
Hispanic* Foreign Total†<br />
2002-03 1,708 1,340 83 1,486 4,553 817 69,929<br />
2003-04 1,693 1,343 168 1,535 4,615 867 70,314<br />
2004-05 1,697 1,371 273 1,630 4,771 937 71,030<br />
2005-06 1,780 1,453 386 1,748 5,094 1,035 72,000<br />
2006-07 1,869 1,477 427 1,837 5,322 1,128 73,113<br />
2007-08 1,932 1,556 462 1,872 5,544 1,230 74,519<br />
2008-09 2,026 1,576 526 1,955 5,798 1,302 76,002<br />
2009-10 2,104 1,571 552 2,008 5,961 1,301 77,624<br />
2010-11 2,058 1,646 585 2,219 6,230 1,309 79,070<br />
2011-12 2,020 1,658 660 2,444 6,487 1,589 80,299<br />
* U.S. Non-Hispanic and U.S. Hispanic totals are unduplicated totals and may not be equal to the sum of their subcategories.<br />
† Total <strong>in</strong>cludes students whose citizenship and/or race or Hispanic ethnicity could not be determ<strong>in</strong>ed.<br />
Note: These data reflect the results of the separate race and ethnicity questions allow<strong>in</strong>g multiple responses, first used by<br />
AMCAS <strong>in</strong> 2002, and are not directly comparable to prior years. Data from 2002-03 forward derived from <strong>AAMC</strong> DW: Student<br />
file; AMF as of 10/26/2011.<br />
Source: <strong>AAMC</strong> DW: Student; AMF<br />
Contact: <strong>AAMC</strong> FACTS, facts@aamc.org<br />
Association of American <strong>Medical</strong> Colleges
<strong>Diversity</strong> <strong>in</strong> <strong>Medical</strong> <strong>Education</strong>: <strong>Facts</strong> & <strong>Figures</strong> <strong>2012</strong><br />
Table 8: Number (%) of U.S. <strong>Medical</strong> School Graduates by Race and Ethnicity, 1971–2010<br />
Table 8: Number (%) of U.S. <strong>Medical</strong> School Graduates by Race and Ethnicity,<br />
1971-72 - 2010-11<br />
Black or<br />
American Indian or Mexican American/<br />
African American<br />
Alaska Native*<br />
Chicano<br />
# of % of Total # of % of Total # of % of Total<br />
Year Graduates Graduates Graduates Graduates Graduates Graduates<br />
1971-72 229 2.4% 2 0.0% 19 0.2%<br />
1972-73 340 3.3% 8 0.1% 40 0.4%<br />
1973-74 511 4.5% 3 0.0% 80 0.7%<br />
1974-75 638 5.0% 22 0.2% 110 0.9%<br />
1975-76 743 5.4% 31 0.2% 130 1.0%<br />
1976-77 752 5.5% 29 0.2% 146 1.1%<br />
1977-78 791 5.5% 46 0.3% 166 1.2%<br />
1978-79 760 5.1% 49 0.3% 191 1.3%<br />
1979-80 768 5.1% 33 0.2% 192 1.3%<br />
1980-81 766 4.9% 43 0.3% 201 1.3%<br />
1981-82 763 4.8% 45 0.3% 225 1.4%<br />
1982-83 883 5.6% 45 0.3% 228 1.4%<br />
1983-84 818 5.0% 59 0.4% 220 1.3%<br />
1984-85 828 5.1% 65 0.4% 242 1.5%<br />
1985-86 824 5.1% 49 0.3% 233 1.4%<br />
1986-87 820 5.2% 63 0.4% 226 1.4%<br />
1987-88 850 5.3% 58 0.4% 241 1.5%<br />
1988-89 821 5.3% 57 0.4% 245 1.6%<br />
1989-90 874 5.7% 52 0.3% 249 1.6%<br />
1990-91 918 6.0% 46 0.3% 261 1.7%<br />
1991-92 817 5.3% 60 0.4% 258 1.7%<br />
1992-93 910 5.9% 69 0.4% 248 1.6%<br />
1993-94 931 6.0% 68 0.4% 244 1.6%<br />
1994-95 934 5.9% 61 0.4% 286 1.8%<br />
1995-96 1,015 6.4% 102 0.6% 384 2.4%<br />
1996-97 1,114 7.0% 114 0.7% 345 2.2%<br />
1997-98 1,192 7.5% 131 0.8% 415 2.6%<br />
1998-99 1,165 7.3% 129 0.8% 437 2.7%<br />
1999-00 1,116 7.1% 135 0.9% 426 2.7%<br />
2000-01 1,071 6.8% 93 0.6% 376 2.4%<br />
2001-02 1,087 6.9% 123 0.8% 383 2.4%<br />
2002-03§ 1,011 6.5% 101 0.7% 348 2.2%<br />
2003-04 1,032 6.5% 99 0.6% 390 2.5%<br />
2004-05 1,044 6.6% 96 0.6% 342 2.2%<br />
2005-06 1,123 7.1% 139 0.9% 360 2.3%<br />
2006-07 1,084 6.7% 123 0.8% 372 2.3%<br />
2007-08 1,113 6.9% 155 1.0% 388 2.4%<br />
2008-09 1,074 6.5% 130 0.8% 379 2.3%<br />
2009-10 1,137 6.8% 129 0.8% 434 2.6%<br />
2010-11 1,129 6.5% 135 0.8% 456 2.6%<br />
72<br />
Cont<strong>in</strong>ues on next page<br />
Association of American <strong>Medical</strong> Colleges
<strong>Diversity</strong> <strong>in</strong> <strong>Medical</strong> <strong>Education</strong>: <strong>Facts</strong> & <strong>Figures</strong> <strong>2012</strong><br />
Table 8: Number (%) of U.S. <strong>Medical</strong> School Graduates by Race and Ethnicity,<br />
Table 8: Number (%) of U.S. <strong>Medical</strong> School Graduates by Race and Ethnicity, 1971–2010 (cont<strong>in</strong>ued)<br />
1971-72 - 2010-11 (cont<strong>in</strong>ued)<br />
Puerto Rican†<br />
Ma<strong>in</strong>land†<br />
Puerto Rican<br />
Commonwealth†<br />
Puerto Rican<br />
Other Hispanic<br />
# of % of Total # of % of Total # of % of Total # of % of Total<br />
Year Graduates Graduates Graduates Graduates Graduates Graduates Graduates Graduates<br />
1971-72 — — 14 0.1% — — — —<br />
1972-73 — — 9 0.1% — — — —<br />
1973-74 — — 17 0.1% — — — —<br />
1974-75 — — 28 0.2% — — — —<br />
1975-76 — — 29 0.2% — — — —<br />
1976-77 — — 38 0.3% — — — —<br />
1977-78 — — 62 0.4% — — — —<br />
1978-79 — — 62 0.4% 123 0.8% 69 0.5%<br />
1979-80 — — 73 0.5% 116 0.8% 81 0.5%<br />
1980-81 — — 76 0.5% 150 1.0% 103 0.7%<br />
1981-82 — — 74 0.5% 145 0.9% 166 1.0%<br />
1982-83 — — 75 0.5% 211 1.3% 205 1.3%<br />
1983-84 — — 94 0.6% 208 1.3% 241 1.5%<br />
1984-85 — — 89 0.5% 229 1.4% 247 1.5%<br />
1985-86 — — 89 0.6% 200 1.2% 269 1.7%<br />
1986-87 — — 81 0.5% 208 1.3% 250 1.6%<br />
1987-88 — — 112 0.7% 224 1.4% 248 1.6%<br />
1988-89 — — 124 0.8% 232 1.5% 255 1.6%<br />
1989-90 — — 93 0.6% 211 1.4% 266 1.7%<br />
1990-91 — — 101 0.7% 190 1.2% 280 1.8%<br />
1991-92 — — 98 0.6% 215 1.4% 274 1.8%<br />
1992-93 — — 104 0.7% 195 1.3% 278 1.8%<br />
1993-94 — — 104 0.7% 214 1.4% 295 1.9%<br />
1994-95 — — 106 0.7% 203 1.3% 291 1.8%<br />
1995-96 — — 97 0.6% 225 1.4% 285 1.8%<br />
1996-97 — — 92 0.6% 204 1.3% 300 1.9%<br />
1997-98 — — 119 0.7% 201 1.3% 300 1.9%<br />
1998-99 — — 112 0.7% 206 1.3% 313 2.0%<br />
1999-00 — — 120 0.8% 191 1.2% 311 2.0%<br />
2000-01† 283 1.8% — — — — 274 1.7%<br />
2001-02 284 1.8% — — — — 292 1.9%<br />
2002-03§ 278 1.8% — — — — 323 2.1%<br />
2003-04 306 1.9% — — — — 312 2.0%<br />
2004-05 273 1.7% — — — — 320 2.0%<br />
2005-06 288 1.8% — — — — 338 2.1%<br />
2006-07 282 1.7% — — — — 373 2.3%<br />
2007-08 327 2.0% — — — — 374 2.3%<br />
2008-09 346 2.1% — — — — 412 2.5%<br />
2009-10 308 1.8% — — — — 409 2.4%<br />
2010-11 357 2.1% — — — — 422 2.4%<br />
73<br />
Cont<strong>in</strong>ues on next page<br />
Association of American <strong>Medical</strong> Colleges
<strong>Diversity</strong> <strong>in</strong> <strong>Medical</strong> <strong>Education</strong>: <strong>Facts</strong> & <strong>Figures</strong> <strong>2012</strong><br />
Table 8: Number (%) of U.S. <strong>Medical</strong> School Graduates by Race and Ethnicity,<br />
1971–2010<br />
Table<br />
(cont<strong>in</strong>ued)<br />
8: Number (%) of U.S. <strong>Medical</strong> School Graduates by Race and Ethnicity,<br />
1971-72 - 2010-11 (cont<strong>in</strong>ued)<br />
White Asian<br />
Unknown/No Race<br />
Response‡<br />
Total<br />
# of % of Total # of % of Total # of % of Total<br />
Year Graduates Graduates Graduates Graduates Graduates Graduates Graduates<br />
1971-72 — — — — — — 9,558<br />
1972-73 — — — — — — 10,396<br />
1973-74 — — — — — — 11,365<br />
1974-75 — — — — — — 12,716<br />
1975-76 — — — — — — 13,634<br />
1976-77 — — — — — — 13,614<br />
1977-78 — — — — — — 14,391<br />
1978-79 12,628 85.4% 378 2.6% 524 3.5% 14,784<br />
1979-80 12,788 84.6% 412 2.7% 650 4.3% 15,113<br />
1980-81 13,201 84.4% 456 2.9% 636 4.1% 15,632<br />
1981-82 13,826 86.3% 528 3.3% 240 1.5% 16,012<br />
1982-83 13,504 85.5% 594 3.8% 57 0.4% 15,802<br />
1983-84 14,004 85.7% 679 4.2% 20 0.1% 16,343<br />
1984-85 13,788 84.5% 750 4.6% 80 0.5% 16,318<br />
1985-86 13,413 83.2% 909 5.6% 131 0.8% 16,117<br />
1986-87 13,144 83.0% 947 6.0% 91 0.6% 15,830<br />
1987-88 13,002 81.7% 1,119 7.0% 65 0.4% 15,919<br />
1988-89 12,606 80.7% 1,241 7.9% 49 0.3% 15,630<br />
1989-90 12,075 78.4% 1,433 9.3% 145 0.9% 15,398<br />
1990-91 11,792 76.4% 1,687 10.9% 152 1.0% 15,427<br />
1991-92 11,556 75.3% 1,885 12.3% 193 1.3% 15,356<br />
1992-93 11,427 73.8% 2,036 13.2% 30 0.2% 15,474<br />
1993-94 11,071 71.4% 2,338 15.1% 47 0.3% 15,504<br />
1994-95 11,142 70.2% 2,579 16.2% 69 0.4% 15,883<br />
1995-96 10,946 68.9% 2,544 16.0% 75 0.5% 15,886<br />
1996-97 10,965 69.0% 2,537 16.0% 47 0.3% 15,890<br />
1997-98 10,547 66.1% 2,826 17.7% 39 0.2% 15,958<br />
1998-99 10,508 65.7% 2,989 18.7% 13 0.1% 16,003<br />
1999-00 10,451 66.5% 2,849 18.1% 11 0.1% 15,718<br />
2000-01 10,274 65.0% 3,049 19.3% 174 1.1% 15,796<br />
2001-02 10,044 64.1% 3,042 19.4% 221 1.4% 15,676<br />
2002-03§ 9,899 63.7% 3,167 20.4% 215 1.4% 15,531<br />
2003-04 10,121 63.9% 3,171 20.0% 217 1.4% 15,829<br />
2004-05 10,035 63.7% 3,118 19.8% 312 2.0% 15,760<br />
2005-06 10,029 63.0% 3,231 20.3% 306 1.9% 15,927<br />
2006-07 10,310 63.9% 3,300 20.4% 268 1.7% 16,140<br />
2007-08 10,358 64.1% 3,324 20.6% 245 1.5% 16,168<br />
2008-09 10,498 63.8% 3,481 21.1% 289 1.8% 16,467<br />
2009-10 10,667 63.4% 3,505 20.8% 318 1.9% 16,838<br />
2010-11 10,783 62.1% 3,767 21.7% 166 1.0% 17,364<br />
* In 1997-98 the category "Native American" was redef<strong>in</strong>ed to <strong>in</strong>clude American Indians, Alaska Natives, and Native<br />
Hawaiians. Prior to 1997-98 and after 2000-01 this category <strong>in</strong>cluded only Native Americans and Alaska Natives.<br />
† From 2000-01, "Puerto Rican" is reported without splitt<strong>in</strong>g <strong>in</strong>to Ma<strong>in</strong>land and Commonwealth subcategories.<br />
‡ From 1992-93 through 1999-00, Unknown may or may not <strong>in</strong>clude foreign persons and those with unknown citizenship.<br />
§ From 2002-03, counts may <strong>in</strong>dicate races and ethnicities <strong>in</strong> comb<strong>in</strong>ation or alone.<br />
Note: Races and ethnicities are reported only for U.S. citizens and permanent residents; prior to 1981 only U.S. citizens<br />
were <strong>in</strong>cluded. Percent of Total Graduates may not add to 100% due to selected race and ethnic groups. Statistics for<br />
1971-72 through 1981-82 were derived from LCME Part II Survey; after 1981-82, statistics are derived from <strong>AAMC</strong> DW: Student.<br />
Data from 2001-02 forward derived from the <strong>AAMC</strong> DW: Student file; Applicant Matriculant File as of 9/8/2011.<br />
Sources: LCME Part II Survey; <strong>AAMC</strong> DW: Student; DW: AMF<br />
Contact: <strong>AAMC</strong> FACTS, facts@aamc.org<br />
74<br />
Association of American <strong>Medical</strong> Colleges
<strong>Diversity</strong> <strong>in</strong> <strong>Medical</strong> <strong>Education</strong>: <strong>Facts</strong> & <strong>Figures</strong> <strong>2012</strong><br />
Table 9: Number (%) of Applicants, Accepted Applicants, and Matriculants to U.S. <strong>Medical</strong> Schools<br />
Table 9: Number (%) of Women Applicants, Accepted Applicants, and Matriculantsfor<br />
Women, 1960–2011<br />
to U.S. <strong>Medical</strong> Schools, 1960 - 2011<br />
Applicants<br />
First-Year Women as Women as Women as<br />
Class Total Women % of Total Total Women % of Total Total Women % of Total<br />
1960-61 14,397 1,044 7.3% 8,560 600 7.0% 8,069 — —<br />
1961-62 14,331 1,116 7.8% 8,682 736 8.5% 8,143 — —<br />
1962-63 15,847 1,201 7.6% 8,959 717 8.0% 8,394 — —<br />
1963-64 17,668 1,432 8.1% 9,063 758 8.4% 8,565 — —<br />
1964-65 19,168 1,731 9.0% 9,043 824 9.1% 8,587 — —<br />
1965-66 18,703 1,676 9.0% 9,012 799 8.9% 8,554 799 9.3%<br />
1966-67 18,250 1,696 9.3% 9,123 856 9.4% 8,775 856 9.8%<br />
1967-68 18,724 1,951 10.4% 9,702 984 10.1% 9,314 909 9.8%<br />
1968-69 21,118 2,097 9.9% 10,092 976 9.7% 9,740 876 9.0%<br />
1969-70 24,465 2,289 9.4% 10,547 1,011 9.6% 10,269 929 9.0%<br />
1970-71 24,987 2,734 10.9% 11,500 1,297 11.3% 11,169 1,228 11.0%<br />
1971-72 29,172 3,737 12.8% 12,335 1,685 13.7% 12,088 1,653 13.7%<br />
1972-73 36,135 5,480 15.2% 13,757 2,359 17.1% 13,570 2,251 16.6%<br />
1973-74 40,495 7,201 17.8% 14,335 2,847 19.9% 13,771 2,709 19.7%<br />
1974-75 42,614 8,709 20.4% 15,065 3,391 22.5% 14,575 3,262 22.4%<br />
1975-76* 42,282 9,590 22.7% 15,360 3,642 23.7% 14,897 3,511 23.6%<br />
1976-77 42,064 10,221 24.3% 15,771 3,922 24.9% 15,266 3,771 24.7%<br />
1977-78 40,560 10,194 25.1% 15,980 4,080 25.5% 15,492 3,944 25.5%<br />
1978-79* 36,626 9,536 26.0% 16,526 4,174 25.3% 16,054 4,026 25.1%<br />
1979-80* 36,135 10,195 28.2% 16,886 4,730 28.0% 16,311 4,536 27.8%<br />
1980-81 36,083 10,657 29.5% 17,141 4,948 28.9% 16,587 4,757 28.7%<br />
1981-82 36,717 11,671 31.8% 17,285 5,333 30.9% 16,660 5,113 30.7%<br />
1982-83 35,720 11,681 32.7% 17,294 5,451 31.5% 16,567 5,201 31.4%<br />
1983-84 35,189 11,958 34.0% 17,208 5,632 32.7% 16,480 5,366 32.6%<br />
1984-85 35,917 12,466 34.7% 17,193 5,731 33.3% 16,395 5,469 33.4%<br />
1985-86 32,885 11,558 35.1% 17,225 5,857 34.0% 16,268 5,520 33.9%<br />
1986-87 31,314 11,263 36.0% 17,092 5,933 34.7% 16,103 5,574 34.6%<br />
1987-88 28,118 10,409 37.0% 17,025 6,204 36.4% 15,927 5,767 36.2%<br />
1988-89 26,702 10,256 38.4% 17,102 6,322 37.0% 15,969 5,878 36.8%<br />
75<br />
Accepted Applicants<br />
Matriculants<br />
Cont<strong>in</strong>ues on next page<br />
Association of American <strong>Medical</strong> Colleges
<strong>Diversity</strong> <strong>in</strong> <strong>Medical</strong> <strong>Education</strong>: <strong>Facts</strong> & <strong>Figures</strong> <strong>2012</strong><br />
Table Table 9: Number 9: Number (%) (%) of Applicants, of Women Accepted Applicants, Applicants, Accepted and Applicants, Matriculants and to Matriculants<br />
U.S. <strong>Medical</strong> Schools<br />
for Women, to 1960–2011 U.S. <strong>Medical</strong> (cont<strong>in</strong>ued)<br />
Schools, 1960 - 2011 (cont<strong>in</strong>ued)<br />
Applicants Accepted Applicants Matriculants<br />
First-Year Women as Women as Women as<br />
Class Total Women % of Total Total Women % of Total Total Women % of Total<br />
1991-92 33,297 13,699 41.1% 17,435 6,943 39.8% 16,211 6,433 39.7%<br />
1992-93 37,402 15,618 41.8% 17,465 7,257 41.6% 16,289 6,772 0.4%<br />
1993-94 42,806 17,957 41.9% 17,361 7,288 42.0% 16,307 6,851 42.0%<br />
1994-95 45,360 18,967 41.8% 17,318 7,255 41.9% 16,287 6,819 41.9%<br />
1995-96 46,586 19,776 42.5% 17,356 7,437 42.8% 16,252 6,941 42.7%<br />
1996-97 46,965 20,028 42.6% 17,385 7,439 42.8% 16,201 6,918 42.7%<br />
1997-98 43,016 18,271 42.5% 17,312 7,484 43.2% 16,164 6,994 43.3%<br />
1998-99 40,996 17,785 43.4% 17,373 7,685 44.2% 16,170 7,162 44.3%<br />
1999-00 38,443 17,395 45.2% 17,421 7,966 45.7% 16,221 7,412 45.7%<br />
2000-01 37,088 17,273 46.6% 17,535 8,027 45.8% 16,301 7,472 45.8%<br />
2001-02 34,860 16,718 48.0% 17,454 8,294 47.5% 16,365 7,784 47.6%<br />
2002-03 33,624 16,556 49.2% 17,592 8,631 49.1% 16,488 8,113 49.2%<br />
2003-04 34,791 17,672 50.8% 17,542 8,732 49.8% 16,541 8,212 49.6%<br />
2004-05 35,735 18,018 50.4% 17,662 8,768 49.6% 16,648 8,235 49.5%<br />
2005-06 37,372 18,625 49.8% 17,986 8,765 48.7% 17,003 8,239 48.5%<br />
2006-07 39,108 19,293 49.3% 18,418 8,943 48.6% 17,361 8,438 48.6%<br />
2007-08 42,315 20,735 49.0% 18,858 9,107 48.3% 17,759 8,582 48.3%<br />
2008-09† 42,231 20,360 48.2% 19,135 9,181 48.0% 18,036 8,614 47.8%<br />
2009-10† 42,268 20,252 47.9% 19,331 9,264 47.9% 18,390 8,817 47.9%<br />
2010-11† 42,741 20,207 47.3% 19,641 9,237 47.0% 18,665 8,756 46.9%<br />
2011-12 43,919 20,780 47.3% 20,176 9,495 47.1% 19,230 9,037 47.0%<br />
* Totals <strong>in</strong>clude less than 1% for whom gender <strong>in</strong>formation was not available.<br />
† Totals <strong>in</strong>clude one applicant <strong>in</strong> 2008, three <strong>in</strong> 2009, one <strong>in</strong> 2010, and four <strong>in</strong> 2011 who decl<strong>in</strong>ed to report gender.<br />
Sources: Data for 1960-61 through 1968-69 derived from JAMA <strong>Education</strong> Issue. From 1970-71 through 1972-73 data derived from<br />
F<strong>in</strong>al National Admission Action Summaries. Data from 1973-74 forward from <strong>AAMC</strong> DW: AMF, updated as of 12/21/2011 for data<br />
from 1995-96 and forward.<br />
Contact: <strong>AAMC</strong> FACTS, facts@aamc.org<br />
76<br />
Association of American <strong>Medical</strong> Colleges
<strong>Diversity</strong> <strong>in</strong> <strong>Medical</strong> <strong>Education</strong>: <strong>Facts</strong> & <strong>Figures</strong> <strong>2012</strong><br />
Table 10: U.S. <strong>Medical</strong> School Applicants, First-Time Applicants, Acceptants, and Matriculants by<br />
Gender and Race and Ethnicity, 2009–2011<br />
Table 10: U.S. <strong>Medical</strong> School Applicants, First-Time Applicants, Acceptants, and Matriculants<br />
by Gender and Race and Ethnicity, 2009-2011<br />
Women<br />
Men<br />
Hispanic /<br />
Lat<strong>in</strong>o<br />
Hispanic /<br />
Lat<strong>in</strong>o<br />
Non-Hispanic /<br />
Lat<strong>in</strong>o<br />
Others<br />
Total<br />
Hispanic /<br />
Lat<strong>in</strong>o<br />
All<br />
Applicants<br />
Non-Hispanic /<br />
Lat<strong>in</strong>o<br />
Others<br />
Total<br />
Gender / Race and Ethnicity<br />
Non-Hispanic /<br />
Lat<strong>in</strong>o<br />
Others<br />
Total<br />
77<br />
Applicants<br />
First-<br />
Time<br />
Applicants<br />
2009 2010 2011<br />
Acceptants<br />
Matriculants<br />
Applicants<br />
First-<br />
Time<br />
Applicants<br />
Acceptants<br />
Matriculants<br />
Applicants<br />
First-<br />
Time<br />
Applicants<br />
Acceptants<br />
Matriculants<br />
Cuban 130 104 61 57 132 106 61 59 160 133 90 86<br />
Mexican American 502 373 239 229 340 259 190 179 378 293 210 202<br />
Puerto Rican 395 309 195 187 391 316 202 194 390 309 190 189<br />
Other Hispanic 550 393 241 233 716 550 308 290 773 581 338 318<br />
Multihispanic 80 58 36 35 78 62 32 31 103 80 49 48<br />
Subtotal 1,657 1,237 772 741 1,657 1,293 793 753 1,804 1,396 877 843<br />
Black or African American 2,095 1,415 748 713 2,004 1,339 758 730 2,108 1,435 763 737<br />
American Indian or Alaska Native 60 47 23 20 61 42 32 30 53 40 26 24<br />
Native Hawaiian or OPI 52 33 16 15 49 37 14 13 47 36 11 11<br />
White 10,305 7,897 5,026 4,773 10,205 7,943 4,948 4,692 10,451 8,179 5,050 4,808<br />
Asian 4,170 3,079 1,938 1,881 4,225 3,181 1,951 1,888 4,296 3,232 1,981 1,891<br />
Other Race 36 20 11 11 6 2 2 2 9 7 2 2<br />
Multiraces 535 404 270 260 571 426 285 262 585 452 304 291<br />
No Race Reponse 524 457 283 268 564 480 276 262 607 527 323 312<br />
Foreign 818 620 177 135 865 698 178 124 820 649 158 118<br />
20,252 15,209 9,264 8,817 20,207 15,441 9,237 8,756 20,780 15,953 9,495 9,037<br />
Cuban 108 81 57 56 133 104 54 53 142 107 66 62<br />
Mexican American 476 349 225 220 394 305 219 211 438 328 236 224<br />
Puerto Rican 288 219 158 152 331 276 190 183 287 224 173 170<br />
Other Hispanic 474 334 232 219 686 492 321 305 714 508 325 311<br />
Multihispanic* 57 43 24 24 70 50 34 34 74 56 24 23<br />
Subtotal 1,403 1,026 696 671 1,614 1,227 818 786 1,655 1,223 824 790<br />
Black or African American 1,011 722 438 423 1,058 717 468 444 1,107 770 468 445<br />
American Indian or Alaska Native 51 37 28 25 53 36 23 21 48 38 20 17<br />
Native Hawaiian or OPI 63 48 18 18 37 22 12 12 36 26 10 10<br />
White 13,186 9,415 6,210 5,921 13,187 9,523 6,251 5,963 13,506 9,689 6,527 6,252<br />
Asian 4,331 3,057 1,930 1,853 4,459 3,174 1,997 1,924 4,645 3,286 2,048 1,968<br />
Other Race 27 17 7 7 3 2 1 1 4 2 2 2<br />
Multiraces 503 351 245 234 571 411 264 252 612 426 299 288<br />
No Race Reponse 617 533 336 315 710 618 369 349 695 584 331 311<br />
Foreign 821 644 159 106 841 660 201 157 827 654 152 110<br />
22,013 15,850 10,067 9,573 22,533 16,390 10,404 9,909 23,135 16,698 10,681 10,193<br />
Cuban 238 185 118 113 265 210 115 112 302 240 156 148<br />
Mexican American 978 722 464 449 734 564 409 390 816 621 446 426<br />
Puerto Rican 683 528 353 339 722 592 392 377 677 533 363 359<br />
Other Hispanic 1,024 727 473 452 1,402 1,042 629 595 1,487 1,089 663 629<br />
Multihispanic 137 101 60 59 148 112 66 65 177 136 73 71<br />
Subtotal 3,060 2,263 1,468 1,412 3,271 2,520 1,611 1,539 3,459 2,619 1,701 1,633<br />
Black or African American 3,106 2,137 1,186 1,136 3,062 2,056 1,226 1,174 3,215 2,205 1,231 1,182<br />
American Indian or Alaska Native 111 84 51 45 114 78 55 51 101 78 46 41<br />
Native Hawaiian or OPI 115 81 34 33 86 59 26 25 84 63 21 21<br />
White 23,493 17,314 11,236 10,694 23,392 17,466 11,199 10,655 23,958 17,869 11,577 11,060<br />
Asian 8,501 6,136 3,868 3,734 8,684 6,355 3,948 3,812 8,941 6,518 4,029 3,859<br />
Other Race 63 37 18 18 9 4 3 3 13 9 4 4<br />
Multiraces 1,038 755 515 494 1,142 837 549 514 1,197 878 603 579<br />
No Race Reponse 1,142 991 619 583 1,275 1,099 645 611 1,304 1,112 654 623<br />
Foreign 1,639 1,264 336 241 1,706 1,358 379 281 1,647 1,303 310 228<br />
42,268 31,062 19,331 18,390 42,741 31,832 19,641 18,665 43,919 32,654 20,176 19,230<br />
*=Three students <strong>in</strong> 2009, one student <strong>in</strong> 2010, and four students <strong>in</strong> 2011 did not report sex, therefore, they were excluded <strong>in</strong> the report when sex was tabulated.<br />
Source: <strong>AAMC</strong> Data Warehouse: Applicant Matriculant File, as of 3/6/<strong>2012</strong>.<br />
Association of American <strong>Medical</strong> Colleges
<strong>Diversity</strong> <strong>in</strong> <strong>Medical</strong> <strong>Education</strong>: <strong>Facts</strong> & <strong>Figures</strong> <strong>2012</strong><br />
Table 11: Undergraduate Institutions Supply<strong>in</strong>g ≥200 Applicants to U.S. <strong>Medical</strong> Schools, 2011<br />
Table 11: Undergraduate Institutions Supply<strong>in</strong>g >=200 Applicants<br />
to U.S. <strong>Medical</strong> Schools, 2011<br />
Undergraduate Institutions<br />
78<br />
Total<br />
Applicants from<br />
the School<br />
% of All<br />
National<br />
Applicants<br />
University of California-Los Angeles,Los Angeles,CA 820 1.87%<br />
University of Michigan-Ann Arbor,Ann Arbor,MI 774 1.76%<br />
University of California-Berkeley,Berkeley,CA 754 1.72%<br />
University of Florida,Ga<strong>in</strong>esville,FL 741 1.69%<br />
University of Texas at Aust<strong>in</strong>,Aust<strong>in</strong>,TX 695 1.58%<br />
University of California-San Diego,La Jolla,CA 541 1.23%<br />
Cornell University,Ithaca,NY 471 1.07%<br />
University of Wiscons<strong>in</strong>-Madison,Madison,WI 455 1.04%<br />
University of Ill<strong>in</strong>ois at Urbana-Champaign,Champaign,IL 448 1.02%<br />
University of California-Davis,Davis,CA 410 0.93%<br />
University of Georgia,Athens,GA 404 0.92%<br />
University of Wash<strong>in</strong>gton,Seattle,WA 362 0.82%<br />
University of California-Irv<strong>in</strong>e,Irv<strong>in</strong>e,CA 361 0.82%<br />
University of North Carol<strong>in</strong>a at Chapel Hill,Chapel Hill,NC 360 0.82%<br />
Johns Hopk<strong>in</strong>s University,Baltimore,MD 358 0.82%<br />
Brigham Young University,Provo,UT 356 0.81%<br />
Duke University,Durham,NC 355 0.81%<br />
Ohio State University-Ma<strong>in</strong> Campus,Columbus,OH 351 0.80%<br />
Emory University,Atlanta,GA 332 0.76%<br />
University of Pennsylvania,Philadelphia,PA 331 0.75%<br />
Michigan State University,East Lans<strong>in</strong>g,MI 326 0.74%<br />
University of Miami,Coral Gables,FL 324 0.74%<br />
Stanford University,Stanford,CA 312 0.71%<br />
University of Notre Dame,Notre Dame,IN 309 0.70%<br />
Rutgers University-New Brunswick,New Brunswick,NJ 305 0.69%<br />
Northwestern University-Evanston,Evanston,IL 302 0.69%<br />
University of Arizona,Tucson,AZ 301 0.69%<br />
Harvard University,Cambridge,MA 296 0.67%<br />
New York University,New York,NY 294 0.67%<br />
Baylor University,Waco,TX 292 0.66%<br />
University of M<strong>in</strong>nesota-Tw<strong>in</strong> Cities,M<strong>in</strong>neapolis,MN 292 0.66%<br />
Wash<strong>in</strong>gton University <strong>in</strong> St. Louis,St. Louis,MO 291 0.66%<br />
University of Southern California,Los Angeles,CA 278 0.63%<br />
University of Maryland-College Park,College Park,MD 276 0.63%<br />
Pennsylvania State University-Ma<strong>in</strong> Campus,University Park,PA 271 0.62%<br />
Boston University,Boston,MA 270 0.61%<br />
Louisiana St University and Agricultural and Mechanical Col,Baton Rouge,LA 265 0.60%<br />
Brown University,Providence,RI 252 0.57%<br />
Vanderbilt University,Nashville,TN 246 0.56%<br />
Florida State University,Tallahassee,FL 232 0.53%<br />
University of South Florida,Tampa,FL 229 0.52%<br />
University of Toronto,Toronto,ON 226 0.51%<br />
Indiana University-Bloom<strong>in</strong>gton,Bloom<strong>in</strong>gton,IN 224 0.51%<br />
State University of New York at Stony Brook,Stony Brook,NY 220 0.50%<br />
University of Central Florida,Orlando,FL 212 0.48%<br />
Yale University,New Haven,CT 206 0.47%<br />
University of Oklahoma Norman Campus,Norman,OK 202 0.46%<br />
Arizona State University,Tempe,AZ 201 0.46%<br />
Note: Total national applicants = 43,919<br />
Source:<strong>AAMC</strong> Data Warehouse:Applicant Matriculant File, as of March 14, <strong>2012</strong>.<br />
Association of American <strong>Medical</strong> Colleges
<strong>Diversity</strong> <strong>in</strong> <strong>Medical</strong> <strong>Education</strong>: <strong>Facts</strong> & <strong>Figures</strong> <strong>2012</strong><br />
Table 12: Undergraduate Institutions Supply<strong>in</strong>g ≥50 Asian Applicants to U.S. <strong>Medical</strong> Schools, 2011<br />
Table 12: Undergraduate Institutions Supply<strong>in</strong>g >=50 Asian Applicants<br />
to U.S. <strong>Medical</strong> Schools, 2011<br />
79<br />
Total<br />
Applicants<br />
from the<br />
School<br />
% of All<br />
National<br />
Applicants<br />
# of Asian % of All Asian<br />
Undergraduate Institutions<br />
Applicants Applicants<br />
University of California-Berkeley,Berkeley,CA 485 4.86% 754 1.72%<br />
University of California-Los Angeles,Los Angeles,CA 434 4.35% 820 1.87%<br />
University of California-San Diego,La Jolla,CA 300 3.01% 541 1.23%<br />
University of Texas at Aust<strong>in</strong>,Aust<strong>in</strong>,TX 278 2.79% 695 1.58%<br />
University of Michigan-Ann Arbor,Ann Arbor,MI 205 2.05% 774 1.76%<br />
University of California-Irv<strong>in</strong>e,Irv<strong>in</strong>e,CA 198 1.98% 361 0.82%<br />
University of California-Davis,Davis,CA 193 1.93% 410 0.93%<br />
Johns Hopk<strong>in</strong>s University,Baltimore,MD 183 1.83% 358 0.82%<br />
Cornell University,Ithaca,NY 171 1.71% 471 1.07%<br />
University of Ill<strong>in</strong>ois at Urbana-Champaign,Champaign,IL 163 1.63% 448 1.02%<br />
University of Wash<strong>in</strong>gton,Seattle,WA 153 1.53% 362 0.82%<br />
Northwestern University-Evanston,Evanston,IL 146 1.46% 302 0.69%<br />
University of Florida,Ga<strong>in</strong>esville,FL 146 1.46% 741 1.69%<br />
Rutgers University-New Brunswick,New Brunswick,NJ 136 1.36% 305 0.69%<br />
Stanford University,Stanford,CA 130 1.30% 312 0.71%<br />
Duke University,Durham,NC 127 1.27% 355 0.81%<br />
Emory University,Atlanta,GA 121 1.21% 332 0.76%<br />
University of Pennsylvania,Philadelphia,PA 120 1.20% 331 0.75%<br />
New York University,New York,NY 116 1.16% 294 0.67%<br />
State University of New York at Stony Brook,Stony Brook,NY 113 1.13% 220 0.50%<br />
Wash<strong>in</strong>gton University <strong>in</strong> St. Louis,St. Louis,MO 107 1.07% 291 0.66%<br />
University of Southern California,Los Angeles,CA 106 1.06% 278 0.63%<br />
Harvard University,Cambridge,MA 100 1.00% 296 0.67%<br />
University of Maryland-College Park,College Park,MD 96 0.96% 276 0.63%<br />
Boston University,Boston,MA 93 0.93% 270 0.61%<br />
Brown University,Providence,RI 82 0.82% 252 0.57%<br />
University of North Carol<strong>in</strong>a at Chapel Hill,Chapel Hill,NC 79 0.79% 360 0.82%<br />
Massachusetts Institute of Technology,Cambridge,MA 78 0.78% 150 0.34%<br />
University of Houston,Houston,TX 78 0.78% 160 0.36%<br />
Rice University,Houston,TX 77 0.77% 174 0.40%<br />
University of Ill<strong>in</strong>ois at Chicago,Chicago,IL 76 0.76% 161 0.37%<br />
Ohio State University-Ma<strong>in</strong> Campus,Columbus,OH 75 0.75% 351 0.80%<br />
University of California-Riverside,Riverside,CA 75 0.75% 146 0.33%<br />
University of Georgia,Athens,GA 75 0.75% 404 0.92%<br />
The University of Texas at Dallas,Richardson,TX 69 0.69% 140 0.32%<br />
Virg<strong>in</strong>ia Commonwealth University,Richmond,VA 69 0.69% 129 0.29%<br />
Baylor University,Waco,TX 68 0.68% 292 0.66%<br />
Pennsylvania State University-Ma<strong>in</strong> Campus,University Park,PA 67 0.67% 271 0.62%<br />
Columbia University <strong>in</strong> the City of New York,New York,NY 60 0.60% 183 0.42%<br />
Michigan State University,East Lans<strong>in</strong>g,MI 58 0.58% 326 0.74%<br />
University of Arizona,Tucson,AZ 58 0.58% 301 0.69%<br />
University of Hawaii at Manoa,Honolulu,HI 58 0.58% 78 0.18%<br />
University of Wiscons<strong>in</strong>-Madison,Madison,WI 58 0.58% 455 1.04%<br />
Yale University,New Haven,CT 58 0.58% 206 0.47%<br />
University of South Florida,Tampa,FL 56 0.56% 229 0.52%<br />
Georgia Institute of Technology-Ma<strong>in</strong> Campus,Atlanta,GA 55 0.55% 144 0.33%<br />
State University of New York at B<strong>in</strong>ghamton,B<strong>in</strong>ghamton,NY 54 0.54% 183 0.42%<br />
Case Western Reserve University,Cleveland,OH 53 0.53% 164 0.37%<br />
Dartmouth College,Hanover,NH 53 0.53% 180 0.41%<br />
Loyola University Chicago,Chicago,IL 53 0.53% 173 0.39%<br />
Wayne State University,Detroit,MI 53 0.53% 186 0.42%<br />
University of Chicago,Chicago,IL 52 0.52% 170 0.39%<br />
University of Miami,Coral Gables,FL 50 0.50% 324 0.74%<br />
Note: Numbers of Asian are race alone and <strong>in</strong> comb<strong>in</strong>ation; total Asian applicants = 9,980; total national applicants = 43,919<br />
Source: <strong>AAMC</strong> Data Warehouse:Applicant Matriculant File, as of March 14, <strong>2012</strong>.<br />
Association of American <strong>Medical</strong> Colleges
<strong>Diversity</strong> <strong>in</strong> <strong>Medical</strong> <strong>Education</strong>: <strong>Facts</strong> & <strong>Figures</strong> <strong>2012</strong><br />
Table 13: Undergraduate Institutions Supply<strong>in</strong>g ≥ 20 Black or African American Applicants to<br />
U.S. <strong>Medical</strong> Schools, 2011<br />
Table 13: Undergraduate Institutions Supply<strong>in</strong>g >=20 Black or African American<br />
80<br />
Total<br />
Applicants<br />
from the<br />
School<br />
% of All<br />
National<br />
Applicants<br />
# of Black % of All Black<br />
Undergraduate Institutions<br />
Applicants Applicants<br />
Howard University,Wash<strong>in</strong>gton,DC 87 2.39% 101 0.23%<br />
Xavier University of Louisiana,New Orleans,LA 68 1.87% 76 0.17%<br />
University of Florida,Ga<strong>in</strong>esville,FL 64 1.76% 741 1.69%<br />
Spelman College,Atlanta,GA 57 1.57% 57 0.13%<br />
University of Miami,Coral Gables,FL 56 1.54% 324 0.74%<br />
University of Maryland-College Park,College Park,MD 48 1.32% 276 0.63%<br />
Hampton University,Hampton,VA 45 1.24% 47 0.11%<br />
University of South Florida,Tampa,FL 42 1.15% 229 0.52%<br />
Florida State University,Tallahassee,FL 41 1.13% 232 0.53%<br />
Cornell University,Ithaca,NY 40 1.10% 471 1.07%<br />
Emory University,Atlanta,GA 40 1.10% 332 0.76%<br />
Oakwood University,Huntsville,AL 40 1.10% 42 0.10%<br />
Rutgers University-New Brunswick,New Brunswick,NJ 40 1.10% 305 0.69%<br />
University of Texas at Aust<strong>in</strong>,Aust<strong>in</strong>,TX 40 1.10% 695 1.58%<br />
Duke University,Durham,NC 38 1.04% 355 0.81%<br />
University of Michigan-Ann Arbor,Ann Arbor,MI 38 1.04% 774 1.76%<br />
University of Georgia,Athens,GA 36 0.99% 404 0.92%<br />
Georgia State University,Atlanta,GA 32 0.88% 65 0.15%<br />
University of M<strong>in</strong>nesota-Tw<strong>in</strong> Cities,M<strong>in</strong>neapolis,MN 30 0.82% 292 0.66%<br />
University of North Carol<strong>in</strong>a at Chapel Hill,Chapel Hill,NC 30 0.82% 360 0.82%<br />
Stanford University,Stanford,CA 29 0.80% 312 0.71%<br />
University of Puerto Rico-Rio Piedras Campus,Rio Piedras,PR 29 0.80% 184 0.42%<br />
Yale University,New Haven,CT 29 0.80% 206 0.47%<br />
Baylor University,Waco,TX 28 0.77% 292 0.66%<br />
University of California-Berkeley,Berkeley,CA 27 0.74% 754 1.72%<br />
University of Houston,Houston,TX 27 0.74% 160 0.36%<br />
Johns Hopk<strong>in</strong>s University,Baltimore,MD 26 0.71% 358 0.82%<br />
University of Central Florida,Orlando,FL 26 0.71% 212 0.48%<br />
University of Pennsylvania,Philadelphia,PA 26 0.71% 331 0.75%<br />
Brown University,Providence,RI 25 0.69% 252 0.57%<br />
Morehouse College,Atlanta,GA 25 0.69% 25 0.06%<br />
University of Ill<strong>in</strong>ois at Urbana-Champaign,Champaign,IL 25 0.69% 448 1.02%<br />
Florida Agricultural and Mechanical University,Tallahassee,FL 22 0.60% 24 0.05%<br />
Florida Atlantic University-Boca Raton,Boca Raton,FL 22 0.60% 86 0.20%<br />
New York University,New York,NY 22 0.60% 294 0.67%<br />
Ohio State University-Ma<strong>in</strong> Campus,Columbus,OH 22 0.60% 351 0.80%<br />
Vanderbilt University,Nashville,TN 22 0.60% 246 0.56%<br />
City University of New York The City College,New York,NY 20 0.55% 39 0.09%<br />
Harvard University,Cambridge,MA 20 0.55% 296 0.67%<br />
Louisiana St University and Agricultural and Mechanical Col,Baton Rouge,LA 20 0.55% 265 0.60%<br />
North Carol<strong>in</strong>a State University,Raleigh,NC 20 0.55% 150 0.34%<br />
Pr<strong>in</strong>ceton University,Pr<strong>in</strong>ceton,NJ 20 0.55% 166 0.38%<br />
University of California-Los Angeles,Los Angeles,CA 20 0.55% 820 1.87%<br />
Note: Numbers of Black or African American are race alone and <strong>in</strong> comb<strong>in</strong>ation; total Black or African American applicants = 3,640,<br />
total national applicants = 43,919.<br />
Source:<strong>AAMC</strong> Data Warehouse:Applicant Matriculant File, as of March 14, <strong>2012</strong>.<br />
Association of American <strong>Medical</strong> Colleges<br />
+
Undergraduate Institutions<br />
<strong>Diversity</strong> <strong>in</strong> <strong>Medical</strong> <strong>Education</strong>: <strong>Facts</strong> & <strong>Figures</strong> <strong>2012</strong><br />
Table 14: Undergraduate Institutions Supply<strong>in</strong>g ≥15 Hispanic or Lat<strong>in</strong>o Applicants to U.S. <strong>Medical</strong><br />
Schools, 2011<br />
Table 14: Undergraduate Institutions Supply<strong>in</strong>g >=15 Hispanic or Lat<strong>in</strong>o Applicants<br />
to U.S. <strong>Medical</strong> Schools, 2011<br />
81<br />
# of Hispanic or<br />
Lat<strong>in</strong>o<br />
Applicants<br />
% of All<br />
Hispanic or<br />
Lat<strong>in</strong>o<br />
Applicants<br />
Total<br />
Applicants from<br />
the School<br />
% of All<br />
National<br />
Applicants<br />
University of Puerto Rico-Rio Piedras Campus,Rio Piedras,PR 179 5.09% 184 0.42%<br />
University of Florida,Ga<strong>in</strong>esville,FL 110 3.13% 741 1.69%<br />
University of Puerto Rico-Mayaguez,Mayaguez,PR 108 3.07% 109 0.25%<br />
University of Miami,Coral Gables,FL 104 2.96% 324 0.74%<br />
University of Texas at Aust<strong>in</strong>,Aust<strong>in</strong>,TX 78 2.22% 695 1.58%<br />
Florida International University,Miami,FL 74 2.10% 104 0.24%<br />
University of California-Los Angeles,Los Angeles,CA 62 1.76% 820 1.87%<br />
University of Central Florida,Orlando,FL 61 1.73% 212 0.48%<br />
University of Texas-Pan American,Ed<strong>in</strong>burg,TX 43 1.22% 58 0.13%<br />
University of California-Berkeley,Berkeley,CA 42 1.19% 754 1.72%<br />
University of California-San Diego,La Jolla,CA 40 1.14% 541 1.23%<br />
University of South Florida,Tampa,FL 40 1.14% 229 0.52%<br />
Baylor University,Waco,TX 38 1.08% 292 0.66%<br />
University of Arizona,Tucson,AZ 38 1.08% 301 0.69%<br />
University of Texas at El Paso,El Paso,TX 38 1.08% 45 0.10%<br />
University of Southern California,Los Angeles,CA 37 1.05% 278 0.63%<br />
Stanford University,Stanford,CA 36 1.02% 312 0.71%<br />
Arizona State University,Tempe,AZ 35 0.99% 201 0.46%<br />
University of Michigan-Ann Arbor,Ann Arbor,MI 35 0.99% 774 1.76%<br />
Florida State University,Tallahassee,FL 34 0.97% 232 0.53%<br />
University of California-Davis,Davis,CA 33 0.94% 410 0.93%<br />
Cornell University,Ithaca,NY 30 0.85% 471 1.07%<br />
University of Notre Dame,Notre Dame,IN 29 0.82% 309 0.70%<br />
Columbia University <strong>in</strong> the City of New York,New York,NY 28 0.80% 183 0.42%<br />
St. Mary's University,San Antonio,TX 28 0.80% 36 0.08%<br />
University of Puerto Rico-Cayey University College,Cayey,PR 28 0.80% 28 0.06%<br />
Brown University,Providence,RI 27 0.77% 252 0.57%<br />
Texas Tech University-Lubbock,Lubbock,TX 26 0.74% 139 0.32%<br />
New York University,New York,NY 24 0.68% 294 0.67%<br />
Harvard University,Cambridge,MA 23 0.65% 296 0.67%<br />
Rice University,Houston,TX 23 0.65% 174 0.40%<br />
Texas A & M University-Ma<strong>in</strong> Campus,College Station,TX 22 0.63% 173 0.39%<br />
University of California-Irv<strong>in</strong>e,Irv<strong>in</strong>e,CA 22 0.63% 361 0.82%<br />
University of Houston,Houston,TX 22 0.63% 160 0.36%<br />
University of Puerto Rico-Bayamon Tech Univ Col,Bayamon,PR 22 0.63% 23 0.05%<br />
University of Texas at San Antonio,San Antonio,TX 22 0.63% 67 0.15%<br />
Duke University,Durham,NC 21 0.60% 355 0.81%<br />
University of California-Riverside,Riverside,CA 21 0.60% 146 0.33%<br />
University of Pennsylvania,Philadelphia,PA 21 0.60% 331 0.75%<br />
University of Maryland-College Park,College Park,MD 20 0.57% 276 0.63%<br />
Florida Atlantic University-Boca Raton,Boca Raton,FL 19 0.54% 86 0.20%<br />
Yale University,New Haven,CT 19 0.54% 206 0.47%<br />
University of Ill<strong>in</strong>ois at Urbana-Champaign,Champaign,IL 18 0.51% 448 1.02%<br />
Johns Hopk<strong>in</strong>s University,Baltimore,MD 17 0.48% 358 0.82%<br />
Rutgers University-New Brunswick,New Brunswick,NJ 17 0.48% 305 0.69%<br />
University of California-Santa Barbara,Santa Barbara,CA 17 0.48% 138 0.31%<br />
University of Wash<strong>in</strong>gton,Seattle,WA 17 0.48% 362 0.82%<br />
Northwestern University-Evanston,Evanston,IL 16 0.45% 302 0.69%<br />
University of Puerto Rico-Humacao University Col,Humacao,PR 15 0.43% 15 0.03%<br />
Note: Numbers of Hispanic or Lat<strong>in</strong>o are race alone and <strong>in</strong> comb<strong>in</strong>ation; total Hispanic or Lat<strong>in</strong>o applicants = 3,518;<br />
total national applicants = 43,919<br />
Source: <strong>AAMC</strong> Data Warehouse: Applicant Matriculant File, as of March 14, <strong>2012</strong>.<br />
Association of American <strong>Medical</strong> Colleges
<strong>Diversity</strong> <strong>in</strong> <strong>Medical</strong> <strong>Education</strong>: <strong>Facts</strong> & <strong>Figures</strong> <strong>2012</strong><br />
Table 15: Undergraduate Institutions Supply<strong>in</strong>g ≥ 5 Mexican American Applicants to U.S. <strong>Medical</strong><br />
Schools, 2011<br />
Table 15: Undergraduate Institutions Supply<strong>in</strong>g >=5 Mexican-American Applicants<br />
to U.S. <strong>Medical</strong> Schools, 2011<br />
Undergraduate Institutions<br />
82<br />
# of Mexican-<br />
American<br />
Applicants<br />
% of All<br />
Mexican-<br />
American<br />
Applicants<br />
Total<br />
Applicants from<br />
the School<br />
% of All<br />
National<br />
Applicants<br />
University of California-Los Angeles,Los Angeles,CA 35 3.94% 820 1.87%<br />
University of Arizona,Tucson,AZ 30 3.38% 301 0.69%<br />
Stanford University,Stanford,CA 28 3.15% 312 0.71%<br />
University of California-Berkeley,Berkeley,CA 24 2.70% 754 1.72%<br />
University of California-San Diego,La Jolla,CA 24 2.70% 541 1.23%<br />
University of Texas at Aust<strong>in</strong>,Aust<strong>in</strong>,TX 23 2.59% 695 1.58%<br />
Arizona State University,Tempe,AZ 22 2.48% 201 0.46%<br />
University of Southern California,Los Angeles,CA 17 1.91% 278 0.63%<br />
Baylor University,Waco,TX 16 1.80% 292 0.66%<br />
University of California-Irv<strong>in</strong>e,Irv<strong>in</strong>e,CA 13 1.46% 361 0.82%<br />
University of California-Riverside,Riverside,CA 13 1.46% 146 0.33%<br />
University of Michigan-Ann Arbor,Ann Arbor,MI 13 1.46% 774 1.76%<br />
University of California-Davis,Davis,CA 12 1.35% 410 0.93%<br />
University of Texas at El Paso,El Paso,TX 11 1.24% 45 0.10%<br />
Brown University,Providence,RI 10 1.13% 252 0.57%<br />
California State University-Long Beach,Long Beach,CA 9 1.01% 40 0.09%<br />
Harvard University,Cambridge,MA 9 1.01% 296 0.67%<br />
St. Mary's University,San Antonio,TX 9 1.01% 36 0.08%<br />
University of California-Santa Cruz,Santa Cruz,CA 9 1.01% 85 0.19%<br />
University of Notre Dame,Notre Dame,IN 9 1.01% 309 0.70%<br />
University of Texas-Pan American,Ed<strong>in</strong>burg,TX 9 1.01% 58 0.13%<br />
University of Ill<strong>in</strong>ois at Chicago,Chicago,IL 8 0.90% 161 0.37%<br />
University of Wash<strong>in</strong>gton,Seattle,WA 8 0.90% 362 0.82%<br />
Yale University,New Haven,CT 8 0.90% 206 0.47%<br />
Colorado State University,Fort Coll<strong>in</strong>s,CO 7 0.79% 102 0.23%<br />
Northwestern University-Evanston,Evanston,IL 7 0.79% 302 0.69%<br />
Rice University,Houston,TX 7 0.79% 174 0.40%<br />
University of Houston,Houston,TX 7 0.79% 160 0.36%<br />
Brigham Young University,Provo,UT 6 0.68% 356 0.81%<br />
Loyola Marymount University,Los Angeles,CA 6 0.68% 42 0.10%<br />
Loyola University Chicago,Chicago,IL 6 0.68% 173 0.39%<br />
University of California-Santa Barbara,Santa Barbara,CA 6 0.68% 138 0.31%<br />
University of Chicago,Chicago,IL 6 0.68% 170 0.39%<br />
University of Ill<strong>in</strong>ois at Urbana-Champaign,Champaign,IL 6 0.68% 448 1.02%<br />
University of Kansas Ma<strong>in</strong> Campus,Lawrence,KS 6 0.68% 173 0.39%<br />
University of Nevada-Reno,Reno,NV 6 0.68% 99 0.23%<br />
California State University-Fullerton,Fullerton,CA 5 0.56% 19 0.04%<br />
California State University-San Bernard<strong>in</strong>o,San Bernard<strong>in</strong>o,CA 5 0.56% 15 0.03%<br />
New Mexico State University-Ma<strong>in</strong> Campus,Las Cruces,NM 5 0.56% 24 0.05%<br />
Northern Arizona University,Flagstaff,AZ 5 0.56% 39 0.09%<br />
Wash<strong>in</strong>gton University <strong>in</strong> St. Louis,St. Louis,MO 5 0.56% 291 0.66%<br />
Note: Numbers of Mexican American are race alone and <strong>in</strong> comb<strong>in</strong>ation; total Mexican American applicants = 888;<br />
total national applicants = 43,919<br />
Source: <strong>AAMC</strong> Data Warehouse: Applicant Matriculant File, as of March 14, <strong>2012</strong>.<br />
Association of American <strong>Medical</strong> Colleges
<strong>Diversity</strong> <strong>in</strong> <strong>Medical</strong> <strong>Education</strong>: <strong>Facts</strong> & <strong>Figures</strong> <strong>2012</strong><br />
Table 16: Undergraduate Institutions Supply<strong>in</strong>g ≥3 American Indian and Alaska Native Applicants to<br />
U.S. <strong>Medical</strong> Schools, 2011<br />
Table 16: Undergraduate Institutions Supply<strong>in</strong>g >=3 American Indian<br />
and Alaska Native Applicants to U.S. <strong>Medical</strong> Schools, 2011<br />
83<br />
# of American-<br />
Indian & Alaska<br />
Native<br />
Applicants<br />
% of All<br />
American Indian<br />
& Alaska Native<br />
Applicants<br />
Undergraduate Institutions<br />
Total Applicants<br />
from the School<br />
University of Oklahoma Norman Campus,Norman,OK 19 5.01% 202 0.46%<br />
University of Arizona,Tucson,AZ 6 1.58% 301 0.69%<br />
University of Michigan-Ann Arbor,Ann Arbor,MI 6 1.58% 774 1.76%<br />
University of Southern California,Los Angeles,CA 6 1.58% 278 0.63%<br />
Harvard University,Cambridge,MA 5 1.32% 296 0.67%<br />
Texas Tech University-Lubbock,Lubbock,TX 5 1.32% 139 0.32%<br />
The University of Utah,Salt Lake City,UT 5 1.32% 173 0.39%<br />
Baylor University,Waco,TX 4 1.06% 292 0.66%<br />
Dartmouth College,Hanover,NH 4 1.06% 180 0.41%<br />
Massachusetts Institute of Technology,Cambridge,MA 4 1.06% 150 0.34%<br />
Oklahoma State University-Ma<strong>in</strong> Campus,Stillwater,OK 4 1.06% 47 0.11%<br />
University of California-Berkeley,Berkeley,CA 4 1.06% 754 1.72%<br />
University of California-San Diego,La Jolla,CA 4 1.06% 541 1.23%<br />
University of Miami,Coral Gables,FL 4 1.06% 324 0.74%<br />
University of North Carol<strong>in</strong>a-Pembroke,Pembroke,NC 4 1.06% 13 0.03%<br />
University of Notre Dame,Notre Dame,IN 4 1.06% 309 0.70%<br />
University of Texas at Aust<strong>in</strong>,Aust<strong>in</strong>,TX 4 1.06% 695 1.58%<br />
University of Tulsa,Tulsa,OK 4 1.06% 32 0.07%<br />
University of Wash<strong>in</strong>gton,Seattle,WA 4 1.06% 362 0.82%<br />
Wash<strong>in</strong>gton University <strong>in</strong> St. Louis,St. Louis,MO 4 1.06% 291 0.66%<br />
Brigham Young University,Provo,UT 3 0.79% 356 0.81%<br />
Ohio State University-Ma<strong>in</strong> Campus,Columbus,OH 3 0.79% 351 0.80%<br />
Stanford University,Stanford,CA 3 0.79% 312 0.71%<br />
University of California-Davis,Davis,CA 3 0.79% 410 0.93%<br />
University of Central Florida,Orlando,FL 3 0.79% 212 0.48%<br />
University of Florida,Ga<strong>in</strong>esville,FL 3 0.79% 741 1.69%<br />
University of Ill<strong>in</strong>ois at Urbana-Champaign,Champaign,IL 3 0.79% 448 1.02%<br />
University of Pennsylvania,Philadelphia,PA 3 0.79% 331 0.75%<br />
University of San Francisco,San Francisco,CA 3 0.79% 34 0.08%<br />
University of South Florida,Tampa,FL 3 0.79% 229 0.52%<br />
Yale University,New Haven,CT 3 0.79% 206 0.47%<br />
Note: Numbers of American Indian or Alaska Native are race alone and <strong>in</strong> comb<strong>in</strong>ation; total American Indian<br />
or Alaska Native applicants = 379; total national applicants = 43,919<br />
Source: <strong>AAMC</strong> Data Warehouse: Applicant Matriculant File, as of March 14, <strong>2012</strong>.<br />
% of All National<br />
Applicants<br />
Association of American <strong>Medical</strong> Colleges
<strong>Diversity</strong> <strong>in</strong> <strong>Medical</strong> <strong>Education</strong>: <strong>Facts</strong> & <strong>Figures</strong> <strong>2012</strong><br />
Table 17: Undergraduate Institutions Supply<strong>in</strong>g ≥3 Puerto Rican Applicants to U.S. <strong>Medical</strong> Schools, 2011<br />
Table 17: Undergraduate Institutions Supply<strong>in</strong>g >=3 Puerto Rican Applicants<br />
to U.S. <strong>Medical</strong> Schools, 2011<br />
Undergraduate Institutions<br />
84<br />
# of Puerto<br />
Rican<br />
Applicants<br />
% of All<br />
Puerto Rican<br />
Applicants<br />
Total<br />
Applicants<br />
from the<br />
School<br />
% of All<br />
National<br />
Applicants<br />
University of Puerto Rico-Rio Piedras Campus,Rio Piedras,PR 178 23.39% 184 0.42%<br />
University of Puerto Rico-Mayaguez,Mayaguez,PR 107 14.06% 109 0.25%<br />
University of Puerto Rico-Cayey University College,Cayey,PR 27 3.55% 28 0.06%<br />
University of Puerto Rico-Bayamon Tech Univ Col,Bayamon,PR 21 2.76% 23 0.05%<br />
University of Central Florida,Orlando,FL 15 1.97% 212 0.48%<br />
University of Puerto Rico-Humacao University Col,Humacao,PR 15 1.97% 15 0.03%<br />
Univ of Puerto Rico-Ponce,Ponce,PR 13 1.71% 13 0.03%<br />
Cornell University,Ithaca,NY 11 1.45% 471 1.07%<br />
University of Florida,Ga<strong>in</strong>esville,FL 11 1.45% 741 1.69%<br />
Florida State University,Tallahassee,FL 9 1.18% 232 0.53%<br />
Columbia University <strong>in</strong> the City of New York,New York,NY 8 1.05% 183 0.42%<br />
Pontifical Catholic University of Puerto Rico-Ponce,Ponce,PR 8 1.05% 8 0.02%<br />
University of Miami,Coral Gables,FL 8 1.05% 324 0.74%<br />
Inter American Univ of Puerto Rico-San German,San German,PR 7 0.92% 7 0.02%<br />
University of Notre Dame,Notre Dame,IN 7 0.92% 309 0.70%<br />
Yale University,New Haven,CT 6 0.79% 206 0.47%<br />
Boston College,Chestnut Hill,MA 5 0.66% 145 0.33%<br />
Florida International University,Miami,FL 5 0.66% 104 0.24%<br />
New York University,New York,NY 5 0.66% 294 0.67%<br />
Rutgers University-New Brunswick,New Brunswick,NJ 5 0.66% 305 0.69%<br />
University of Puerto Rico-Aguadilla,Aguadilla,PR 5 0.66% 5 0.01%<br />
University of Texas at Aust<strong>in</strong>,Aust<strong>in</strong>,TX 5 0.66% 695 1.58%<br />
Brown University,Providence,RI 4 0.53% 252 0.57%<br />
Duke University,Durham,NC 4 0.53% 355 0.81%<br />
Harvard University,Cambridge,MA 4 0.53% 296 0.67%<br />
Inter American Univ of Puerto Rico-Bayamon,Bayamon,PR 4 0.53% 4 0.01%<br />
State University of New York at Stony Brook,Stony Brook,NY 4 0.53% 220 0.50%<br />
University of Maryland-College Park,College Park,MD 4 0.53% 276 0.63%<br />
University of Massachusetts-Amherst,Amherst,MA 4 0.53% 118 0.27%<br />
University of Michigan-Ann Arbor,Ann Arbor,MI 4 0.53% 774 1.76%<br />
University of South Florida,Tampa,FL 4 0.53% 229 0.52%<br />
Emory University,Atlanta,GA 3 0.39% 332 0.76%<br />
Inter American Univ of Puerto Rico-Arecibo,Arecibo,PR 3 0.39% 3 0.01%<br />
State University of New York at B<strong>in</strong>ghamton,B<strong>in</strong>ghamton,NY 3 0.39% 183 0.42%<br />
University of Iowa,Iowa City,IA 3 0.39% 176 0.40%<br />
University of Puerto Rico-<strong>Medical</strong> Sciences Campus,San Juan,PR 3 0.39% 4 0.01%<br />
Note: Numbers of Puerto Rican are race alone and <strong>in</strong> comb<strong>in</strong>ation; total Puerto Rican applicants = 761,<br />
total national applicants = 43,919.<br />
Source: <strong>AAMC</strong> Data Warehouse: Applicant Matriculant File, as of March 14, <strong>2012</strong>.<br />
Association of American <strong>Medical</strong> Colleges
<strong>Diversity</strong> <strong>in</strong> <strong>Medical</strong> <strong>Education</strong>: <strong>Facts</strong> & <strong>Figures</strong> <strong>2012</strong><br />
Table 18: Undergraduate Institutions Supply<strong>in</strong>g ≥140 White Applicants to U.S. <strong>Medical</strong> Schools, 2011<br />
Table 18: Undergraduate Institutions Supply<strong>in</strong>g >=140 White Applicants<br />
to U.S. <strong>Medical</strong> Schools, 2011<br />
85<br />
% of All<br />
White<br />
Applicants<br />
Total<br />
Applicants<br />
from the<br />
School<br />
% of All<br />
National<br />
Applicants<br />
Undergraduate Institutions<br />
# of White<br />
Applicants<br />
University of Florida,Ga<strong>in</strong>esville,FL 517 1.89% 741 1.69%<br />
University of Michigan-Ann Arbor,Ann Arbor,MI 509 1.86% 774 1.76%<br />
University of Wiscons<strong>in</strong>-Madison,Madison,WI 373 1.36% 455 1.04%<br />
University of Texas at Aust<strong>in</strong>,Aust<strong>in</strong>,TX 357 1.30% 695 1.58%<br />
Brigham Young University,Provo,UT 340 1.24% 356 0.81%<br />
University of California-Los Angeles,Los Angeles,CA 314 1.15% 820 1.87%<br />
University of Georgia,Athens,GA 296 1.08% 404 0.92%<br />
University of Ill<strong>in</strong>ois at Urbana-Champaign,Champaign,IL 254 0.93% 448 1.02%<br />
University of Notre Dame,Notre Dame,IN 252 0.92% 309 0.70%<br />
Michigan State University,East Lans<strong>in</strong>g,MI 241 0.88% 326 0.74%<br />
Ohio State University-Ma<strong>in</strong> Campus,Columbus,OH 237 0.87% 351 0.80%<br />
University of California-Berkeley,Berkeley,CA 233 0.85% 754 1.72%<br />
University of North Carol<strong>in</strong>a at Chapel Hill,Chapel Hill,NC 233 0.85% 360 0.82%<br />
Louisiana St University and Agricultural and Mechanical Col,Baton Rouge,LA 225 0.82% 265 0.60%<br />
Cornell University,Ithaca,NY 219 0.80% 471 1.07%<br />
University of California-San Diego,La Jolla,CA 212 0.77% 541 1.23%<br />
University of M<strong>in</strong>nesota-Tw<strong>in</strong> Cities,M<strong>in</strong>neapolis,MN 210 0.77% 292 0.66%<br />
University of Arizona,Tucson,AZ 209 0.76% 301 0.69%<br />
University of Wash<strong>in</strong>gton,Seattle,WA 202 0.74% 362 0.82%<br />
University of Miami,Coral Gables,FL 200 0.73% 324 0.74%<br />
University of California-Davis,Davis,CA 191 0.70% 410 0.93%<br />
Pennsylvania State University-Ma<strong>in</strong> Campus,University Park,PA 183 0.67% 271 0.62%<br />
University of Pennsylvania,Philadelphia,PA 182 0.66% 331 0.75%<br />
Duke University,Durham,NC 178 0.65% 355 0.81%<br />
Baylor University,Waco,TX 177 0.65% 292 0.66%<br />
Vanderbilt University,Nashville,TN 170 0.62% 246 0.56%<br />
Indiana University-Bloom<strong>in</strong>gton,Bloom<strong>in</strong>gton,IN 169 0.62% 224 0.51%<br />
Florida State University,Tallahassee,FL 163 0.60% 232 0.53%<br />
University of Colorado at Boulder,Boulder,CO 160 0.58% 189 0.43%<br />
Emory University,Atlanta,GA 158 0.58% 332 0.76%<br />
Harvard University,Cambridge,MA 158 0.58% 296 0.67%<br />
Clemson University,Clemson,SC 155 0.57% 174 0.40%<br />
Wash<strong>in</strong>gton University <strong>in</strong> St. Louis,St. Louis,MO 155 0.57% 291 0.66%<br />
Stanford University,Stanford,CA 152 0.56% 312 0.71%<br />
Arizona State University,Tempe,AZ 151 0.55% 201 0.46%<br />
The University of Utah,Salt Lake City,UT 151 0.55% 173 0.39%<br />
Boston University,Boston,MA 150 0.55% 270 0.61%<br />
Texas A & M University-Ma<strong>in</strong> Campus,College Station,TX 148 0.54% 173 0.39%<br />
New York University,New York,NY 147 0.54% 294 0.67%<br />
Northwestern University-Evanston,Evanston,IL 141 0.52% 302 0.69%<br />
University of Central Florida,Orlando,FL 141 0.52% 212 0.48%<br />
University of Southern California,Los Angeles,CA 141 0.52% 278 0.63%<br />
University of Kansas Ma<strong>in</strong> Campus,Lawrence,KS 140 0.51% 173 0.39%<br />
Note: Numbers of White are race alone and <strong>in</strong> comb<strong>in</strong>ation; total White applicants = 27,373;<br />
total national applicants = 43,919<br />
Source: <strong>AAMC</strong> Data Warehouse:Applicant Matriculant File, as of March 14, <strong>2012</strong>.<br />
Association of American <strong>Medical</strong> Colleges
<strong>Diversity</strong> <strong>in</strong> <strong>Medical</strong> <strong>Education</strong>: <strong>Facts</strong> & <strong>Figures</strong> <strong>2012</strong><br />
Table 19: Undergraduate Institutions Produc<strong>in</strong>g ≥8 Black or African American <strong>Medical</strong> School<br />
Graduates, 2011<br />
Table 19: Undergraduate Institutions Produc<strong>in</strong>g >=8 Black or African America<br />
<strong>Medical</strong> School Graduates, 2011<br />
Undergraduate Institutions Total<br />
Xavier University of Louisiana,New Orleans,LA 60<br />
Howard University,Wash<strong>in</strong>gton,DC 32<br />
University of Florida,Ga<strong>in</strong>esville,FL 26<br />
Harvard University,Cambridge,MA 22<br />
Duke University,Durham,NC 20<br />
Stanford University,Stanford,CA 20<br />
Spelman College,Atlanta,GA 18<br />
University of Michigan-Ann Arbor,Ann Arbor,MI 18<br />
University of North Carol<strong>in</strong>a at Chapel Hill,Chapel Hill,NC 18<br />
Yale University,New Haven,CT 18<br />
Morehouse College,Atlanta,GA 15<br />
Emory University,Atlanta,GA 14<br />
Hampton University,Hampton,VA 14<br />
Rutgers University New Brunswick Campus,New Brunswick,NJ 14<br />
University of Georgia,Athens,GA 14<br />
Cornell University,Ithaca,NY 13<br />
Johns Hopk<strong>in</strong>s University,Baltimore,MD 13<br />
University of California-Berkeley,Berkeley,CA 13<br />
University of California-Los Angeles,Los Angeles,CA 13<br />
University of Maryland-College Park,College Park,MD 13<br />
Wash<strong>in</strong>gton University <strong>in</strong> St. Louis,St. Louis,MO 13<br />
New York University,New York,NY 11<br />
Oakwood University,Huntsville,AL 11<br />
Florida State University,Tallahassee,FL 10<br />
University of California-Davis,Davis,CA 10<br />
University of Miami,Coral Gables,FL 10<br />
University of Texas at Aust<strong>in</strong>,Aust<strong>in</strong>,TX 10<br />
Pr<strong>in</strong>ceton University,Pr<strong>in</strong>ceton,NJ 9<br />
State University of New York at Stony Brook,Stony Brook,NY 9<br />
Baylor University,Waco,TX 8<br />
Indiana University-Bloom<strong>in</strong>gton,Bloom<strong>in</strong>gton,IN 8<br />
Black or African American <strong>in</strong> this table were Non-Hispanic or Lat<strong>in</strong>o race alone and <strong>in</strong> comb<strong>in</strong>ation.<br />
Graduates refer to those who graduated <strong>in</strong> 2011.<br />
Source: <strong>AAMC</strong> Data Warehouse: Student data, Applicant and Matriculant File, as of 6/8/<strong>2012</strong>.<br />
86<br />
Association of American <strong>Medical</strong> Colleges
<strong>Diversity</strong> <strong>in</strong> <strong>Medical</strong> <strong>Education</strong>: <strong>Facts</strong> & <strong>Figures</strong> <strong>2012</strong><br />
Table 20: Undergraduate Institutions Produc<strong>in</strong>g ≥2 American Indian or Alaska Native <strong>Medical</strong> School<br />
Graduates, 2011<br />
Table 20: Undergraduate Institutions Produc<strong>in</strong>g >=2 American Indian or<br />
Alaska Native <strong>Medical</strong> School Graduates, 2011<br />
Undergraduate Institutions Total<br />
University of Oklahoma Norman Campus,Norman,OK 8<br />
Oklahoma State University-Ma<strong>in</strong> Campus,Stillwater,OK 6<br />
Stanford University,Stanford,CA 4<br />
University of Michigan-Ann Arbor,Ann Arbor,MI 4<br />
University of Nevada-Las Vegas,Las Vegas,NV 3<br />
Clemson University,Clemson,SC 2<br />
Northeastern University,Boston,MA 2<br />
University of Arizona,Tucson,AZ 2<br />
University of California-Berkeley,Berkeley,CA 2<br />
University of California-Davis,Davis,CA 2<br />
University of California-Los Angeles,Los Angeles,CA 2<br />
University of Central Oklahoma,Edmond,OK 2<br />
University of Notre Dame,Notre Dame,IN 2<br />
University of Texas at Aust<strong>in</strong>,Aust<strong>in</strong>,TX 2<br />
University of Wash<strong>in</strong>gton,Seattle,WA 2<br />
University of Wiscons<strong>in</strong>-Madison,Madison,WI 2<br />
Western State College,Gunnison,CO 2<br />
Wofford College,Spartanburg,SC 2<br />
Yale University,New Haven,CT 2<br />
American Indian or Alaska Native <strong>in</strong> this table were Non-Hispanic or Lat<strong>in</strong>o race alone and <strong>in</strong> comb<strong>in</strong>ation.<br />
Graduates refer to those who graduated <strong>in</strong> 2011.<br />
Source: <strong>AAMC</strong> Data Warehouse: Student data, Applicant and Matriculant File, as of 6/8/<strong>2012</strong>.<br />
87<br />
Association of American <strong>Medical</strong> Colleges
<strong>Diversity</strong> <strong>in</strong> <strong>Medical</strong> <strong>Education</strong>: <strong>Facts</strong> & <strong>Figures</strong> <strong>2012</strong><br />
Table 21: Undergraduate<br />
Table 21: Undergraduate<br />
Institutions Produc<strong>in</strong>g<br />
Institutions<br />
≥8 Hispanic<br />
Produc<strong>in</strong>g<br />
or Lat<strong>in</strong>o<br />
>=8<br />
<strong>Medical</strong><br />
Hispanic<br />
School<br />
or<br />
Graduates,<br />
Lat<strong>in</strong>o<br />
2011<br />
<strong>Medical</strong> School Graduates, 2011<br />
Undergraduate Institutions Total<br />
University of Puerto Rico-Rio Piedras Campus,Rio Piedras,PR 103<br />
University of Puerto Rico-Mayaguez,Mayaguez,PR 40<br />
University of Miami,Coral Gables,FL 36<br />
University of California-Los Angeles,Los Angeles,CA 28<br />
University of Florida,Ga<strong>in</strong>esville,FL 27<br />
University of Texas at Aust<strong>in</strong>,Aust<strong>in</strong>,TX 26<br />
Stanford University,Stanford,CA 22<br />
Harvard University,Cambridge,MA 20<br />
University of Texas-Pan American,Ed<strong>in</strong>burg,TX 18<br />
Rice University,Houston,TX 16<br />
Wash<strong>in</strong>gton University <strong>in</strong> St. Louis,St. Louis,MO 16<br />
Brown University,Providence,RI 15<br />
Cornell University,Ithaca,NY 15<br />
Texas A & M University-Ma<strong>in</strong> Campus,College Station,TX 15<br />
University of California-Berkeley,Berkeley,CA 15<br />
Johns Hopk<strong>in</strong>s University,Baltimore,MD 14<br />
University of Arizona,Tucson,AZ 14<br />
University of California-San Diego,La Jolla,CA 14<br />
University of Michigan-Ann Arbor,Ann Arbor,MI 14<br />
University of California-Davis,Davis,CA 13<br />
University of Texas at El Paso,El Paso,TX 13<br />
Florida International University,Miami,FL 12<br />
Texas Tech University-Lubbock,Lubbock,TX 12<br />
University of Notre Dame,Notre Dame,IN 12<br />
Columbia University <strong>in</strong> the City of New York,New York,NY 11<br />
New York University,New York,NY 11<br />
University of California-Irv<strong>in</strong>e,Irv<strong>in</strong>e,CA 11<br />
University of California-Riverside,Riverside,CA 11<br />
Baylor University,Waco,TX 10<br />
Emory University,Atlanta,GA 10<br />
Yale University,New Haven,CT 10<br />
Florida State University,Tallahassee,FL 9<br />
Rutgers University New Brunswick Campus,New Brunswick,NJ 9<br />
University of Pennsylvania,Philadelphia,PA 9<br />
University of South Florida,Tampa,FL 9<br />
University of Southern California,Los Angeles,CA 9<br />
University of Texas at San Antonio,San Antonio,TX 9<br />
Boston College,Chestnut Hill,MA 8<br />
Duke University,Durham,NC 8<br />
Northwestern University-Evanston,Evanston,IL 8<br />
University of Ill<strong>in</strong>ois at Chicago,Chicago,IL 8<br />
Hispanic or Lat<strong>in</strong>o <strong>in</strong> this table were U.S. permanent residents. They <strong>in</strong>clude Mexican Americans, Puerto Ricans,<br />
Cubans, Other Hispanic or Lat<strong>in</strong>os, and Multiple Hispanic or Lat<strong>in</strong>os.<br />
Graduates refer to those who graduated <strong>in</strong> 2011.<br />
Source: <strong>AAMC</strong> Data Warehouse: Student data, Applicant and Matriculant File, as of 6/8/<strong>2012</strong>.<br />
88<br />
Association of American <strong>Medical</strong> Colleges
<strong>Diversity</strong> <strong>in</strong> <strong>Medical</strong> <strong>Education</strong>: <strong>Facts</strong> & <strong>Figures</strong> <strong>2012</strong><br />
Table 22: Undergraduate Institutions Produc<strong>in</strong>g ≥20 Asian <strong>Medical</strong> School Graduates, 2011<br />
Table 22: Undergraduate Institutions Produc<strong>in</strong>g >=20 Asian<br />
<strong>Medical</strong> School Graduates, 2011<br />
Undergraduate Institutions Total<br />
University of California-Berkeley,Berkeley,CA 200<br />
University of California-Los Angeles,Los Angeles,CA 146<br />
University of Texas at Aust<strong>in</strong>,Aust<strong>in</strong>,TX 124<br />
Northwestern University-Evanston,Evanston,IL 101<br />
Johns Hopk<strong>in</strong>s University,Baltimore,MD 95<br />
Stanford University,Stanford,CA 92<br />
University of Michigan-Ann Arbor,Ann Arbor,MI 84<br />
Cornell University,Ithaca,NY 82<br />
Harvard University,Cambridge,MA 76<br />
University of California-San Diego,La Jolla,CA 76<br />
University of Pennsylvania,Philadelphia,PA 74<br />
Duke University,Durham,NC 66<br />
New York University,New York,NY 66<br />
Massachusetts Institute of Technology,Cambridge,MA 59<br />
University of Ill<strong>in</strong>ois at Urbana-Champaign,Champaign,IL 54<br />
University of California-Irv<strong>in</strong>e,Irv<strong>in</strong>e,CA 52<br />
Rice University,Houston,TX 49<br />
Columbia University <strong>in</strong> the City of New York,New York,NY 47<br />
University of Ill<strong>in</strong>ois at Chicago,Chicago,IL 47<br />
Wash<strong>in</strong>gton University <strong>in</strong> St. Louis,St. Louis,MO 46<br />
University of Maryland-College Park,College Park,MD 43<br />
Brown University,Providence,RI 42<br />
Emory University,Atlanta,GA 42<br />
University of California-Davis,Davis,CA 41<br />
Yale University,New Haven,CT 41<br />
Boston University,Boston,MA 40<br />
Case Western Reserve University,Cleveland,OH 39<br />
University of Florida,Ga<strong>in</strong>esville,FL 39<br />
University of Southern California,Los Angeles,CA 39<br />
University of Wash<strong>in</strong>gton,Seattle,WA 37<br />
Rutgers University New Brunswick Campus,New Brunswick,NJ 36<br />
University of Chicago,Chicago,IL 34<br />
Pennsylvania State University-Ma<strong>in</strong> Campus,University Park,PA 32<br />
University of Miami,Coral Gables,FL 29<br />
Vanderbilt University,Nashville,TN 29<br />
George Wash<strong>in</strong>gton University,Wash<strong>in</strong>gton,DC 26<br />
Dartmouth College,Hanover,NH 24<br />
Pr<strong>in</strong>ceton University,Pr<strong>in</strong>ceton,NJ 24<br />
Tufts University,Medford,MA 24<br />
University of North Carol<strong>in</strong>a at Chapel Hill,Chapel Hill,NC 23<br />
University of Georgia,Athens,GA 21<br />
Drexel University,Philadelphia,PA 20<br />
University of Arizona,Tucson,AZ 20<br />
University of Wiscons<strong>in</strong>-Madison,Madison,WI 20<br />
Asian <strong>in</strong> this table were Non-Hispanic or Lat<strong>in</strong>o race alone and <strong>in</strong> comb<strong>in</strong>ation.<br />
Graduates refer to those who graduated <strong>in</strong> 2011.<br />
Source: <strong>AAMC</strong> Data Warehouse: Student data, Applicant and Matriculant File, as of 6/8/<strong>2012</strong>.<br />
89<br />
Association of American <strong>Medical</strong> Colleges
<strong>Diversity</strong> <strong>in</strong> <strong>Medical</strong> <strong>Education</strong>: <strong>Facts</strong> & <strong>Figures</strong> <strong>2012</strong><br />
Table 23: Undergraduate Institutions Produc<strong>in</strong>g ≥65 White <strong>Medical</strong> School Graduates, 2011<br />
Table 23: Undergraduate Institutions Produc<strong>in</strong>g >=65 White<br />
<strong>Medical</strong> School Graduates, 2011<br />
Undergraduate Institutions Total<br />
University of Michigan-Ann Arbor,Ann Arbor,MI 196<br />
University of Wiscons<strong>in</strong>-Madison,Madison,WI 175<br />
University of Notre Dame,Notre Dame,IN 156<br />
Brigham Young University,Provo,UT 145<br />
Cornell University,Ithaca,NY 145<br />
University of Texas at Aust<strong>in</strong>,Aust<strong>in</strong>,TX 135<br />
Duke University,Durham,NC 128<br />
Louisiana St University and Agricultural and Mechanical Col,Baton Rouge,LA 126<br />
University of Georgia,Athens,GA 126<br />
University of California-Los Angeles,Los Angeles,CA 123<br />
University of Florida,Ga<strong>in</strong>esville,FL 123<br />
Harvard University,Cambridge,MA 121<br />
University of Pennsylvania,Philadelphia,PA 117<br />
Brown University,Providence,RI 115<br />
University of Ill<strong>in</strong>ois at Urbana-Champaign,Champaign,IL 111<br />
University of North Carol<strong>in</strong>a at Chapel Hill,Chapel Hill,NC 111<br />
Yale University,New Haven,CT 103<br />
University of California-Berkeley,Berkeley,CA 99<br />
Northwestern University-Evanston,Evanston,IL 93<br />
Wash<strong>in</strong>gton University <strong>in</strong> St. Louis,St. Louis,MO 89<br />
Vanderbilt University,Nashville,TN 88<br />
Emory University,Atlanta,GA 85<br />
University of California-San Diego,La Jolla,CA 80<br />
Indiana University-Bloom<strong>in</strong>gton,Bloom<strong>in</strong>gton,IN 78<br />
Georgetown University,Wash<strong>in</strong>gton,DC 76<br />
Michigan State University,East Lans<strong>in</strong>g,MI 76<br />
Pennsylvania State University-Ma<strong>in</strong> Campus,University Park,PA 75<br />
Stanford University,Stanford,CA 75<br />
Columbia University <strong>in</strong> the City of New York,New York,NY 73<br />
Pr<strong>in</strong>ceton University,Pr<strong>in</strong>ceton,NJ 71<br />
University of Colorado at Boulder,Boulder,CO 71<br />
University of Maryland-College Park,College Park,MD 71<br />
Johns Hopk<strong>in</strong>s University,Baltimore,MD 69<br />
Boston College,Chestnut Hill,MA 68<br />
Dartmouth College,Hanover,NH 68<br />
University of Oklahoma Norman Campus,Norman,OK 68<br />
University of Arizona,Tucson,AZ 67<br />
University of M<strong>in</strong>nesota-Tw<strong>in</strong> Cities,M<strong>in</strong>neapolis,MN 67<br />
New York University,New York,NY 66<br />
The University of Utah,Salt Lake City,UT 65<br />
White <strong>in</strong> this table were Non-Hispanic or Lat<strong>in</strong>o race alone and <strong>in</strong> comb<strong>in</strong>ation.<br />
Graduates refer to those who graduated <strong>in</strong> 2011.<br />
Source: <strong>AAMC</strong> Data Warehouse: Student data, Applicant and Matriculant File, as of 6/8/<strong>2012</strong>.<br />
90<br />
Association of American <strong>Medical</strong> Colleges
<strong>Diversity</strong> <strong>in</strong> <strong>Medical</strong> <strong>Education</strong>: <strong>Facts</strong> & <strong>Figures</strong> <strong>2012</strong><br />
Table 24a: U.S. <strong>Medical</strong> Schools by Number of Applications (≥300) from Blacks or African Americans,<br />
2011<br />
Table 24a: U.S. <strong>Medical</strong> Schools by Number of Applications (>=300) from Blacks<br />
or African Americans, 2011<br />
<strong>Medical</strong> Schools Applications<br />
Howard University College of Medic<strong>in</strong>e,Wash<strong>in</strong>gton,DC 1,967<br />
Meharry <strong>Medical</strong> College,Nashville,TN 1,747<br />
Morehouse School of Medic<strong>in</strong>e,Atlanta,GA 1,608<br />
George Wash<strong>in</strong>gton University School of Medic<strong>in</strong>e and Health Sciences,Wash<strong>in</strong>gton,DC 895<br />
Drexel University College of Medic<strong>in</strong>e,Philadelphia,PA 760<br />
Temple University School of Medic<strong>in</strong>e,Philadelphia,PA 682<br />
Emory University School of Medic<strong>in</strong>e,Atlanta,GA 614<br />
Georgetown University School of Medic<strong>in</strong>e,Wash<strong>in</strong>gton,DC 575<br />
University of Ill<strong>in</strong>ois College of Medic<strong>in</strong>e,Chicago,IL 563<br />
New York <strong>Medical</strong> College,Valhalla,NY 530<br />
Tulane University School of Medic<strong>in</strong>e,New Orleans,LA 526<br />
Wake Forest School of Medic<strong>in</strong>e of Wake Forest Baptist <strong>Medical</strong> Center,W<strong>in</strong>ston-Salem,NC 477<br />
Harvard <strong>Medical</strong> School,Boston,MA 472<br />
Ohio State University College of Medic<strong>in</strong>e,Columbus,OH 448<br />
Johns Hopk<strong>in</strong>s University School of Medic<strong>in</strong>e,Baltimore,MD 446<br />
State University of New York Downstate <strong>Medical</strong> Center College of Medic<strong>in</strong>e,Brooklyn,NY 443<br />
University of Maryland School of Medic<strong>in</strong>e,Baltimore,MD 441<br />
Florida State University College of Medic<strong>in</strong>e,Tallahassee,FL 396<br />
University of Miami Leonard M. Miller School of Medic<strong>in</strong>e,Miami,FL 394<br />
Chicago <strong>Medical</strong> School at Rosal<strong>in</strong>d Frankl<strong>in</strong> University of Medic<strong>in</strong>e & Science,North Chicago,IL 390<br />
Columbia University College of Physicians and Surgeons,New York,NY 389<br />
Boston University School of Medic<strong>in</strong>e,Boston,MA 384<br />
University of North Carol<strong>in</strong>a at Chapel Hill School of Medic<strong>in</strong>e,Chapel Hill,NC 384<br />
Virg<strong>in</strong>ia Commonwealth University School of Medic<strong>in</strong>e,Richmond,VA 367<br />
Jefferson <strong>Medical</strong> College of Thomas Jefferson University,Philadelphia,PA 362<br />
Loyola University Chicago Stritch School of Medic<strong>in</strong>e,Maywood,IL 360<br />
New York University School of Medic<strong>in</strong>e,New York,NY 353<br />
Michigan State University College of Human Medic<strong>in</strong>e,East Lans<strong>in</strong>g,MI 351<br />
Baylor College of Medic<strong>in</strong>e,Houston,TX 348<br />
Albany <strong>Medical</strong> College,Albany,NY 347<br />
Albert E<strong>in</strong>ste<strong>in</strong> College of Medic<strong>in</strong>e of Yeshiva University,Bronx,NY 347<br />
Vanderbilt University School of Medic<strong>in</strong>e,Nashville,TN 339<br />
Eastern Virg<strong>in</strong>ia <strong>Medical</strong> School,Norfolk,VA 338<br />
Mount S<strong>in</strong>ai School of Medic<strong>in</strong>e,New York,NY 337<br />
Raymond and Ruth Perelman School of Medic<strong>in</strong>e at the University of Pennsylvania,Philadelphia,PA 335<br />
University of Medic<strong>in</strong>e and Dentistry of New Jersey-New Jersey <strong>Medical</strong> School,Newark,NJ 328<br />
Florida International University Herbert Wertheim College of Medic<strong>in</strong>e,Miami,FL 326<br />
Stony Brook University School of Medic<strong>in</strong>e, Stony Brook,NY 323<br />
Wayne State University School of Medic<strong>in</strong>e,Detroit,MI 322<br />
Northwestern University The Fe<strong>in</strong>berg School of Medic<strong>in</strong>e,Chicago,IL 320<br />
University of Medic<strong>in</strong>e and Dentistry of New Jersey-Robert Wood Johnson <strong>Medical</strong> School,Piscataway,NJ 320<br />
Weill Cornell <strong>Medical</strong> College,New York,NY 310<br />
University of Pittsburgh School of Medic<strong>in</strong>e,Pittsburgh,PA 305<br />
Hofstra North Shore - LIJ School of Medic<strong>in</strong>e,Hempstead,NY 302<br />
Note: The numbers <strong>in</strong> this table are Non-Hispanic Black or African American race alone.<br />
Source: <strong>AAMC</strong> Data Warehouse: Applicant Matriculant File, as of March 14, <strong>2012</strong>.<br />
91<br />
Association of American <strong>Medical</strong> Colleges
<strong>Diversity</strong> <strong>in</strong> <strong>Medical</strong> <strong>Education</strong>: <strong>Facts</strong> & <strong>Figures</strong> <strong>2012</strong><br />
Table 24b: U.S. <strong>Medical</strong> Schools by Number of Black or African American Matriculants (≥10), 2011<br />
Table 24b: U.S. <strong>Medical</strong> Schools by Number of Black or African American Matriculants (>=10), 2011<br />
<strong>Medical</strong> Schools Matriculants<br />
Meharry <strong>Medical</strong> College,Nashville,TN 92<br />
Howard University College of Medic<strong>in</strong>e,Wash<strong>in</strong>gton,DC 75<br />
Morehouse School of Medic<strong>in</strong>e,Atlanta,GA 45<br />
University of Texas <strong>Medical</strong> Branch School of Medic<strong>in</strong>e,Galveston,TX 43<br />
University of Ill<strong>in</strong>ois College of Medic<strong>in</strong>e,Chicago,IL 27<br />
Ohio State University College of Medic<strong>in</strong>e,Columbus,OH 24<br />
Indiana University School of Medic<strong>in</strong>e,Indianapolis,IN 21<br />
<strong>Medical</strong> University of South Carol<strong>in</strong>a College of Medic<strong>in</strong>e,Charleston,SC 20<br />
University of Texas <strong>Medical</strong> School at Houston,Houston,TX 18<br />
Drexel University College of Medic<strong>in</strong>e,Philadelphia,PA 17<br />
Duke University School of Medic<strong>in</strong>e,Durham,NC 17<br />
<strong>Medical</strong> College of Wiscons<strong>in</strong>,Milwaukee,WI 17<br />
<strong>Medical</strong> College of Georgia at Georgia Health Sciences University,Augusta,GA 16<br />
Loma L<strong>in</strong>da University School of Medic<strong>in</strong>e,Loma L<strong>in</strong>da,CA 15<br />
University of Mississippi School of Medic<strong>in</strong>e,Jackson,MS 15<br />
University of Tennessee Health Science Center College of Medic<strong>in</strong>e,Memphis,TN 15<br />
Raymond and Ruth Perelman School of Medic<strong>in</strong>e at the University of Pennsylvania,Philadelphia,PA 14<br />
State University of New York Upstate <strong>Medical</strong> University,Syracuse,NY 14<br />
The Warren Alpert <strong>Medical</strong> School of Brown University,Providence,RI 14<br />
University of Miami Leonard M. Miller School of Medic<strong>in</strong>e,Miami,FL 14<br />
Wayne State University School of Medic<strong>in</strong>e,Detroit,MI 14<br />
Columbia University College of Physicians and Surgeons,New York,NY 13<br />
Eastern Virg<strong>in</strong>ia <strong>Medical</strong> School,Norfolk,VA 13<br />
Johns Hopk<strong>in</strong>s University School of Medic<strong>in</strong>e,Baltimore,MD 13<br />
University of North Carol<strong>in</strong>a at Chapel Hill School of Medic<strong>in</strong>e,Chapel Hill,NC 13<br />
University of Pittsburgh School of Medic<strong>in</strong>e,Pittsburgh,PA 13<br />
Wright State University Boonshoft School of Medic<strong>in</strong>e,Dayton,OH 13<br />
Michigan State University College of Human Medic<strong>in</strong>e,East Lans<strong>in</strong>g,MI 12<br />
Temple University School of Medic<strong>in</strong>e,Philadelphia,PA 12<br />
Yale University School of Medic<strong>in</strong>e,New Haven,CT 12<br />
George Wash<strong>in</strong>gton University School of Medic<strong>in</strong>e and Health Sciences,Wash<strong>in</strong>gton,DC 11<br />
University of Florida College of Medic<strong>in</strong>e,Ga<strong>in</strong>esville,FL 11<br />
University of Medic<strong>in</strong>e and Dentistry of New Jersey-New Jersey <strong>Medical</strong> School,Newark,NJ 11<br />
University of Virg<strong>in</strong>ia School of Medic<strong>in</strong>e,Charlottesville,VA 11<br />
New York <strong>Medical</strong> College,Valhalla,NY 10<br />
Sa<strong>in</strong>t Louis University School of Medic<strong>in</strong>e,St. Louis,MO 10<br />
University of Kansas School of Medic<strong>in</strong>e,Kansas City,KS 10<br />
Wake Forest School of Medic<strong>in</strong>e of Wake Forest Baptist <strong>Medical</strong> Center,W<strong>in</strong>ston-Salem,NC 10<br />
Note: The numbers <strong>in</strong> this table were Non-Hispanic Black or African American race alone.<br />
Source: <strong>AAMC</strong> Data Warehouse: Applicant Matriculant File, as of March 14, <strong>2012</strong>.<br />
92<br />
Association of American <strong>Medical</strong> Colleges
<strong>Diversity</strong> <strong>in</strong> <strong>Medical</strong> <strong>Education</strong>: <strong>Facts</strong> & <strong>Figures</strong> <strong>2012</strong><br />
Table 25a: U.S. <strong>Medical</strong> Schools by Number of Applications (≥400) from Hispanics or Lat<strong>in</strong>os, 2011<br />
Table 25a: U.S. <strong>Medical</strong> Schools by Number of Applications (>=400) from Hispanics<br />
or Lat<strong>in</strong>os, 2011<br />
<strong>Medical</strong> Schools Applications<br />
George Wash<strong>in</strong>gton University School of Medic<strong>in</strong>e and Health Sciences,Wash<strong>in</strong>gton,DC 886<br />
Drexel University College of Medic<strong>in</strong>e,Philadelphia,PA 752<br />
University of Miami Leonard M. Miller School of Medic<strong>in</strong>e,Miami,FL 720<br />
New York <strong>Medical</strong> College,Valhalla,NY 710<br />
Boston University School of Medic<strong>in</strong>e,Boston,MA 706<br />
Georgetown University School of Medic<strong>in</strong>e,Wash<strong>in</strong>gton,DC 691<br />
Tulane University School of Medic<strong>in</strong>e,New Orleans,LA 641<br />
Ponce School of Medic<strong>in</strong>e and Health Sciences,Ponce,PR 624<br />
Howard University College of Medic<strong>in</strong>e,Wash<strong>in</strong>gton,DC 606<br />
Temple University School of Medic<strong>in</strong>e,Philadelphia,PA 596<br />
Universidad Central del Caribe School of Medic<strong>in</strong>e,Bayamon,PR 582<br />
Florida State University College of Medic<strong>in</strong>e,Tallahassee,FL 572<br />
University of California, Los Angeles David Geffen School of Medic<strong>in</strong>e,Los Angeles,CA 571<br />
Harvard <strong>Medical</strong> School,Boston,MA 566<br />
Keck School of Medic<strong>in</strong>e of the University of Southern California,Los Angeles,CA 560<br />
University of Ill<strong>in</strong>ois College of Medic<strong>in</strong>e,Chicago,IL 558<br />
Chicago <strong>Medical</strong> School at Rosal<strong>in</strong>d Frankl<strong>in</strong> University of Medic<strong>in</strong>e & Science,North Chicago,IL 548<br />
Albert E<strong>in</strong>ste<strong>in</strong> College of Medic<strong>in</strong>e of Yeshiva University,Bronx,NY 538<br />
Florida International University Herbert Wertheim College of Medic<strong>in</strong>e,Miami,FL 535<br />
San Juan Bautista School of Medic<strong>in</strong>e,Caguas,PR 535<br />
University of Texas <strong>Medical</strong> Branch School of Medic<strong>in</strong>e,Galveston,TX 531<br />
New York University School of Medic<strong>in</strong>e,New York,NY 530<br />
University of California, San Francisco, School of Medic<strong>in</strong>e,San Francisco,CA 530<br />
University of Texas <strong>Medical</strong> School at Houston,Houston,TX 528<br />
Loyola University Chicago Stritch School of Medic<strong>in</strong>e,Maywood,IL 527<br />
Northwestern University The Fe<strong>in</strong>berg School of Medic<strong>in</strong>e,Chicago,IL 521<br />
The University of Texas School of Medic<strong>in</strong>e at San Antonio,San Antonio,TX 521<br />
Tufts University School of Medic<strong>in</strong>e,Boston,MA 508<br />
Jefferson <strong>Medical</strong> College of Thomas Jefferson University,Philadelphia,PA 505<br />
University of Central Florida College of Medic<strong>in</strong>e,Orlando,FL 499<br />
Stanford University School of Medic<strong>in</strong>e,Stanford,CA 497<br />
University of California, San Diego School of Medic<strong>in</strong>e,La Jolla,CA 496<br />
University of Texas Southwestern <strong>Medical</strong> Center at Dallas Southwestern <strong>Medical</strong> School,Dallas,TX 493<br />
Columbia University College of Physicians and Surgeons,New York,NY 484<br />
USF Health Morsani College of Medic<strong>in</strong>e,Tampa,FL 480<br />
Texas A&M Health Science Center College of Medic<strong>in</strong>e,College Station,TX 471<br />
University of Puerto Rico School of Medic<strong>in</strong>e,San Juan,PR 470<br />
Mount S<strong>in</strong>ai School of Medic<strong>in</strong>e,New York,NY 466<br />
University of California, Irv<strong>in</strong>e, School of Medic<strong>in</strong>e,Irv<strong>in</strong>e,CA 463<br />
Texas Tech University Health Sciences Center School of Medic<strong>in</strong>e,Lubbock,TX 453<br />
Loma L<strong>in</strong>da University School of Medic<strong>in</strong>e,Loma L<strong>in</strong>da,CA 451<br />
University of Florida College of Medic<strong>in</strong>e,Ga<strong>in</strong>esville,FL 434<br />
Albany <strong>Medical</strong> College,Albany,NY 417<br />
University of California, Davis, School of Medic<strong>in</strong>e,Sacramento,CA 415<br />
Meharry <strong>Medical</strong> College,Nashville,TN 414<br />
Emory University School of Medic<strong>in</strong>e,Atlanta,GA 405<br />
Weill Cornell <strong>Medical</strong> College,New York,NY 402<br />
Source: <strong>AAMC</strong> Data Warehouse:Applicant Matriculant File, as of March 14, <strong>2012</strong>.<br />
93<br />
Association of American <strong>Medical</strong> Colleges
<strong>Diversity</strong> <strong>in</strong> <strong>Medical</strong> <strong>Education</strong>: <strong>Facts</strong> & <strong>Figures</strong> <strong>2012</strong><br />
Table 25b: U.S. <strong>Medical</strong> Schools by Number of Hispanic or Lat<strong>in</strong>o Matriculants (≥ 15), 2011<br />
Table 25b: U.S. <strong>Medical</strong> Schools by Number of Hispanic or Lat<strong>in</strong>o Matriculants (>=15), 2011<br />
<strong>Medical</strong> Schools Matriculants<br />
University of Puerto Rico School of Medic<strong>in</strong>e,San Juan,PR 112<br />
Ponce School of Medic<strong>in</strong>e and Health Sciences,Ponce,PR 62<br />
Universidad Central del Caribe School of Medic<strong>in</strong>e,Bayamon,PR 62<br />
San Juan Bautista School of Medic<strong>in</strong>e,Caguas,PR 54<br />
University of Ill<strong>in</strong>ois College of Medic<strong>in</strong>e,Chicago,IL 46<br />
University of Texas <strong>Medical</strong> Branch School of Medic<strong>in</strong>e,Galveston,TX 44<br />
University of New Mexico School of Medic<strong>in</strong>e,Albuquerque,NM 34<br />
University of Texas <strong>Medical</strong> School at Houston,Houston,TX 34<br />
The University of Texas School of Medic<strong>in</strong>e at San Antonio,San Antonio,TX 31<br />
University of Colorado School of Medic<strong>in</strong>e,Aurora,CO 31<br />
Baylor College of Medic<strong>in</strong>e,Houston,TX 28<br />
University of Miami Leonard M. Miller School of Medic<strong>in</strong>e,Miami,FL 27<br />
Florida International University Herbert Wertheim College of Medic<strong>in</strong>e,Miami,FL 24<br />
University of Texas Southwestern <strong>Medical</strong> Center at Dallas Southwestern <strong>Medical</strong> School,Dallas,TX 24<br />
Northwestern University The Fe<strong>in</strong>berg School of Medic<strong>in</strong>e,Chicago,IL 23<br />
Texas A&M Health Science Center College of Medic<strong>in</strong>e,College Station,TX 22<br />
University of California, San Francisco, School of Medic<strong>in</strong>e,San Francisco,CA 22<br />
Florida State University College of Medic<strong>in</strong>e,Tallahassee,FL 21<br />
Raymond and Ruth Perelman School of Medic<strong>in</strong>e at the University of Pennsylvania,Philadelphia,PA 21<br />
University of California, Davis, School of Medic<strong>in</strong>e,Sacramento,CA 21<br />
Keck School of Medic<strong>in</strong>e of the University of Southern California,Los Angeles,CA 20<br />
Columbia University College of Physicians and Surgeons,New York,NY 19<br />
Jefferson <strong>Medical</strong> College of Thomas Jefferson University,Philadelphia,PA 19<br />
University of Wash<strong>in</strong>gton School of Medic<strong>in</strong>e,Seattle,WA 19<br />
University of Florida College of Medic<strong>in</strong>e,Ga<strong>in</strong>esville,FL 18<br />
USF Health Morsani College of Medic<strong>in</strong>e,Tampa,FL 17<br />
Albert E<strong>in</strong>ste<strong>in</strong> College of Medic<strong>in</strong>e of Yeshiva University,Bronx,NY 16<br />
Boston University School of Medic<strong>in</strong>e,Boston,MA 16<br />
Harvard <strong>Medical</strong> School,Boston,MA 16<br />
Mount S<strong>in</strong>ai School of Medic<strong>in</strong>e,New York,NY 16<br />
New York <strong>Medical</strong> College,Valhalla,NY 16<br />
New York University School of Medic<strong>in</strong>e,New York,NY 16<br />
University of Virg<strong>in</strong>ia School of Medic<strong>in</strong>e,Charlottesville,VA 16<br />
The Warren Alpert <strong>Medical</strong> School of Brown University,Providence,RI 15<br />
University of Medic<strong>in</strong>e and Dentistry of New Jersey-New Jersey <strong>Medical</strong> School,Newark,NJ 15<br />
Source: <strong>AAMC</strong> Data Warehouse: Applicant Matriculant File, as of March 14, <strong>2012</strong>.<br />
94<br />
Association of American <strong>Medical</strong> Colleges
<strong>Diversity</strong> <strong>in</strong> <strong>Medical</strong> <strong>Education</strong>: <strong>Facts</strong> & <strong>Figures</strong> <strong>2012</strong><br />
Table 26a: U.S. <strong>Medical</strong> Schools by Number of Applications (≥8) from American Indians and<br />
Table 26a: U.S. <strong>Medical</strong> Schoos by Number of Applications (>=8) from American<br />
Alaska Natives, 2011<br />
Indians and Alaska Natives, 2011<br />
<strong>Medical</strong> Schools Applications<br />
University of Oklahoma College of Medic<strong>in</strong>e,Oklahoma City,OK 37<br />
University of M<strong>in</strong>nesota <strong>Medical</strong> School,M<strong>in</strong>neapolis,MN 24<br />
George Wash<strong>in</strong>gton University School of Medic<strong>in</strong>e and Health Sciences,Wash<strong>in</strong>gton,DC 18<br />
University of Arkansas for <strong>Medical</strong> Sciences College of Medic<strong>in</strong>e,Little Rock,AR 18<br />
University of Colorado School of Medic<strong>in</strong>e,Aurora,CO 18<br />
Boston University School of Medic<strong>in</strong>e,Boston,MA 17<br />
Northwestern University The Fe<strong>in</strong>berg School of Medic<strong>in</strong>e,Chicago,IL 15<br />
University of Wash<strong>in</strong>gton School of Medic<strong>in</strong>e,Seattle,WA 15<br />
Harvard <strong>Medical</strong> School,Boston,MA 14<br />
Creighton University School of Medic<strong>in</strong>e,Omaha,NE 13<br />
Sa<strong>in</strong>t Louis University School of Medic<strong>in</strong>e,St. Louis,MO 13<br />
University of Kansas School of Medic<strong>in</strong>e,Kansas City,KS 13<br />
Drexel University College of Medic<strong>in</strong>e,Philadelphia,PA 11<br />
Emory University School of Medic<strong>in</strong>e,Atlanta,GA 11<br />
Georgetown University School of Medic<strong>in</strong>e,Wash<strong>in</strong>gton,DC 11<br />
Loma L<strong>in</strong>da University School of Medic<strong>in</strong>e,Loma L<strong>in</strong>da,CA 11<br />
Michigan State University College of Human Medic<strong>in</strong>e,East Lans<strong>in</strong>g,MI 11<br />
University of Arizona College of Medic<strong>in</strong>e,Tucson,AZ 11<br />
University of California, Los Angeles David Geffen School of Medic<strong>in</strong>e,Los Angeles,CA 11<br />
Chicago <strong>Medical</strong> School at Rosal<strong>in</strong>d Frankl<strong>in</strong> University of Medic<strong>in</strong>e & Science,North Chicago,IL 10<br />
Dartmouth <strong>Medical</strong> School,Hanover,NH 10<br />
Temple University School of Medic<strong>in</strong>e,Philadelphia,PA 10<br />
Texas Tech University Health Sciences Center School of Medic<strong>in</strong>e,Lubbock,TX 10<br />
Tufts University School of Medic<strong>in</strong>e,Boston,MA 10<br />
Tulane University School of Medic<strong>in</strong>e,New Orleans,LA 10<br />
University of California, San Francisco, School of Medic<strong>in</strong>e,San Francisco,CA 10<br />
University of Missouri-Columbia School of Medic<strong>in</strong>e,Columbia,MO 10<br />
University of Vermont College of Medic<strong>in</strong>e,Burl<strong>in</strong>gton,VT 10<br />
Baylor College of Medic<strong>in</strong>e,Houston,TX 9<br />
Keck School of Medic<strong>in</strong>e of the University of Southern California,Los Angeles,CA 9<br />
<strong>Medical</strong> College of Wiscons<strong>in</strong>,Milwaukee,WI 9<br />
University of Arizona College of Medic<strong>in</strong>e-Phoenix,Phoenix,AZ 9<br />
University of Louisville School of Medic<strong>in</strong>e,Louisville,KY 9<br />
University of New Mexico School of Medic<strong>in</strong>e,Albuquerque,NM 9<br />
Vanderbilt University School of Medic<strong>in</strong>e,Nashville,TN 9<br />
Virg<strong>in</strong>ia Commonwealth University School of Medic<strong>in</strong>e,Richmond,VA 9<br />
Wake Forest School of Medic<strong>in</strong>e of Wake Forest Baptist <strong>Medical</strong> Center,W<strong>in</strong>ston-Salem,NC 9<br />
Oregon Health & Science University School of Medic<strong>in</strong>e,Portland,OR 8<br />
Rush <strong>Medical</strong> College of Rush University <strong>Medical</strong> Center,Chicago,IL 8<br />
The University of Toledo College of Medic<strong>in</strong>e,Toledo,OH 8<br />
University of California, San Diego School of Medic<strong>in</strong>e,La Jolla,CA 8<br />
University of Ill<strong>in</strong>ois College of Medic<strong>in</strong>e,Chicago,IL 8<br />
University of Iowa Roy J. and Lucille A. Carver College of Medic<strong>in</strong>e,Iowa City,IA 8<br />
University of Texas <strong>Medical</strong> School at Houston,Houston,TX 8<br />
University of Texas Southwestern <strong>Medical</strong> Center at Dallas Southwestern <strong>Medical</strong> School,Dallas,TX 8<br />
Wayne State University School of Medic<strong>in</strong>e,Detroit,MI 8<br />
Note: The numbers <strong>in</strong> this table are Non-Hispanic American Indian or Alaska Native race alone.<br />
Source: <strong>AAMC</strong> Data Warehouse: Applicant Matriculant File, as of March 14, <strong>2012</strong>.<br />
95<br />
Association of American <strong>Medical</strong> Colleges
<strong>Diversity</strong> <strong>in</strong> <strong>Medical</strong> <strong>Education</strong>: <strong>Facts</strong> & <strong>Figures</strong> <strong>2012</strong><br />
Table 26b: U.S. <strong>Medical</strong> Schools by Number of American Indians and Alaska Native Matriculants,<br />
2011<br />
Table 26b: U.S. <strong>Medical</strong> Schools by Number of American Indian and Alaska Native Matriculants, 2011<br />
<strong>Medical</strong> Schools Matriculants<br />
University of Oklahoma College of Medic<strong>in</strong>e,Oklahoma City,OK 6<br />
University of M<strong>in</strong>nesota <strong>Medical</strong> School,M<strong>in</strong>neapolis,MN 4<br />
University of North Dakota School of Medic<strong>in</strong>e and Health Sciences,Grand Forks,ND 4<br />
Texas Tech University Health Sciences Center School of Medic<strong>in</strong>e,Lubbock,TX 3<br />
University of New Mexico School of Medic<strong>in</strong>e,Albuquerque,NM 2<br />
University of Wash<strong>in</strong>gton School of Medic<strong>in</strong>e,Seattle,WA 2<br />
Baylor College of Medic<strong>in</strong>e,Houston,TX 1<br />
Columbia University College of Physicians and Surgeons,New York,NY 1<br />
Dartmouth <strong>Medical</strong> School,Hanover,NH 1<br />
Georgetown University School of Medic<strong>in</strong>e,Wash<strong>in</strong>gton,DC 1<br />
Loyola University Chicago Stritch School of Medic<strong>in</strong>e,Maywood,IL 1<br />
Stanford University School of Medic<strong>in</strong>e,Stanford,CA 1<br />
The University of Texas School of Medic<strong>in</strong>e at San Antonio,San Antonio,TX 1<br />
Tufts University School of Medic<strong>in</strong>e,Boston,MA 1<br />
Uniformed Services University of the Health Sciences F. Edward Hebert School of Medic<strong>in</strong>e,Bethesda,MD 1<br />
University at Buffalo State University of New York School of Medic<strong>in</strong>e & Biomedical Sciences,Buffalo,NY 1<br />
University of Colorado School of Medic<strong>in</strong>e,Aurora,CO 1<br />
University of Michigan <strong>Medical</strong> School,Ann Arbor,MI 1<br />
University of Missouri-Columbia School of Medic<strong>in</strong>e,Columbia,MO 1<br />
University of Missouri-Kansas City School of Medic<strong>in</strong>e,Kansas City,MO 1<br />
University of Texas <strong>Medical</strong> School at Houston,Houston,TX 1<br />
University of Virg<strong>in</strong>ia School of Medic<strong>in</strong>e,Charlottesville,VA 1<br />
Vanderbilt University School of Medic<strong>in</strong>e,Nashville,TN 1<br />
Wake Forest School of Medic<strong>in</strong>e of Wake Forest Baptist <strong>Medical</strong> Center,W<strong>in</strong>ston-Salem,NC 1<br />
Wayne State University School of Medic<strong>in</strong>e,Detroit,MI 1<br />
Weill Cornell <strong>Medical</strong> College,New York,NY 1<br />
Note: The numbers <strong>in</strong> this table are Non-Hispanic American Indian or Alaska Native race alone.<br />
Source: <strong>AAMC</strong> Data Warehouse: Applicant Matriculant File, as of March 14, <strong>2012</strong>.<br />
96<br />
Association of American <strong>Medical</strong> Colleges
<strong>Diversity</strong> <strong>in</strong> <strong>Medical</strong> <strong>Education</strong>: <strong>Facts</strong> & <strong>Figures</strong> <strong>2012</strong><br />
Table 27a: U.S. <strong>Medical</strong> Schools by Number of Applications (≥1,500) from Asians, 2011<br />
Table 27a: U.S. <strong>Medical</strong> Schoos by Number of Applications (>=1,500) from Asians, 2011<br />
<strong>Medical</strong> Schools Applications<br />
George Wash<strong>in</strong>gton University School of Medic<strong>in</strong>e and Health Sciences,Wash<strong>in</strong>gton,DC 3,856<br />
Drexel University College of Medic<strong>in</strong>e,Philadelphia,PA 3,773<br />
New York <strong>Medical</strong> College,Valhalla,NY 3,597<br />
Georgetown University School of Medic<strong>in</strong>e,Wash<strong>in</strong>gton,DC 3,100<br />
Boston University School of Medic<strong>in</strong>e,Boston,MA 3,039<br />
Chicago <strong>Medical</strong> School at Rosal<strong>in</strong>d Frankl<strong>in</strong> University of Medic<strong>in</strong>e & Science,North 2,946<br />
Temple University School of Medic<strong>in</strong>e,Philadelphia,PA 2,944<br />
Jefferson <strong>Medical</strong> College of Thomas Jefferson University,Philadelphia,PA 2,777<br />
Albany <strong>Medical</strong> College,Albany,NY 2,696<br />
Tulane University School of Medic<strong>in</strong>e,New Orleans,LA 2,581<br />
Loyola University Chicago Stritch School of Medic<strong>in</strong>e,Maywood,IL 2,547<br />
Tufts University School of Medic<strong>in</strong>e,Boston,MA 2,518<br />
New York University School of Medic<strong>in</strong>e,New York,NY 2,431<br />
University of Ill<strong>in</strong>ois College of Medic<strong>in</strong>e,Chicago,IL 2,362<br />
Keck School of Medic<strong>in</strong>e of the University of Southern California,Los Angeles,CA 2,349<br />
University of California, Los Angeles David Geffen School of Medic<strong>in</strong>e,Los Angeles,CA 2,297<br />
Albert E<strong>in</strong>ste<strong>in</strong> College of Medic<strong>in</strong>e of Yeshiva University,Bronx,NY 2,263<br />
University of California, San Francisco, School of Medic<strong>in</strong>e,San Francisco,CA 2,214<br />
University of California, Irv<strong>in</strong>e, School of Medic<strong>in</strong>e,Irv<strong>in</strong>e,CA 2,030<br />
Rush <strong>Medical</strong> College of Rush University <strong>Medical</strong> Center,Chicago,IL 2,028<br />
Columbia University College of Physicians and Surgeons,New York,NY 2,016<br />
University of California, San Diego School of Medic<strong>in</strong>e,La Jolla,CA 2,009<br />
Pennsylvania State University College of Medic<strong>in</strong>e,Hershey,PA 2,008<br />
Virg<strong>in</strong>ia Commonwealth University School of Medic<strong>in</strong>e,Richmond,VA 1,979<br />
Stanford University School of Medic<strong>in</strong>e,Stanford,CA 1,942<br />
University of California, Davis, School of Medic<strong>in</strong>e,Sacramento,CA 1,914<br />
Mount S<strong>in</strong>ai School of Medic<strong>in</strong>e,New York,NY 1,901<br />
Weill Cornell <strong>Medical</strong> College,New York,NY 1,738<br />
Raymond and Ruth Perelman School of Medic<strong>in</strong>e at the University of 1,736<br />
State University of New York Downstate <strong>Medical</strong> Center College of Medic<strong>in</strong>e,Brooklyn,NY 1,722<br />
Howard University College of Medic<strong>in</strong>e,Wash<strong>in</strong>gton,DC 1,721<br />
Michigan State University College of Human Medic<strong>in</strong>e,East Lans<strong>in</strong>g,MI 1,707<br />
Northwestern University The Fe<strong>in</strong>berg School of Medic<strong>in</strong>e,Chicago,IL 1,678<br />
<strong>Medical</strong> College of Wiscons<strong>in</strong>,Milwaukee,WI 1,630<br />
Sa<strong>in</strong>t Louis University School of Medic<strong>in</strong>e,St. Louis,MO 1,619<br />
University of Rochester School of Medic<strong>in</strong>e and Dentistry,Rochester,NY 1,599<br />
University at Buffalo State University of New York School of Medic<strong>in</strong>e & Biomedical 1,594<br />
Harvard <strong>Medical</strong> School,Boston,MA 1,588<br />
Emory University School of Medic<strong>in</strong>e,Atlanta,GA 1,560<br />
Case Western Reserve University School of Medic<strong>in</strong>e,Cleveland,OH 1,558<br />
Wake Forest School of Medic<strong>in</strong>e of Wake Forest Baptist <strong>Medical</strong> Center,W<strong>in</strong>ston- 1,555<br />
Johns Hopk<strong>in</strong>s University School of Medic<strong>in</strong>e,Baltimore,MD 1,530<br />
Loma L<strong>in</strong>da University School of Medic<strong>in</strong>e,Loma L<strong>in</strong>da,CA 1,529<br />
Note: The numbers <strong>in</strong> this table are Non-Hispanic Asian race alone.<br />
Source: <strong>AAMC</strong> Data Warehouse: Applicant Matriculant File, as of March 14, <strong>2012</strong>.<br />
97<br />
Association of American <strong>Medical</strong> Colleges
<strong>Diversity</strong> <strong>in</strong> <strong>Medical</strong> <strong>Education</strong>: <strong>Facts</strong> & <strong>Figures</strong> <strong>2012</strong><br />
Table 27b: U.S. <strong>Medical</strong> Schools by Number of Asian Matriculants (≥ 35), 2011<br />
Table 27b: U.S. <strong>Medical</strong> Schools by Number of Asian Matriculants (>=35), 2011<br />
<strong>Medical</strong> Schools Matriculants<br />
University of Ill<strong>in</strong>ois College of Medic<strong>in</strong>e,Chicago,IL 88<br />
University of Texas Southwestern <strong>Medical</strong> Center at Dallas Southwestern <strong>Medical</strong> School,Dallas,TX 79<br />
Drexel University College of Medic<strong>in</strong>e,Philadelphia,PA 78<br />
Chicago <strong>Medical</strong> School at Rosal<strong>in</strong>d Frankl<strong>in</strong> University of Medic<strong>in</strong>e & Science,North Chicago,IL 75<br />
University of Medic<strong>in</strong>e and Dentistry of New Jersey-New Jersey <strong>Medical</strong> School,Newark,NJ 75<br />
Virg<strong>in</strong>ia Commonwealth University School of Medic<strong>in</strong>e,Richmond,VA 68<br />
State University of New York Downstate <strong>Medical</strong> Center College of Medic<strong>in</strong>e,Brooklyn,NY 65<br />
Wayne State University School of Medic<strong>in</strong>e,Detroit,MI 63<br />
Texas A&M Health Science Center College of Medic<strong>in</strong>e,College Station,TX 62<br />
Ohio State University College of Medic<strong>in</strong>e,Columbus,OH 60<br />
Case Western Reserve University School of Medic<strong>in</strong>e,Cleveland,OH 58<br />
Baylor College of Medic<strong>in</strong>e,Houston,TX 57<br />
New York <strong>Medical</strong> College,Valhalla,NY 55<br />
Jefferson <strong>Medical</strong> College of Thomas Jefferson University,Philadelphia,PA 54<br />
Albany <strong>Medical</strong> College,Albany,NY 51<br />
Loma L<strong>in</strong>da University School of Medic<strong>in</strong>e,Loma L<strong>in</strong>da,CA 51<br />
University of California, Los Angeles David Geffen School of Medic<strong>in</strong>e,Los Angeles,CA 51<br />
George Wash<strong>in</strong>gton University School of Medic<strong>in</strong>e and Health Sciences,Wash<strong>in</strong>gton,DC 49<br />
University of Missouri-Kansas City School of Medic<strong>in</strong>e,Kansas City,MO 47<br />
Albert E<strong>in</strong>ste<strong>in</strong> College of Medic<strong>in</strong>e of Yeshiva University,Bronx,NY 46<br />
Harvard <strong>Medical</strong> School,Boston,MA 46<br />
Northeast Ohio <strong>Medical</strong> University,Rootstown,OH 46<br />
Sa<strong>in</strong>t Louis University School of Medic<strong>in</strong>e,St. Louis,MO 46<br />
University of California, San Diego School of Medic<strong>in</strong>e,La Jolla,CA 46<br />
The University of Texas School of Medic<strong>in</strong>e at San Antonio,San Antonio,TX 45<br />
University at Buffalo State University of New York School of Medic<strong>in</strong>e & Biomedical Sciences,Buffalo,NY 45<br />
Keck School of Medic<strong>in</strong>e of the University of Southern California,Los Angeles,CA 44<br />
University of Pittsburgh School of Medic<strong>in</strong>e,Pittsburgh,PA 44<br />
Boston University School of Medic<strong>in</strong>e,Boston,MA 43<br />
Georgetown University School of Medic<strong>in</strong>e,Wash<strong>in</strong>gton,DC 42<br />
University of Michigan <strong>Medical</strong> School,Ann Arbor,MI 42<br />
Wash<strong>in</strong>gton University <strong>in</strong> St. Louis School of Medic<strong>in</strong>e,St. Louis,MO 42<br />
<strong>Medical</strong> College of Georgia at Georgia Health Sciences University,Augusta,GA 41<br />
Temple University School of Medic<strong>in</strong>e,Philadelphia,PA 41<br />
University of Texas <strong>Medical</strong> Branch School of Medic<strong>in</strong>e,Galveston,TX 40<br />
Northwestern University The Fe<strong>in</strong>berg School of Medic<strong>in</strong>e,Chicago,IL 39<br />
University of Medic<strong>in</strong>e and Dentistry of New Jersey-Robert Wood Johnson <strong>Medical</strong> School,Piscataway,NJ 39<br />
Indiana University School of Medic<strong>in</strong>e,Indianapolis,IN 38<br />
<strong>Medical</strong> College of Wiscons<strong>in</strong>,Milwaukee,WI 38<br />
New York University School of Medic<strong>in</strong>e,New York,NY 38<br />
University of California, San Francisco, School of Medic<strong>in</strong>e,San Francisco,CA 38<br />
Johns Hopk<strong>in</strong>s University School of Medic<strong>in</strong>e,Baltimore,MD 36<br />
Michigan State University College of Human Medic<strong>in</strong>e,East Lans<strong>in</strong>g,MI 36<br />
Tufts University School of Medic<strong>in</strong>e,Boston,MA 36<br />
Note: The numbers <strong>in</strong> this table are Non-Hispanic Asian race alone.<br />
Source: <strong>AAMC</strong> Data Warehouse: Applicant Matriculant File, as of March 14, <strong>2012</strong>.<br />
98<br />
Association of American <strong>Medical</strong> Colleges
<strong>Diversity</strong> <strong>in</strong> <strong>Medical</strong> <strong>Education</strong>: <strong>Facts</strong> & <strong>Figures</strong> <strong>2012</strong><br />
Table 28a: U.S. <strong>Medical</strong> Schools by Number of Applications (≥ 2,500) from Whites, 2011<br />
Table 28a: U.S. <strong>Medical</strong> Schools by Number of Applications (>=2,500) from<br />
Whites, 2011<br />
<strong>Medical</strong> Schools Applications<br />
George Wash<strong>in</strong>gton University School of Medic<strong>in</strong>e and Health Sciences,Wash<strong>in</strong>gton,DC 7,365<br />
Drexel University College of Medic<strong>in</strong>e,Philadelphia,PA 6,396<br />
Georgetown University School of Medic<strong>in</strong>e,Wash<strong>in</strong>gton,DC 5,999<br />
Loyola University Chicago Stritch School of Medic<strong>in</strong>e,Maywood,IL 5,783<br />
Boston University School of Medic<strong>in</strong>e,Boston,MA 5,735<br />
Tulane University School of Medic<strong>in</strong>e,New Orleans,LA 5,507<br />
New York <strong>Medical</strong> College,Valhalla,NY 5,457<br />
Temple University School of Medic<strong>in</strong>e,Philadelphia,PA 5,236<br />
Jefferson <strong>Medical</strong> College of Thomas Jefferson University,Philadelphia,PA 5,102<br />
Chicago <strong>Medical</strong> School at Rosal<strong>in</strong>d Frankl<strong>in</strong> University of Medic<strong>in</strong>e & Science,North Chicago,IL 5,008<br />
Tufts University School of Medic<strong>in</strong>e,Boston,MA 4,616<br />
Wake Forest School of Medic<strong>in</strong>e of Wake Forest Baptist <strong>Medical</strong> Center,W<strong>in</strong>ston-Salem,NC 4,349<br />
<strong>Medical</strong> College of Wiscons<strong>in</strong>,Milwaukee,WI 3,955<br />
University of Ill<strong>in</strong>ois College of Medic<strong>in</strong>e,Chicago,IL 3,948<br />
Rush <strong>Medical</strong> College of Rush University <strong>Medical</strong> Center,Chicago,IL 3,915<br />
Albany <strong>Medical</strong> College,Albany,NY 3,868<br />
Pennsylvania State University College of Medic<strong>in</strong>e,Hershey,PA 3,800<br />
Creighton University School of Medic<strong>in</strong>e,Omaha,NE 3,611<br />
University of Vermont College of Medic<strong>in</strong>e,Burl<strong>in</strong>gton,VT 3,578<br />
Sa<strong>in</strong>t Louis University School of Medic<strong>in</strong>e,St. Louis,MO 3,546<br />
New York University School of Medic<strong>in</strong>e,New York,NY 3,508<br />
Albert E<strong>in</strong>ste<strong>in</strong> College of Medic<strong>in</strong>e of Yeshiva University,Bronx,NY 3,451<br />
Virg<strong>in</strong>ia Commonwealth University School of Medic<strong>in</strong>e,Richmond,VA 3,244<br />
Northwestern University The Fe<strong>in</strong>berg School of Medic<strong>in</strong>e,Chicago,IL 3,191<br />
Michigan State University College of Human Medic<strong>in</strong>e,East Lans<strong>in</strong>g,MI 3,158<br />
University of Colorado School of Medic<strong>in</strong>e,Aurora,CO 3,092<br />
Emory University School of Medic<strong>in</strong>e,Atlanta,GA 3,089<br />
Vanderbilt University School of Medic<strong>in</strong>e,Nashville,TN 3,022<br />
University of California, San Francisco, School of Medic<strong>in</strong>e,San Francisco,CA 3,017<br />
Raymond and Ruth Perelman School of Medic<strong>in</strong>e at the University of Pennsylvania,Philadelphia,PA 2,983<br />
University of Miami Leonard M. Miller School of Medic<strong>in</strong>e,Miami,FL 2,974<br />
Columbia University College of Physicians and Surgeons,New York,NY 2,970<br />
Mount S<strong>in</strong>ai School of Medic<strong>in</strong>e,New York,NY 2,860<br />
Oregon Health & Science University School of Medic<strong>in</strong>e,Portland,OR 2,839<br />
University of Michigan <strong>Medical</strong> School,Ann Arbor,MI 2,816<br />
Stanford University School of Medic<strong>in</strong>e,Stanford,CA 2,772<br />
Keck School of Medic<strong>in</strong>e of the University of Southern California,Los Angeles,CA 2,755<br />
Harvard <strong>Medical</strong> School,Boston,MA 2,752<br />
University of Wash<strong>in</strong>gton School of Medic<strong>in</strong>e,Seattle,WA 2,748<br />
University of North Carol<strong>in</strong>a at Chapel Hill School of Medic<strong>in</strong>e,Chapel Hill,NC 2,714<br />
Johns Hopk<strong>in</strong>s University School of Medic<strong>in</strong>e,Baltimore,MD 2,699<br />
University of Pittsburgh School of Medic<strong>in</strong>e,Pittsburgh,PA 2,642<br />
Dartmouth <strong>Medical</strong> School,Hanover,NH 2,640<br />
State University of New York Downstate <strong>Medical</strong> Center College of Medic<strong>in</strong>e,Brooklyn,NY 2,559<br />
University of Chicago Division of the Biological Sciences The Pritzker School of Medic<strong>in</strong>e,Chicago,IL 2,555<br />
University of C<strong>in</strong>c<strong>in</strong>nati College of Medic<strong>in</strong>e,C<strong>in</strong>c<strong>in</strong>nati,OH 2,521<br />
Note: The numbers <strong>in</strong> this table were Non-Hispanic White race alone.<br />
Source:<strong>AAMC</strong> Data Warehouse:Applicant Matriculant File, as of March 14, <strong>2012</strong>.<br />
99<br />
Association of American <strong>Medical</strong> Colleges
<strong>Diversity</strong> <strong>in</strong> <strong>Medical</strong> <strong>Education</strong>: <strong>Facts</strong> & <strong>Figures</strong> <strong>2012</strong><br />
Table 28b: U.S. <strong>Medical</strong> Schools by Number of White Matriculants (≥ 100), 2011<br />
Table 28b: U.S. <strong>Medical</strong> Schools by Number of White Matriculants (>=100), 2011<br />
<strong>Medical</strong> Schools Matriculants<br />
Indiana University School of Medic<strong>in</strong>e,Indianapolis,IN 240<br />
University of M<strong>in</strong>nesota <strong>Medical</strong> School,M<strong>in</strong>neapolis,MN 182<br />
Wayne State University School of Medic<strong>in</strong>e,Detroit,MI 182<br />
Jefferson <strong>Medical</strong> College of Thomas Jefferson University,Philadelphia,PA 162<br />
University of Texas <strong>Medical</strong> School at Houston,Houston,TX 155<br />
University of Wash<strong>in</strong>gton School of Medic<strong>in</strong>e,Seattle,WA 153<br />
<strong>Medical</strong> College of Georgia at Georgia Health Sciences University,Augusta,GA 151<br />
Louisiana State University School of Medic<strong>in</strong>e <strong>in</strong> New Orleans,New Orleans,LA 147<br />
Drexel University College of Medic<strong>in</strong>e,Philadelphia,PA 145<br />
Ohio State University College of Medic<strong>in</strong>e,Columbus,OH 145<br />
University of Ill<strong>in</strong>ois College of Medic<strong>in</strong>e,Chicago,IL 145<br />
University of Kansas School of Medic<strong>in</strong>e,Kansas City,KS 145<br />
Michigan State University College of Human Medic<strong>in</strong>e,East Lans<strong>in</strong>g,MI 134<br />
Georgetown University School of Medic<strong>in</strong>e,Wash<strong>in</strong>gton,DC 133<br />
Tufts University School of Medic<strong>in</strong>e,Boston,MA 131<br />
University of Wiscons<strong>in</strong> School of Medic<strong>in</strong>e and Public Health,Madison,WI 131<br />
University of Louisville School of Medic<strong>in</strong>e,Louisville,KY 130<br />
Tulane University School of Medic<strong>in</strong>e,New Orleans,LA 129<br />
Temple University School of Medic<strong>in</strong>e,Philadelphia,PA 128<br />
University of Alabama School of Medic<strong>in</strong>e,Birm<strong>in</strong>gham,AL 128<br />
University of Arkansas for <strong>Medical</strong> Sciences College of Medic<strong>in</strong>e,Little Rock,AR 127<br />
<strong>Medical</strong> College of Wiscons<strong>in</strong>,Milwaukee,WI 126<br />
The University of Texas School of Medic<strong>in</strong>e at San Antonio,San Antonio,TX 125<br />
The University of Toledo College of Medic<strong>in</strong>e,Toledo,OH 123<br />
<strong>Medical</strong> University of South Carol<strong>in</strong>a College of Medic<strong>in</strong>e,Charleston,SC 121<br />
University of Tennessee Health Science Center College of Medic<strong>in</strong>e,Memphis,TN 120<br />
University of Miami Leonard M. Miller School of Medic<strong>in</strong>e,Miami,FL 119<br />
University of C<strong>in</strong>c<strong>in</strong>nati College of Medic<strong>in</strong>e,C<strong>in</strong>c<strong>in</strong>nati,OH 114<br />
Creighton University School of Medic<strong>in</strong>e,Omaha,NE 113<br />
University of Oklahoma College of Medic<strong>in</strong>e,Oklahoma City,OK 112<br />
Uniformed Services University of the Health Sciences F. Edward Hebert School of Medic<strong>in</strong>e,Bethesda,MD 110<br />
Loyola University Chicago Stritch School of Medic<strong>in</strong>e,Maywood,IL 109<br />
New York <strong>Medical</strong> College,Valhalla,NY 109<br />
University of North Carol<strong>in</strong>a at Chapel Hill School of Medic<strong>in</strong>e,Chapel Hill,NC 109<br />
University of Nebraska College of Medic<strong>in</strong>e,Omaha,NE 106<br />
Albert E<strong>in</strong>ste<strong>in</strong> College of Medic<strong>in</strong>e of Yeshiva University,Bronx,NY 105<br />
University of Mississippi School of Medic<strong>in</strong>e,Jackson,MS 103<br />
University of Texas Southwestern <strong>Medical</strong> Center at Dallas Southwestern <strong>Medical</strong> School,Dallas,TX 103<br />
Texas A&M Health Science Center College of Medic<strong>in</strong>e,College Station,TX 102<br />
University of Iowa Roy J. and Lucille A. Carver College of Medic<strong>in</strong>e,Iowa City,IA 102<br />
University of Maryland School of Medic<strong>in</strong>e,Baltimore,MD 101<br />
Virg<strong>in</strong>ia Commonwealth University School of Medic<strong>in</strong>e,Richmond,VA 101<br />
Note: The numbers <strong>in</strong> this table are Non-Hispanic White race alone.<br />
Source: <strong>AAMC</strong> Data Warehouse: Applicant Matriculant File, as of March 14, <strong>2012</strong>.<br />
100<br />
Association of American <strong>Medical</strong> Colleges
<strong>Diversity</strong> <strong>in</strong> <strong>Medical</strong> <strong>Education</strong>: <strong>Facts</strong> & <strong>Figures</strong> <strong>2012</strong><br />
Table 29a: Number of U.S. <strong>Medical</strong> School Applicants by Race and Ethnicity (Alone, and <strong>in</strong> Comb<strong>in</strong>ation),<br />
2002-2011<br />
Applicants' Responses to Race and<br />
Ethnicity 2002 2003 2004 2005 2006 2007 2008 2009 2010 2011<br />
American Indian or<br />
Alaska Native<br />
Asian<br />
Black or African<br />
American<br />
Hispanic or Lat<strong>in</strong>o<br />
Native Hawaiian or<br />
Other Pacific Islander<br />
White<br />
Other Non-Hispanic<br />
or Lat<strong>in</strong>o Race<br />
No Race Response<br />
Foreign<br />
Unduplicated Total<br />
Applicants<br />
Alone 112 85 107 95 147 152 131 111 114 101<br />
In Comb<strong>in</strong>ation 269 308 358 370 274 263 269 268 301 278<br />
All 381 393 465 465 421 415 400 379 415 379<br />
Alone 5,951 6,153 6,735 7,326 7,585 8,432 8,280 8,501 8,684 8,941<br />
In Comb<strong>in</strong>ation 643 803 854 916 795 835 822 818 929 1,039<br />
All 6,594 6,956 7,589 8,242 8,380 9,267 9,102 9,319 9,613 9,980<br />
Alone 2,614 2,741 2,802 2,815 2,935 3,140 3,024 3,106 3,062 3,215<br />
In Comb<strong>in</strong>ation 369 323 376 354 287 338 318 376 413 425<br />
All 2,983 3,064 3,178 3,169 3,222 3,478 3,342 3,482 3,475 3,640<br />
Alone 182 119 280 485 700 780 867 867 937 804<br />
In Comb<strong>in</strong>ation 2,261 2,371 2,266 2,228 2,079 2,223 2,219 2,193 2,334 2,655<br />
All 2,443 2,490 2,546 2,713 2,779 3,003 3,086 3,060 3,271 3,459<br />
Alone 36 23 39 42 113 110 112 115 86 84<br />
In Comb<strong>in</strong>ation 68 96 90 80 102 96 103 90 102 74<br />
All 104 119 129 122 215 206 215 205 188 158<br />
Alone 19,458 20,236 21,045 21,802 22,732 24,174 23,816 23,493 23,392 23,958<br />
In Comb<strong>in</strong>ation 2,190 2,422 2,584 2,828 2,578 2,780 2,785 2,827 3,022 3,415<br />
All 21,648 22,658 23,629 24,630 25,310 26,954 26,601 26,320 26,414 27,373<br />
Alone 527 608 110 50 85 77 84 63 9 13<br />
In Comb<strong>in</strong>ation 1,543 1,444 431 149 84 73 51 42 37 38<br />
All 2,070 2,052 541 199 169 150 135 105 46 51<br />
Alone 269 167 221 190 330 413 905 1,142 1,275 1,304<br />
In Comb<strong>in</strong>ation 0 0 0 0 0 0 0 0 0 0<br />
All 269 167 221 190 330 413 905 1,142 1,275 1,304<br />
Alone 979 959 1,026 1,205 1,477 1,810 1,802 1,639 1,706 1,647<br />
In Comb<strong>in</strong>ation 0 0 0 0 0 0 0 0 0 0<br />
All 979 959 1,026 1,205 1,477 1,810 1,802 1,639 1,706 1,647<br />
Alone 30,128 31,091 32,365 34,010 36,104 39,088 39,021 39,037 39,265 40,067<br />
In Comb<strong>in</strong>ation 3,496 3,700 3,370 3,362 3,004 3,227 3,210 3,231 3,476 3,852<br />
All 33,624 34,791 35,735 37,372 39,108 42,315 42,231 42,268 42,741 43,919<br />
*S<strong>in</strong>ce 2002, follow<strong>in</strong>g U.S. federal guidel<strong>in</strong>es, AMCAS has asked applicants who are U.S. citizens or Permanent Residents to self-identify us<strong>in</strong>g<br />
two separate questions: the first question ("Ethnicity") asks applicants whether they are "Spanish/Hispanic/Lat<strong>in</strong>o/Lat<strong>in</strong>a" or "Not<br />
Spanish/Hispanic/Lat<strong>in</strong>o/Lat<strong>in</strong>a"; the second question ("Race") asks applicants to self-identify us<strong>in</strong>g non-Hispanic or Lat<strong>in</strong>o race categories, and<br />
applicants are asked to "check all that apply." The ethnicity category and several race categories permit further self-identification by subcategories.<br />
Prior to 2002, AMCAS applicants were not able to select more than one race; thus, data prior to 2002 are not directly comparable to<br />
later data.<br />
Source: <strong>AAMC</strong> public website: https://www.aamc.org/data/facts/applicantmatriculant/ (table 14)<br />
101<br />
Table 29a: Number of U.S. <strong>Medical</strong> School Applicants by Race and Ethnicity<br />
(Alone, and <strong>in</strong> Comb<strong>in</strong>ation), 2002–2011<br />
Association of American <strong>Medical</strong> Colleges
<strong>Diversity</strong> <strong>in</strong> <strong>Medical</strong> <strong>Education</strong>: <strong>Facts</strong> & <strong>Figures</strong> <strong>2012</strong><br />
Table 29b: Percentage of U.S. <strong>Medical</strong> School Applicants by Race and Ethnicity<br />
(Alone, and <strong>in</strong> Comb<strong>in</strong>ation), 2002–2011<br />
Table 29b: Percentage of U.S. <strong>Medical</strong> School Applicants by Race and Ethnicity (Alone, and <strong>in</strong> Comb<strong>in</strong>ation),<br />
2002-2011<br />
Percentage of Applicants' Responses to<br />
Race and Ethnicity 2002 2003 2004 2005 2006 2007 2008 2009 2010 2011<br />
American Indian or<br />
Alaska Native<br />
Asian<br />
Black or African<br />
American<br />
Hispanic or Lat<strong>in</strong>o<br />
Native Hawaiian or<br />
Other Pacific Islander<br />
White<br />
Other Non-Hispanic<br />
or Lat<strong>in</strong>o Race<br />
No Race Response<br />
Foreign<br />
Unduplicated Total<br />
Applicants<br />
of Alone 29.4 21.6 23.0 20.4 34.9 36.6 32.8 29.3 27.5 26.6<br />
of <strong>in</strong> Comb<strong>in</strong>ation 70.6 78.4 77.0 79.6 65.1 63.4 67.3 70.7 72.5 73.4<br />
of All <strong>in</strong> Total Applicants 1.1 1.1 1.3 1.2 1.1 1.0 0.9 0.9 1.0 0.9<br />
of Alone 90.2 88.5 88.7 88.9 90.5 91.0 91.0 91.2 90.3 89.6<br />
of <strong>in</strong> Comb<strong>in</strong>ation 9.8 11.5 11.3 11.1 9.5 9.0 9.0 8.8 9.7 10.4<br />
of All <strong>in</strong> Total Applicants 19.6 20.0 21.2 22.1 21.4 21.9 21.6 22.0 22.5 22.7<br />
of Alone 87.6 89.5 88.2 88.8 91.1 90.3 90.5 89.2 88.1 88.3<br />
of <strong>in</strong> Comb<strong>in</strong>ation 12.4 10.5 11.8 11.2 8.9 9.7 9.5 10.8 11.9 11.7<br />
of All <strong>in</strong> Total Applicants 8.9 8.8 8.9 8.5 8.2 8.2 7.9 8.2 8.1 8.3<br />
of Alone 7.4 4.8 11.0 17.9 25.2 26.0 28.1 28.3 28.6 23.2<br />
of <strong>in</strong> Comb<strong>in</strong>ation 92.6 95.2 89.0 82.1 74.8 74.0 71.9 71.7 71.4 76.8<br />
of All <strong>in</strong> Total Applicants 7.3 7.2 7.1 7.3 7.1 7.1 7.3 7.2 7.7 7.9<br />
of Alone 34.6 19.3 30.2 34.4 52.6 53.4 52.1 56.1 45.7 53.2<br />
of <strong>in</strong> Comb<strong>in</strong>ation 65.4 80.7 69.8 65.6 47.4 46.6 47.9 43.9 54.3 46.8<br />
of All <strong>in</strong> Total Applicants 0.3 0.3 0.4 0.3 0.5 0.5 0.5 0.5 0.4 0.4<br />
of Alone 89.9 89.3 89.1 88.5 89.8 89.7 89.5 89.3 88.6 87.5<br />
of <strong>in</strong> Comb<strong>in</strong>ation 10.1 10.7 10.9 11.5 10.2 10.3 10.5 10.7 11.4 12.5<br />
of All <strong>in</strong> Total Applicants 64.4 65.1 66.1 65.9 64.7 63.7 63.0 62.3 61.8 62.3<br />
of Alone 25.5 29.6 20.3 25.1 50.3 51.3 62.2 60.0 19.6 25.5<br />
of <strong>in</strong> Comb<strong>in</strong>ation 74.5 70.4 79.7 74.9 49.7 48.7 37.8 40.0 80.4 74.5<br />
of All <strong>in</strong> Total Applicants 6.2 5.9 1.5 0.5 0.4 0.4 0.3 0.2 0.1 0.1<br />
of Alone 100.0 100.0 100.0 100.0 100.0 100.0 100.0 100.0 100.0 100.0<br />
of <strong>in</strong> Comb<strong>in</strong>ation 0.0 0.0 0.0 0.0 0.0 0.0 0.0 0.0 0.0 0.0<br />
of All <strong>in</strong> Total Applicants 0.8 0.5 0.6 0.5 0.8 1.0 2.1 2.7 3.0 3.0<br />
of Alone 100.0 100.0 100.0 100.0 100.0 100.0 100.0 100.0 100.0 100.0<br />
of <strong>in</strong> Comb<strong>in</strong>ation 0.0 0.0 0.0 0.0 0.0 0.0 0.0 0.0 0.0 0.0<br />
of All <strong>in</strong> Total Applicants 2.9 2.8 2.9 3.2 3.8 4.3 4.3 3.9 4.0 3.8<br />
of Alone 89.6 89.4 90.6 91.0 92.3 92.4 92.4 92.4 91.9 91.2<br />
of <strong>in</strong> Comb<strong>in</strong>ation 10.4 10.6 9.4 9.0 7.7 7.6 7.6 7.6 8.1 8.8<br />
of All <strong>in</strong> Total Applicants 100.0 100.0 100.0 100.0 100.0 100.0 100.0 100.0 100.0 100.0<br />
*S<strong>in</strong>ce 2002, follow<strong>in</strong>g U.S. federal guidel<strong>in</strong>es, AMCAS has asked applicants who are U.S. citizens or permanent residents to self-identify us<strong>in</strong>g two<br />
separate questions: the first question ("Ethnicity") asks applicants whether they are "Spanish/Hispanic/Lat<strong>in</strong>o/Lat<strong>in</strong>a" or "Not<br />
Spanish/Hispanic/Lat<strong>in</strong>o/Lat<strong>in</strong>a"; the second question ("Race") asks applicants to self-identify us<strong>in</strong>g non-Hispanic or Lat<strong>in</strong>o race categories, and<br />
applicants are asked to "check all that apply." The ethnicity category and several race categories permit further self-identification by sub-categories.<br />
Prior to 2002, AMCAS applicants were not able to select more than one race; thus, data prior to 2002 are not directly comparable to later data.<br />
Source: <strong>AAMC</strong> public web site: https://www.aamc.org/data/facts/applicantmatriculant/ (table 14)<br />
102<br />
Association of American <strong>Medical</strong> Colleges
<strong>Diversity</strong> <strong>in</strong> <strong>Medical</strong> <strong>Education</strong>: <strong>Facts</strong> & <strong>Figures</strong> <strong>2012</strong><br />
Table 30: U.S. <strong>Medical</strong> School Applicants, First-Time Applicants, Acceptants, Matriculants,<br />
and Graduates by Gender, 2002-2011<br />
Applicants<br />
First Time<br />
Applicants<br />
Acceptants<br />
Matriculants<br />
Graduates<br />
Status / Gender<br />
Women<br />
Men<br />
Year<br />
2002 2003 2004 2005 2006 2007 2008 2009 2010 2011<br />
# 16,556 17,672 18,018 18,625 19,293 20,735 20,360 20,252 20,207 20,780<br />
% 49.2% 50.8% 50.4% 49.8% 49.3% 49.0% 48.2% 47.9% 47.3% 47.3%<br />
# 17,068 17,119 17,717 18,747 19,815 21,580 21,870 22,013 22,533 23,135<br />
% 50.8% 49.2% 49.6% 50.2% 50.7% 51.0% 51.8% 52.1% 52.7% 52.7%<br />
Total 33,624 34,791 35,735 37,372 39,108 42,315 42,230 42,265 42,740 43,915<br />
Women<br />
Men<br />
# 12,648 13,730 13,932 14,357 14,904 15,994 15,317 15,209 15,441 15,953<br />
% 50.8% 52.5% 51.2% 50.7% 50.4% 50.1% 49.4% 49.0% 48.5% 48.9%<br />
# 12,236 12,430 13,258 13,934 14,679 15,952 15,701 15,850 16,390 16,698<br />
% 49.2% 47.5% 48.8% 49.3% 49.6% 49.9% 50.6% 51.0% 51.5% 51.1%<br />
Total 24,884 26,160 27,190 28,291 29,583 31,946 31,018 31,059 31,831 32,651<br />
Women<br />
Men<br />
# 8,631 8,732 8,768 8,765 8,943 9,107 9,181 9,264 9,237 9,495<br />
% 49.1% 49.8% 49.6% 48.7% 48.6% 48.3% 48.0% 47.9% 47.0% 47.1%<br />
# 8,961 8,810 8,894 9,221 9,475 9,751 9,954 10,067 10,404 10,681<br />
% 50.9% 50.2% 50.4% 51.3% 51.4% 51.7% 52.0% 52.1% 53.0% 52.9%<br />
Total 17,592 17,542 17,662 17,986 18,418 18,858 19,135 19,331 19,641 20,176<br />
Women<br />
Men<br />
# 8,113 8,212 8,235 8,239 8,438 8,582 8,614 8,817 8,756 9,037<br />
% 49.2% 49.6% 49.5% 48.5% 48.6% 48.3% 47.8% 47.9% 46.9% 47.0%<br />
# 8,375 8,329 8,413 8,764 8,923 9,177 9,422 9,573 9,909 10193<br />
% 50.8% 50.4% 50.5% 51.5% 51.4% 51.7% 52.2% 52.1% 53.1% 53.0%<br />
Total 16,488 16,541 16,648 17,003 17,361 17,759 18,036 18,390 18,665 19,230<br />
Women<br />
Men<br />
Table 30: U.S. <strong>Medical</strong> School Applicants, First-Time Applicants, Acceptants, Matriculants, and<br />
Graduates by Gender, 2002–2011<br />
# 6,923 7,028 7,261 7,412 7,748 7,925 7,969 8,039 8,141 8,397<br />
% 44.2% 45.3% 45.9% 47.0% 48.6% 49.1% 49.3% 48.8% 48.3% 48.4%<br />
# 8,753 8,503 8,568 8,348 8,179 8,215 8,199 8,433 8,721 8,968<br />
% 55.8% 54.7% 54.1% 53.0% 51.4% 50.9% 50.7% 51.2% 51.7% 51.6%<br />
Total 15,676 15,531 15,829 15,760 15,927 16,140 16,168 16,472 16,862 17,365<br />
Note: One applicant <strong>in</strong> 2008, three <strong>in</strong> 2009, one <strong>in</strong> 2010, and four <strong>in</strong> 2011 did not report sex, therefore, they were excluded here<br />
Source: <strong>AAMC</strong> Data Warehouse: Applicant Matriculant file, and Student File, as of 3/9/<strong>2012</strong>.<br />
103<br />
Association of American <strong>Medical</strong> Colleges
Table 31: U.S. <strong>Medical</strong> School Applicants by State, <strong>Medical</strong> School, Gender, and Race and Ethnicity, 2011<br />
Table 31: U.S. <strong>Medical</strong> School Applicants by State, <strong>Medical</strong> School, Gender, and Race and Ethnicity*, 2011<br />
AL<br />
<strong>Diversity</strong> <strong>in</strong> <strong>Medical</strong> <strong>Education</strong>: <strong>Facts</strong> & <strong>Figures</strong> <strong>2012</strong><br />
Hispanic/Non-Hispanic Non-Hispanic Asians Non-Hispanic Other Races<br />
Ameri-<br />
Black can<br />
State/School/Gender** Mexi-<br />
Non<br />
or Afri- Indian Native<br />
No<br />
can Other<br />
Hispacan<br />
or Hawa-<br />
Race UnduAmeriHispa-<br />
Puerto nic or Chi- Asian Pakis- FilipiJapaKoVietna- Other Ameri- Alaska iian or Other Resplicatedcannic Cuban Rican Lat<strong>in</strong>o nese Indian tani nonesereanmese Asian can Native OPI White Race ponse Foreign Total<br />
Women 15 24 13 4 1,002 50 96 14 9 7 16 16 24 151 12 0 618 1 26 6 1,056<br />
University of Alabama<br />
School of Medic<strong>in</strong>e<br />
Men 15 31 10 5 1,389 69 108 13 12 9 25 25 37 68 12 1 1,013 0 39 3 1,449<br />
Subtotal 30 55 23 9 2,391 119 204 27 21 16 41 41 61 219 24 1 1,631 1 65 9 2,505<br />
University of South Women 10 19 4 5 548 26 56 8 5 5 8 13 13 79 4 0 319 0 15 41 586<br />
Alabama College of Men 12 6 5 1 660 29 52 7 6 3 13 21 27 40 3 1 448 0 16 29 685<br />
Medic<strong>in</strong>e<br />
Subtotal 22 25 9 6 1,208 55 108 15 11 8 21 34 40 119 7 1 767 0 31 70 1,271<br />
University of Arkansas for Women 11 24 7 6 848 48 120 21 11 15 14 38 23 91 20 0 476 0 18 7 896<br />
<strong>Medical</strong> Sciences College Men 27 28 6 2 1,181 61 111 35 13 9 23 42 51 52 18 1 776 1 29 6 1,242<br />
of Medic<strong>in</strong>e<br />
Subtotal 38 52 13 8 2,029 109 231 56 24 24 37 80 74 143 38 1 1,252 1 47 13 2,138<br />
Women 63 53 6 9 974 49 107 15 21 19 26 30 35 45 17 1 618 0 38 17 1,098<br />
University of Arizona<br />
College of Medic<strong>in</strong>e<br />
Men 74 51 5 9 1,320 94 93 24 24 17 31 39 49 39 8 0 918 0 39 12 1,457<br />
Subtotal 137 104 11 18 2,294 143 200 39 45 36 57 69 84 84 25 1 1,536 0 77 29 2,555<br />
Keck School of Medic<strong>in</strong>e of Women 133 112 21 17 2,710 476 230 24 73 76 181 133 135 130 24 2 1,260 3 120 138 2,990<br />
the University of Southern Men 144 121 14 11 3,471 522 333 52 96 73 180 158 193 130 15 2 1,773 0 140 124 3,751<br />
California<br />
Subtotal 277 233 35 28 6,181 998 563 76 169 149 361 291 328 260 39 4 3,033 3 260 262 6,741<br />
Women 84 105 26 19 2,065 230 209 36 72 43 152 104 99 181 21 1 927 1 73 136 2,298<br />
Loma L<strong>in</strong>da University<br />
School of Medic<strong>in</strong>e<br />
Men 105 96 11 10 2,546 277 210 40 67 50 146 109 128 125 13 4 1,402 0 67 147 2,764<br />
Subtotal 189 201 37 29 4,611 507 419 76 139 93 298 213 227 306 34 5 2,329 1 140 283 5,062<br />
Women 102 98 21 13 2,506 446 195 17 47 57 132 93 112 142 16 2 1,242 2 118 154 2,740<br />
Stanford University School<br />
of Medic<strong>in</strong>e<br />
Men 121 106 18 21 3,306 486 323 38 59 66 147 100 159 124 14 1 1,787 1 147 159 3,569<br />
Subtotal 223 204 39 34 5,812 932 518 55 106 123 279 193 271 266 30 3 3,029 3 265 313 6,309<br />
Women 68 52 6 9 692 84 58 10 32 15 35 42 37 129 10 0 257 1 25 18 825<br />
UCLA/Drew <strong>Medical</strong><br />
<strong>Education</strong> Program<br />
Men 69 44 3 5 654 86 57 10 30 18 38 49 46 70 3 3 252 0 28 22 768<br />
Subtotal 137 96 9 14 1,346 170 115 20 62 33 73 91 83 199 13 3 509 1 53 40 1,593<br />
Women 119 90 10 8 2,071 388 160 24 59 67 125 134 119 94 13 1 935 1 99 35 2,296<br />
University of California,<br />
Davis, School of Medic<strong>in</strong>e<br />
Men 111 76 8 4 2,343 418 222 32 71 56 128 146 139 78 8 4 1,123 0 90 37 2,533<br />
Subtotal 230 166 18 12 4,414 806 382 56 130 123 253 280 258 172 21 5 2,058 1 189 72 4,829<br />
Women 131 97 10 7 2,146 407 170 25 69 74 142 147 117 94 14 1 963 1 96 21 2,384<br />
University of California,<br />
Irv<strong>in</strong>e, School of Medic<strong>in</strong>e<br />
Men 120 99 7 10 2,435 450 204 31 82 52 129 161 144 81 10 5 1,170 0 93 24 2,660<br />
Subtotal 251 196 17 17 4,581 857 374 56 151 126 271 308 261 175 24 6 2,133 1 189 45 5,044<br />
104<br />
AR<br />
AZ<br />
CA<br />
Association of American <strong>Medical</strong> Colleges<br />
Cont<strong>in</strong>ues on next page
Table 31: Number of Applicants by State, U.S. <strong>Medical</strong> School, Gender, and Race and Ethnicity, 2011<br />
(cont<strong>in</strong>ued)<br />
Table 31: U.S. <strong>Medical</strong> School Applicants by State, <strong>Medical</strong> School, Gender, and Race and Ethnicity*, 2011 (cont<strong>in</strong>ued)<br />
<strong>Diversity</strong> <strong>in</strong> <strong>Medical</strong> <strong>Education</strong>: <strong>Facts</strong> & <strong>Figures</strong> <strong>2012</strong><br />
Hispanic/Non-Hispanic Non-Hispanic Asians Non-Hispanic Other Races<br />
Ameri-<br />
Black can<br />
State/School/Gender** Mexi-<br />
Non<br />
or Afri- Indian Native<br />
No<br />
can Other<br />
Hispacan<br />
or Hawa-<br />
Race UnduAmeriHispa-<br />
Puerto nic or Chi- Asian Pakis- FilipiJapaKoVietna- Other Ameri- Alaska iian or Other Resplicatedcannic Cuban Rican Lat<strong>in</strong>o nese Indian tani nonesereanmese Asian can Native OPI White Race ponse Foreign Total<br />
University of California, Los Women 194 151 18 20 2,933 531 246 28 90 82 177 164 159 206 26 5 1,292 3 133 87 2,956<br />
Angeles David Geffen Men 202 150 13 18 3,483 562 348 46 101 67 180 170 208 156 12 4 1,686 1 150 97 3,539<br />
School of Medic<strong>in</strong>e<br />
Subtotal 396 301 31 38 6,416 1,093 594 74 191 149 357 334 367 362 38 9 2,978 4 283 184 6,495<br />
University of California, Women 138 103 13 14 2,257 414 147 19 66 64 131 124 116 98 18 4 1,122 1 109 6 2,518<br />
San Diego School of Men 128 97 9 13 2,768 453 247 32 77 57 134 143 145 85 14 3 1,464 0 120 2 3,003<br />
Medic<strong>in</strong>e<br />
Subtotal 266 200 22 27 5,025 867 394 51 143 121 265 267 261 183 32 7 2,586 1 229 8 5,521<br />
University of California, Women 142 126 21 10 2,994 500 216 25 63 80 145 138 147 152 21 3 1,549 4 141 70 3,153<br />
San Francisco, School of Men 139 111 14 14 3,498 542 319 36 74 79 164 143 167 125 16 3 1,875 1 155 97 3,641<br />
Medic<strong>in</strong>e<br />
Subtotal 281 237 35 24 6,492 1,042 535 61 137 159 309 281 314 277 37 6 3,424 5 296 167 6,794<br />
Women 71 61 15 9 1,878 115 86 13 27 36 53 52 37 62 25 0 1,394 0 57 43 2,029<br />
University of Colorado<br />
School of Medic<strong>in</strong>e<br />
Men 85 73 5 10 2,351 119 111 17 26 21 37 43 67 41 27 2 1,860 0 66 39 2,520<br />
Subtotal 156 134 20 19 4,229 234 197 30 53 57 90 95 104 103 52 2 3,254 0 123 82 4,549<br />
Women 18 52 14 16 1,391 115 154 23 20 11 34 24 53 148 15 0 745 1 56 131 1,488<br />
University of Connecticut<br />
School of Medic<strong>in</strong>e<br />
Men 21 46 5 13 1,357 121 138 35 28 8 37 28 47 75 8 1 776 0 58 139 1,442<br />
Subtotal 39 98 19 29 2,748 236 292 58 48 19 71 52 100 223 23 1 1,521 1 114 270 2,930<br />
Women 36 68 25 13 1,930 332 152 20 9 29 110 38 77 166 10 0 937 2 85 166 2,071<br />
Yale University School of<br />
Medic<strong>in</strong>e<br />
Men 61 77 17 14 2,521 327 287 39 26 33 112 48 108 126 18 1 1,343 1 115 198 2,691<br />
Subtotal 97 145 42 27 4,451 659 439 59 35 62 222 86 185 292 28 1 2,280 3 200 364 4,762<br />
George Wash<strong>in</strong>gton Women 138 240 72 52 6,650 590 688 107 101 91 298 199 247 628 33 4 3,632 4 257 249 7,128<br />
University School of<br />
Men 121 201 56 47 6,956 579 783 157 118 65 259 194 281 330 42 3 4,147 2 211 271 7,364<br />
Medic<strong>in</strong>e and Health<br />
Sciences<br />
Subtotal 259 441 128 99 13,606 1,169 1,471 264 219 156 557 393 528 958 75 7 7,779 6 468 520 14,492<br />
Women 100 182 58 33 4,973 537 461 61 64 76 243 136 173 382 16 2 2,779 3 198 203 5,333<br />
Georgetown University<br />
School of Medic<strong>in</strong>e<br />
Men 103 170 38 28 5,934 588 598 122 97 69 234 145 226 238 33 3 3,579 1 192 230 6,265<br />
Subtotal 203 352 96 61 10,907 1,125 1,059 183 161 145 477 281 399 620 49 5 6,358 4 390 433 11,598<br />
Women 94 193 43 48 3,241 180 410 88 53 28 76 118 149 1,332 19 1 746 5 65 230 3,598<br />
Howard University College<br />
of Medic<strong>in</strong>e<br />
Men 76 125 27 29 2,649 164 397 118 47 23 83 82 150 697 20 3 822 1 66 214 2,898<br />
Subtotal 170 318 70 77 5,890 344 807 206 100 51 159 200 299 2,029 39 4 1,568 6 131 444 6,496<br />
Charles E. Schmidt College Women 8 60 28 13 559 31 82 10 10 3 14 13 22 86 1 0 294 1 20 1 662<br />
of Medic<strong>in</strong>e at Florida Men 6 48 39 10 741 36 76 19 14 5 11 15 27 54 2 0 483 0 23 2 837<br />
Atlantic University<br />
Subtotal 14 108 67 23 1,300 67 158 29 24 8 25 28 49 140 3 0 777 1 43 3 1,499<br />
105<br />
CO<br />
CT<br />
DC<br />
Cont<strong>in</strong>ues on next page<br />
Association of American <strong>Medical</strong> Colleges
Table 31: Number of Applicants by State, U.S. <strong>Medical</strong> School, Gender, and Race and Ethnicity, 2011<br />
(cont<strong>in</strong>ued)<br />
Table 31: U.S. <strong>Medical</strong> School Applicants by State, <strong>Medical</strong> School, Gender, and Race and Ethnicity*, 2011 (cont<strong>in</strong>ued)<br />
<strong>Diversity</strong> <strong>in</strong> <strong>Medical</strong> <strong>Education</strong>: <strong>Facts</strong> & <strong>Figures</strong> <strong>2012</strong><br />
Hispanic/Non-Hispanic Non-Hispanic Asians Non-Hispanic Other Races<br />
Ameri-<br />
Black can<br />
State/School/Gender** Mexi-<br />
Non<br />
or Afri- Indian Native<br />
No<br />
can Other<br />
Hispacan<br />
or Hawa-<br />
Race UnduAmeriHispa-<br />
Puerto nic or Chi- Asian Pakis- FilipiJapaKoVietna- Other Ameri- Alaska iian or Other Resplicatedcannic Cuban Rican Lat<strong>in</strong>o nese Indian tani nonesereanmese Asian can Native OPI White Race ponse Foreign Total<br />
Florida International Women 25 150 107 32 1,508 89 195 45 34 16 37 41 71 219 5 1 771 1 37 58 1,795<br />
University Herbert<br />
Men 26 129 89 20 1,690 97 222 53 37 10 31 48 82 133 8 1 982 1 42 68 1,938<br />
Wertheim College of<br />
Medic<strong>in</strong>e<br />
Subtotal 51 279 196 52 3,198 186 417 98 71 26 68 89 153 352 13 2 1,753 2 79 126 3,733<br />
Women 35 175 96 45 1,624 77 178 36 40 13 24 54 74 273 9 0 889 1 34 16 1,947<br />
Florida State University<br />
College of Medic<strong>in</strong>e<br />
Men 27 128 81 26 1,731 71 169 49 30 10 23 47 65 152 11 2 1,121 0 47 14 1,980<br />
Subtotal 62 303 177 71 3,355 148 347 85 70 23 47 101 139 425 20 2 2,010 1 81 30 3,927<br />
Women 15 143 91 34 1,169 49 117 28 21 6 22 30 40 166 7 0 719 1 34 4 1,430<br />
USF Health Morsani<br />
College of Medic<strong>in</strong>e<br />
Men 16 115 77 26 1,376 68 141 35 22 7 17 29 58 102 10 1 908 0 45 10 1,595<br />
Subtotal 31 258 168 60 2,545 117 258 63 43 13 39 59 98 268 17 1 1,627 1 79 14 3,025<br />
Women 21 144 89 38 1,310 62 145 32 27 11 33 39 53 175 7 0 753 2 37 7 1,580<br />
University of Central<br />
Florida College of Medic<strong>in</strong>e<br />
Men 21 121 77 27 1,520 78 161 43 30 11 20 41 60 118 11 1 973 1 43 9 1,749<br />
Subtotal 42 265 166 65 2,830 140 306 75 57 22 53 80 113 293 18 1 1,726 3 80 16 3,329<br />
Women 15 117 77 28 1,067 51 107 21 28 6 15 29 41 163 11 0 627 1 37 7 1,286<br />
University of Florida<br />
College of Medic<strong>in</strong>e<br />
Men 23 113 71 20 1,293 65 117 35 15 6 19 32 49 94 9 1 857 0 46 12 1,508<br />
Subtotal 38 230 148 48 2,360 116 224 56 43 12 34 61 90 257 20 1 1,484 1 83 19 2,794<br />
University of Miami Women 52 185 116 44 2,209 166 233 44 41 25 66 61 67 256 13 0 1,273 2 88 11 2,576<br />
Leonard M. Miller School of Men 59 185 91 38 2,963 214 312 70 43 24 63 81 118 170 18 1 1,882 0 110 12 3,316<br />
Medic<strong>in</strong>e<br />
Subtotal 111 370 207 82 5,172 380 545 114 84 49 129 142 185 426 31 1 3,155 2 198 23 5,892<br />
Women 59 88 35 29 2,848 307 255 36 25 33 122 49 96 447 16 1 1,434 2 103 157 3,054<br />
Emory University School of<br />
Medic<strong>in</strong>e<br />
Men 66 88 24 24 3,189 288 380 45 33 34 116 60 119 202 25 1 1,859 1 119 154 3,388<br />
Subtotal 125 176 59 53 6,037 595 635 81 58 67 238 109 215 649 41 2 3,293 3 222 311 6,442<br />
<strong>Medical</strong> College of Georgia Women 15 38 9 14 956 52 97 24 12 8 30 27 33 208 5 0 480 0 17 37 1,030<br />
at Georgia Health Sciences Men 11 29 11 5 1,038 53 110 23 9 3 17 23 48 92 7 1 648 0 26 34 1,095<br />
University<br />
Subtotal 26 67 20 19 1,994 105 207 47 21 11 47 50 81 300 12 1 1,128 0 43 71 2,125<br />
Women 4 11 1 6 386 11 31 6 5 3 15 14 6 109 0 0 190 0 8 2 408<br />
Mercer University School of<br />
Medic<strong>in</strong>e<br />
Men 2 7 2 1 404 12 46 5 0 1 7 5 13 47 2 0 267 0 11 2 416<br />
Subtotal 6 18 3 7 790 23 77 11 5 4 22 19 19 156 2 0 457 0 19 4 824<br />
Women 45 111 29 25 2,151 67 246 54 33 14 43 65 98 1,091 8 0 456 1 43 10 2,350<br />
Morehouse School of<br />
Medic<strong>in</strong>e<br />
Men 35 82 18 20 1,671 71 228 64 28 11 37 63 96 556 5 3 531 0 33 12 1,816<br />
Subtotal 80 193 47 45 3,822 138 474 118 61 25 80 128 194 1,647 13 3 987 1 76 22 4,166<br />
106<br />
FL<br />
GA<br />
Association of American <strong>Medical</strong> Colleges<br />
Cont<strong>in</strong>ues on next page
Table 31: Number of Applicants by State, U.S. <strong>Medical</strong> School, Gender, and Race and Ethnicity, 2011<br />
(cont<strong>in</strong>ued)<br />
Table 31: U.S. <strong>Medical</strong> School Applicants by State, <strong>Medical</strong> School, Gender, and Race and Ethnicity*, 2011 (cont<strong>in</strong>ued)<br />
<strong>Diversity</strong> <strong>in</strong> <strong>Medical</strong> <strong>Education</strong>: <strong>Facts</strong> & <strong>Figures</strong> <strong>2012</strong><br />
Hispanic/Non-Hispanic Non-Hispanic Asians Non-Hispanic Other Races<br />
Ameri-<br />
Black can<br />
State/School/Gender** Mexi-<br />
Non<br />
or Afri- Indian Native<br />
No<br />
can Other<br />
Hispacan<br />
or Hawa-<br />
Race UnduAmeriHispa-<br />
Puerto nic or Chi- Asian Pakis- FilipiJapaKoVietna- Other Ameri- Alaska iian or Other Resplicatedcannic Cuban Rican Lat<strong>in</strong>o nese Indian tani nonesereanmese Asian can Native OPI White Race ponse Foreign Total<br />
University of Hawaii, John Women 17 26 3 7 687 110 43 11 36 74 42 32 34 22 13 2 310 0 26 52 739<br />
A. Burns School of Men 28 29 3 4 851 116 80 10 47 63 38 36 43 28 10 2 410 0 34 75 914<br />
Medic<strong>in</strong>e<br />
Subtotal 45 55 6 11 1,538 226 123 21 83 137 80 68 77 50 23 4 720 0 60 127 1,653<br />
University of Iowa Roy J. Women 50 36 8 10 1,369 95 109 18 15 20 37 25 42 138 8 0 884 1 43 2 1,469<br />
and Lucille A. Carver Men 67 44 6 10 1,962 122 139 31 25 15 44 53 58 86 10 2 1,377 0 68 2 2,085<br />
College of Medic<strong>in</strong>e<br />
Subtotal 117 80 14 20 3,331 217 248 49 40 35 81 78 100 224 18 2 2,261 1 111 4 3,554<br />
Chicago <strong>Medical</strong> School at Women 96 139 42 19 4,652 426 570 100 85 66 235 146 185 282 22 3 2,460 5 145 333 4,941<br />
Rosal<strong>in</strong>d Frankl<strong>in</strong><br />
Men 95 115 35 21 4,941 461 644 107 81 46 207 175 215 132 20 3 2,800 0 135 333 5,200<br />
University of Medic<strong>in</strong>e &<br />
Science<br />
Subtotal 191 254 77 40 9,593 887 1,214 207 166 112 442 321 400 414 42 6 5,260 5 280 666 10,141<br />
Women 93 125 45 22 4,374 313 424 74 89 65 188 118 136 236 19 4 2,782 3 142 4 4,639<br />
Loyola University Chicago<br />
Stritch School of Medic<strong>in</strong>e<br />
Men 113 116 27 26 4,944 350 504 89 80 48 171 121 173 148 16 2 3,278 0 152 8 5,206<br />
Subtotal 206 241 72 48 9,318 663 928 163 169 113 359 239 309 384 35 6 6,060 3 294 12 9,845<br />
Northwestern University Women 109 115 31 20 2,696 367 222 30 30 34 133 56 92 208 16 4 1,483 2 98 171 2,959<br />
The Fe<strong>in</strong>berg School of Men 109 107 21 27 3,321 344 372 60 37 38 138 67 126 150 24 1 1,925 2 126 177 3,579<br />
Medic<strong>in</strong>e<br />
Subtotal 218 222 52 47 6,017 711 594 90 67 72 271 123 218 358 40 5 3,408 4 224 348 6,538<br />
Rush <strong>Medical</strong> College of Women 72 94 30 11 3,224 278 381 61 59 40 160 86 105 150 21 2 1,944 2 112 16 3,417<br />
Rush University <strong>Medical</strong> Men 69 86 21 19 3,430 251 383 79 68 27 138 93 151 97 12 2 2,177 0 100 15 3,614<br />
Center<br />
Subtotal 141 180 51 30 6,654 529 764 140 127 67 298 179 256 247 33 4 4,121 2 212 31 7,031<br />
Women 15 16 1 0 559 34 73 17 10 5 24 7 11 66 4 0 329 1 9 0 590<br />
Southern Ill<strong>in</strong>ois University<br />
School of Medic<strong>in</strong>e<br />
Men 16 17 2 4 613 14 91 18 12 1 18 4 18 42 0 0 392 0 15 3 648<br />
Subtotal 31 33 3 4 1,172 48 164 35 22 6 42 11 29 108 4 0 721 1 24 3 1,238<br />
University of Chicago Women 43 72 19 7 2,260 326 221 29 22 29 112 45 84 189 9 2 1,146 1 98 143 2,397<br />
Division of the Biological<br />
Men 71 73 13 21 2,763 311 330 43 31 34 123 52 97 110 12 1 1,576 0 104 161 2,943<br />
Sciences The Pritzker<br />
School of Medic<strong>in</strong>e Subtotal 114 145 32 28 5,023 637 551 72 53 63 235 97 181 299 21 3 2,722 1 202 304 5,340<br />
Women 108 141 43 21 3,428 288 423 78 62 45 158 94 110 384 20 3 1,823 3 107 7 3,727<br />
University of Ill<strong>in</strong>ois College<br />
of Medic<strong>in</strong>e<br />
Men 115 123 21 14 3,934 328 474 92 67 30 145 129 148 213 18 2 2,340 1 117 5 4,193<br />
Subtotal 223 264 64 35 7,362 616 897 170 129 75 303 223 258 597 38 5 4,163 4 224 12 7,920<br />
Women 21 45 13 10 1,501 100 143 25 21 12 44 26 52 165 12 1 899 0 29 94 1,591<br />
Indiana University School<br />
of Medic<strong>in</strong>e<br />
Men 41 40 7 9 1,983 141 184 42 30 7 54 38 73 110 10 1 1,241 0 67 122 2,078<br />
Subtotal 62 85 20 19 3,484 241 327 67 51 19 98 64 125 275 22 2 2,140 0 96 216 3,669<br />
HI<br />
107<br />
IA<br />
IL<br />
IN<br />
Cont<strong>in</strong>ues on next page<br />
Association of American <strong>Medical</strong> Colleges
Table 31: Number of Applicants by State, U.S. <strong>Medical</strong> School, Gender, and Race and Ethnicity, 2011<br />
(cont<strong>in</strong>ued)<br />
Table 31: U.S. <strong>Medical</strong> School Applicants by State, <strong>Medical</strong> School, Gender, and Race and Ethnicity*, 2011 (cont<strong>in</strong>ued)<br />
<strong>Diversity</strong> <strong>in</strong> <strong>Medical</strong> <strong>Education</strong>: <strong>Facts</strong> & <strong>Figures</strong> <strong>2012</strong><br />
Hispanic/Non-Hispanic Non-Hispanic Asians Non-Hispanic Other Races<br />
Ameri-<br />
Black can<br />
State/School/Gender** Mexi-<br />
Non<br />
or Afri- Indian Native<br />
No<br />
can Other<br />
Hispacan<br />
or Hawa-<br />
Race UnduAmeriHispa-<br />
Puerto nic or Chi- Asian Pakis- FilipiJapaKoVietna- Other Ameri- Alaska iian or Other Resplicatedcannic Cuban Rican Lat<strong>in</strong>o nese Indian tani nonesereanmese Asian can Native OPI White Race ponse Foreign Total<br />
Women 27 29 12 8 1,019 52 120 22 14 9 23 42 36 109 17 0 610 0 24 1 1,092<br />
University of Kansas<br />
School of Medic<strong>in</strong>e<br />
Men 35 36 9 5 1,344 64 98 24 19 10 20 49 49 68 18 1 933 1 37 4 1,426<br />
Subtotal 62 65 21 13 2,363 116 218 46 33 19 43 91 85 177 35 1 1,543 1 61 5 2,518<br />
Women 6 21 6 3 865 49 87 11 5 5 17 9 28 55 7 0 581 0 17 69 905<br />
University of Kentucky<br />
College of Medic<strong>in</strong>e<br />
Men 18 23 4 4 1,173 67 107 19 12 5 27 28 39 25 7 1 803 0 27 103 1,222<br />
Subtotal 24 44 10 7 2,038 116 194 30 17 10 44 37 67 80 14 1 1,384 0 44 172 2,127<br />
Women 14 29 14 5 1,202 50 143 11 11 13 28 22 34 129 9 0 764 1 30 14 1,262<br />
University of Louisville<br />
School of Medic<strong>in</strong>e<br />
Men 25 30 12 5 1,544 72 133 25 19 6 35 40 54 69 13 1 1,088 0 29 24 1,614<br />
Subtotal 39 59 26 10 2,746 122 276 36 30 19 63 62 88 198 22 1 1,852 1 59 38 2,876<br />
Louisiana State University Women 6 31 10 5 604 22 52 7 11 4 9 33 9 106 7 0 352 0 10 8 652<br />
School of Medic<strong>in</strong>e <strong>in</strong> New Men 5 27 7 2 711 42 54 9 10 4 17 21 20 47 4 0 496 0 14 7 750<br />
Orleans<br />
Subtotal 11 58 17 7 1,315 64 106 16 21 8 26 54 29 153 11 0 848 0 24 15 1,402<br />
Louisiana State University Women 3 15 2 2 340 8 22 4 6 0 4 20 7 64 2 0 207 0 5 1 361<br />
School of Medic<strong>in</strong>e <strong>in</strong> Men 5 10 2 2 425 15 30 10 5 1 7 10 8 19 2 0 322 0 8 4 442<br />
Shreveport<br />
Subtotal 8 25 4 4 765 23 52 14 11 1 11 30 15 83 4 0 529 0 13 5 803<br />
Women 94 164 55 32 4,491 365 444 77 79 67 172 140 153 383 29 3 2,590 1 155 142 4,825<br />
Tulane University School of<br />
Medic<strong>in</strong>e<br />
Men 99 151 43 22 5,088 409 526 98 82 39 168 159 200 181 23 2 3,202 0 162 171 5,395<br />
Subtotal 193 315 98 54 9,579 774 970 175 161 106 340 299 353 564 52 5 5,792 1 317 313 10,220<br />
Women 102 163 58 43 5,080 602 480 57 65 89 234 147 181 279 23 4 2,834 4 206 305 5,431<br />
Boston University School of<br />
Medic<strong>in</strong>e<br />
Men 111 181 30 34 5,513 606 576 96 67 65 235 142 223 145 32 3 3,246 3 192 323 5,868<br />
Subtotal 213 344 88 77 10,593 1,208 1,056 153 132 154 469 289 404 424 55 7 6,080 7 398 628 11,299<br />
Women 72 106 33 33 2,402 356 175 18 29 37 131 47 107 283 18 3 1,155 3 100 176 2,642<br />
Harvard <strong>Medical</strong> School Men 123 154 22 27 3,322 366 354 44 32 38 132 58 139 230 25 1 1,816 2 153 224 3,648<br />
Subtotal 195 260 55 60 5,724 722 529 62 61 75 263 105 246 513 43 4 2,971 5 253 400 6,290<br />
Women 73 121 37 21 3,953 477 384 46 51 62 196 109 135 172 16 4 2,270 3 176 132 4,193<br />
Tufts University School of<br />
Medic<strong>in</strong>e<br />
Men 86 134 23 27 4,346 488 434 74 59 47 181 118 190 99 21 2 2,633 1 165 127 4,614<br />
Subtotal 159 255 60 48 8,299 965 818 120 110 109 377 227 325 271 37 6 4,903 4 341 259 8,807<br />
University of<br />
Women 2 5 2 2 467 39 36 2 1 4 8 8 12 23 1 0 326 1 27 1 475<br />
Massachusetts <strong>Medical</strong> Men 2 13 0 2 480 37 43 6 0 3 14 9 17 14 3 0 333 0 16 6 497<br />
School<br />
Subtotal 4 18 2 4 947 76 79 8 1 7 22 17 29 37 4 0 659 1 43 7 972<br />
KS<br />
108<br />
KY<br />
LA<br />
MA<br />
Association of American <strong>Medical</strong> Colleges<br />
Cont<strong>in</strong>ues on next page
Table 31: Number of Applicants by State, U.S. <strong>Medical</strong> School, Gender, and Race and Ethnicity, 2011<br />
(cont<strong>in</strong>ued)<br />
Table 31: U.S. <strong>Medical</strong> School Applicants by State, <strong>Medical</strong> School, Gender, and Race and Ethnicity*, 2011 (cont<strong>in</strong>ued)<br />
<strong>Diversity</strong> <strong>in</strong> <strong>Medical</strong> <strong>Education</strong>: <strong>Facts</strong> & <strong>Figures</strong> <strong>2012</strong><br />
Hispanic/Non-Hispanic Non-Hispanic Asians Non-Hispanic Other Races<br />
Ameri-<br />
Black can<br />
State/School/Gender** Mexi-<br />
Non<br />
or Afri- Indian Native<br />
No<br />
can Other<br />
Hispacan<br />
or Hawa-<br />
Race UnduAmeriHispa-<br />
Puerto nic or Chi- Asian Pakis- FilipiJapaKoVietna- Other Ameri- Alaska iian or Other Resplicatedcannic Cuban Rican Lat<strong>in</strong>o nese Indian tani nonesereanmese Asian can Native OPI White Race ponse Foreign Total<br />
Women 50 81 21 18 2,253 320 197 18 17 25 110 41 74 278 6 0 1,105 3 100 142 2,419<br />
Johns Hopk<strong>in</strong>s University<br />
School of Medic<strong>in</strong>e<br />
Men 78 101 22 16 3,171 329 343 52 38 34 131 67 122 201 22 0 1,769 2 139 163 3,380<br />
Subtotal 128 182 43 34 5,424 649 540 70 55 59 241 108 196 479 28 0 2,874 5 239 305 5,799<br />
Uniformed Services Women 23 52 8 14 815 50 51 10 28 5 43 26 31 90 6 0 498 0 28 1 906<br />
University of the Health<br />
Men 43 56 8 17 1,523 111 82 12 29 10 56 39 35 70 21 2 1,067 0 47 1 1,639<br />
Sciences F. Edward Hebert<br />
School of Medic<strong>in</strong>e Subtotal 66 108 16 31 2,338 161 133 22 57 15 99 65 66 160 27 2 1,565 0 75 2 2,545<br />
Women 34 62 14 14 2,255 194 228 38 24 29 92 57 80 324 11 1 1,164 3 87 99 2,377<br />
University of Maryland<br />
School of Medic<strong>in</strong>e<br />
Men 31 55 9 13 2,327 240 241 57 38 21 90 53 94 147 9 1 1,298 1 89 105 2,430<br />
Subtotal 65 117 23 27 4,582 434 469 95 62 50 182 110 174 471 20 2 2,462 4 176 204 4,807<br />
Women 73 93 23 18 2,584 225 328 58 52 34 89 83 123 234 15 2 1,352 1 73 131 2,785<br />
Michigan State University<br />
College of Human Medic<strong>in</strong>e<br />
Men 78 83 22 14 3,313 268 381 77 53 29 114 100 125 136 14 1 1,970 2 100 177 3,502<br />
Subtotal 151 176 45 32 5,897 493 709 135 105 63 203 183 248 370 29 3 3,322 3 173 308 6,287<br />
Oakland University William Women 18 32 8 3 1,376 89 166 42 33 11 46 35 68 108 6 1 771 1 43 47 1,439<br />
Beaumont School of Men 26 35 6 3 1,685 100 227 49 27 8 49 32 72 73 7 1 1,016 1 58 61 1,754<br />
Medic<strong>in</strong>e<br />
Subtotal 44 67 14 6 3,061 189 393 91 60 19 95 67 140 181 13 2 1,787 2 101 108 3,193<br />
Women 54 65 11 10 2,153 283 187 29 35 25 96 47 71 155 13 3 1,244 2 71 28 2,287<br />
University of Michigan<br />
<strong>Medical</strong> School<br />
Men 68 61 13 18 2,825 275 305 47 26 26 107 61 103 121 10 2 1,731 0 125 21 2,980<br />
Subtotal 122 126 24 28 4,978 558 492 76 61 51 203 108 174 276 23 5 2,975 2 196 49 5,267<br />
Women 23 48 8 11 1,770 146 246 47 25 13 55 33 93 225 8 1 818 1 32 232 1,859<br />
Wayne State University<br />
School of Medic<strong>in</strong>e<br />
Men 25 33 7 3 2,205 176 309 65 33 10 78 53 103 113 6 2 1,155 1 64 263 2,276<br />
Subtotal 48 81 15 14 3,975 322 555 112 58 23 133 86 196 338 14 3 1,973 2 96 495 4,135<br />
Women 29 32 15 3 1,660 210 122 17 14 24 57 37 63 102 9 1 956 1 71 116 1,739<br />
Mayo <strong>Medical</strong> School Men 38 53 8 7 2,185 205 197 26 18 28 80 46 92 70 11 0 1,357 1 96 132 2,291<br />
Subtotal 67 85 23 10 3,845 415 319 43 32 52 137 83 155 172 20 1 2,313 2 167 248 4,030<br />
Women 28 34 13 6 1,731 125 123 24 23 20 45 42 58 102 20 1 1,105 0 47 154 1,816<br />
University of M<strong>in</strong>nesota<br />
<strong>Medical</strong> School<br />
Men 40 42 4 4 2,144 135 149 31 22 20 71 41 76 79 22 1 1,460 1 56 143 2,236<br />
Subtotal 68 76 17 10 3,875 260 272 55 45 40 116 83 134 181 42 2 2,565 1 103 297 4,052<br />
Women 42 49 26 12 2,588 249 287 37 42 45 92 84 92 157 26 4 1,483 2 71 141 2,721<br />
Sa<strong>in</strong>t Louis University<br />
School of Medic<strong>in</strong>e<br />
Men 60 65 11 13 3,510 305 322 58 56 37 108 113 140 92 24 1 2,249 0 95 165 3,661<br />
Subtotal 102 114 37 25 6,098 554 609 95 98 82 200 197 232 249 50 5 3,732 2 166 306 6,382<br />
109<br />
MD<br />
MI<br />
MN<br />
Cont<strong>in</strong>ues on next page<br />
Association of American <strong>Medical</strong> Colleges
Table 31: Number of Applicants by State, U.S. <strong>Medical</strong> School, Gender, and Race and Ethnicity, 2011<br />
(cont<strong>in</strong>ued)<br />
Table 31: U.S. <strong>Medical</strong> School Applicants by State, <strong>Medical</strong> School, Gender, and Race and Ethnicity*, 2011 (cont<strong>in</strong>ued)<br />
<strong>Diversity</strong> <strong>in</strong> <strong>Medical</strong> <strong>Education</strong>: <strong>Facts</strong> & <strong>Figures</strong> <strong>2012</strong><br />
Hispanic/Non-Hispanic Non-Hispanic Asians Non-Hispanic Other Races<br />
Ameri-<br />
Black can<br />
State/School/Gender** Mexi-<br />
Non<br />
or Afri- Indian Native<br />
No<br />
can Other<br />
Hispacan<br />
or Hawa-<br />
Race UnduAmeriHispa-<br />
Puerto nic or Chi- Asian Pakis- FilipiJapaKoVietna- Other Ameri- Alaska iian or Other Resplicatedcannic Cuban Rican Lat<strong>in</strong>o nese Indian tani nonesereanmese Asian can Native OPI White Race ponse Foreign Total<br />
University of Missouri- Women 12 17 4 2 693 36 73 18 9 6 9 16 10 69 11 0 445 0 22 3 726<br />
Columbia School of Men 22 31 8 6 869 42 64 18 10 6 20 32 27 31 15 1 618 1 22 7 932<br />
Medic<strong>in</strong>e<br />
Subtotal 34 48 12 8 1,562 78 137 36 19 12 29 48 37 100 26 1 1,063 1 44 10 1,658<br />
University of Missouri- Women 0 2 0 0 65 0 1 1 0 0 0 0 32 2 1 0 20 0 8 0 67<br />
Kansas City School of Men 0 1 0 0 47 0 2 0 0 0 0 0 11 5 0 0 21 0 8 0 48<br />
Medic<strong>in</strong>e<br />
Subtotal 0 3 0 0 112 0 3 1 0 0 0 0 43 7 1 0 41 0 16 0 115<br />
Wash<strong>in</strong>gton University <strong>in</strong> Women 56 34 17 10 1,525 262 121 13 11 15 64 29 52 152 9 2 769 1 55 131 1,639<br />
St. Louis School of Men 64 54 16 15 2,215 282 220 31 18 21 81 52 87 120 17 0 1,231 0 92 161 2,359<br />
Medic<strong>in</strong>e<br />
Subtotal 120 88 33 25 3,740 544 341 44 29 36 145 81 139 272 26 2 2,000 1 147 292 3,998<br />
Women 0 2 0 2 139 4 6 1 1 0 3 2 0 38 0 0 84 0 1 0 143<br />
University of Mississippi<br />
School of Medic<strong>in</strong>e<br />
Men 2 0 0 1 190 1 7 0 1 1 2 6 2 15 1 0 155 0 4 0 193<br />
Subtotal 2 2 0 3 329 5 13 1 2 1 5 8 2 53 1 0 239 0 5 0 336<br />
Women 36 60 19 23 1,871 284 170 16 14 24 70 37 61 193 9 0 954 2 67 119 2,003<br />
Duke University School of<br />
Medic<strong>in</strong>e<br />
Men 46 60 17 9 2,444 273 270 34 21 33 93 45 107 127 18 0 1,393 1 99 126 2,578<br />
Subtotal 82 120 36 32 4,315 557 440 50 35 57 163 82 168 320 27 0 2,347 3 166 245 4,581<br />
The Brody School of Women 3 10 2 0 374 16 35 5 2 1 5 3 6 72 6 0 228 0 9 3 389<br />
Medic<strong>in</strong>e at East Carol<strong>in</strong>a Men 2 5 2 1 452 13 35 4 2 3 7 3 8 38 6 0 341 0 10 0 462<br />
University<br />
Subtotal 5 15 4 1 826 29 70 9 4 4 12 6 14 110 12 0 569 0 19 3 851<br />
University of North Carol<strong>in</strong>a Women 33 67 26 17 2,096 145 172 20 24 26 51 26 60 272 16 0 1,286 0 74 55 2,240<br />
at Chapel Hill School of Men 35 73 20 9 2,347 168 203 29 22 20 55 33 73 137 19 1 1,595 0 81 83 2,480<br />
Medic<strong>in</strong>e<br />
Subtotal 68 140 46 26 4,443 313 375 49 46 46 106 59 133 409 35 1 2,881 0 155 138 4,720<br />
Wake Forest School of Women 50 83 32 29 3,134 205 264 36 28 40 115 66 92 313 11 1 1,931 2 128 69 3,321<br />
Medic<strong>in</strong>e of Wake Forest Men 56 89 23 24 3,881 302 311 53 41 38 103 87 129 193 28 2 2,622 0 116 80 4,069<br />
Baptist <strong>Medical</strong> Center<br />
Subtotal 106 172 55 53 7,015 507 575 89 69 78 218 153 221 506 39 3 4,553 2 244 149 7,390<br />
University of North Dakota Women 1 0 0 0 135 2 2 0 1 1 0 0 1 4 12 0 117 0 1 0 136<br />
School of Medic<strong>in</strong>e and Men 0 2 0 0 156 2 1 0 2 0 0 1 2 2 6 0 138 0 4 0 158<br />
Health Sciences<br />
Subtotal 1 2 0 0 291 4 3 0 3 1 0 1 3 6 18 0 255 0 5 0 294<br />
MO<br />
110<br />
MS<br />
NC<br />
ND<br />
Association of American <strong>Medical</strong> Colleges<br />
Cont<strong>in</strong>ues on next page
Table 31: Number of Applicants by State, U.S. <strong>Medical</strong> School, Gender, and Race and Ethnicity, 2011<br />
(cont<strong>in</strong>ued)<br />
Table 31: U.S. <strong>Medical</strong> School Applicants by State, <strong>Medical</strong> School, Gender, and Race and Ethnicity*, 2011 (cont<strong>in</strong>ued)<br />
<strong>Diversity</strong> <strong>in</strong> <strong>Medical</strong> <strong>Education</strong>: <strong>Facts</strong> & <strong>Figures</strong> <strong>2012</strong><br />
Hispanic/Non-Hispanic Non-Hispanic Asians Non-Hispanic Other Races<br />
Ameri-<br />
Black can<br />
State/School/Gender** Mexi-<br />
Non<br />
or Afri- Indian Native<br />
No<br />
can Other<br />
Hispacan<br />
or Hawa-<br />
Race UnduAmeriHispa-<br />
Puerto nic or Chi- Asian Pakis- FilipiJapaKoVietna- Other Ameri- Alaska iian or Other Resplicatedcannic Cuban Rican Lat<strong>in</strong>o nese Indian tani nonesereanmese Asian can Native OPI White Race ponse Foreign Total<br />
Women 40 57 12 12 2,384 171 229 30 44 58 85 76 80 103 23 1 1,519 1 78 56 2,497<br />
Creighton University<br />
School of Medic<strong>in</strong>e<br />
Men 77 69 20 8 3,304 221 278 51 46 42 95 119 98 61 14 2 2,275 0 103 48 3,475<br />
Subtotal 117 126 32 20 5,688 392 507 81 90 100 180 195 178 164 37 3 3,794 1 181 104 5,972<br />
NE<br />
Women 11 15 6 6 597 30 56 9 12 10 12 15 16 37 6 0 405 0 14 7 632<br />
University of Nebraska<br />
College of Medic<strong>in</strong>e<br />
Men 20 14 5 2 851 59 56 13 14 6 13 21 32 25 3 1 602 1 28 8 893<br />
Subtotal 31 29 11 8 1,448 89 112 22 26 16 25 36 48 62 9 1 1,007 1 42 15 1,525<br />
Women 36 55 21 8 2,307 307 206 17 21 44 119 55 87 86 18 1 1,277 2 98 226 2,426<br />
NH Dartmouth <strong>Medical</strong> School Men 49 83 8 11 2,668 288 256 49 30 32 113 59 104 73 22 0 1,543 1 113 268 2,822<br />
Subtotal 85 138 29 19 4,975 595 462 66 51 76 232 114 191 159 40 1 2,820 3 211 494 5,248<br />
University of Medic<strong>in</strong>e and Women 18 91 23 15 1,471 106 234 33 29 12 63 21 58 252 4 1 638 1 72 10 1,604<br />
Dentistry of New Jersey- Men 13 69 15 21 1,536 134 229 53 46 6 61 31 83 90 7 1 787 0 63 16 1,649<br />
New Jersey <strong>Medical</strong> School<br />
Subtotal 31 160 38 36 3,007 240 463 86 75 18 124 52 141 342 11 2 1,425 1 135 26 3,253<br />
NJ<br />
University of Medic<strong>in</strong>e and Women 22 70 20 22 1,468 113 206 26 26 14 65 18 63 241 6 2 673 1 74 17 1,590<br />
Dentistry of New Jersey-<br />
Men 16 64 11 18 1,478 135 219 53 34 8 57 28 72 95 6 2 761 0 60 13 1,585<br />
Robert Wood Johnson<br />
<strong>Medical</strong> School<br />
Subtotal 38 134 31 40 2,946 248 425 79 60 22 122 46 135 336 12 4 1,434 1 134 30 3,175<br />
Women 35 33 3 3 327 9 32 6 4 4 7 16 9 23 14 0 201 0 16 4 396<br />
University of New Mexico<br />
NM<br />
School of Medic<strong>in</strong>e<br />
Men 42 24 4 3 341 15 25 7 9 1 4 11 16 14 4 0 243 0 8 3 410<br />
Subtotal 77 57 7 6 668 24 57 13 13 5 11 27 25 37 18 0 444 0 24 7 806<br />
Women 25 19 6 8 542 57 54 10 15 16 15 24 25 38 6 0 303 1 16 1 598<br />
University of Nevada<br />
NV<br />
School of Medic<strong>in</strong>e<br />
Men 33 26 5 2 751 62 67 10 25 9 21 31 37 29 8 1 472 0 21 6 815<br />
Subtotal 58 45 11 10 1,293 119 121 20 40 25 36 55 62 67 14 1 775 1 37 7 1,413<br />
Women 54 113 24 23 3,499 374 439 83 73 56 180 116 150 220 12 2 1,779 2 151 94 3,699<br />
Albany <strong>Medical</strong> College Men 66 113 30 20 4,161 453 503 117 83 35 178 145 192 154 12 2 2,301 0 149 99 4,378<br />
Subtotal 120 226 54 43 7,660 827 942 200 156 91 358 261 342 374 24 4 4,080 2 300 193 8,077<br />
Albert E<strong>in</strong>ste<strong>in</strong> College of Women 76 141 40 37 3,212 461 312 43 46 58 164 93 143 250 10 3 1,562 4 150 236 3,482<br />
Medic<strong>in</strong>e of Yeshiva Men 76 139 28 26 3,910 510 419 83 57 48 181 108 168 130 9 2 2,116 1 163 254 4,178<br />
University<br />
Subtotal 152 280 68 63 7,122 971 731 126 103 106 345 201 311 380 19 5 3,678 5 313 490 7,660<br />
Columbia University Women 64 132 32 31 2,837 455 263 29 37 49 148 68 126 263 7 2 1,338 4 137 197 3,080<br />
College of Physicians and Men 74 116 21 35 3,524 457 390 66 49 44 181 76 144 172 16 1 1,879 2 151 227 3,765<br />
Surgeons<br />
Subtotal 138 248 53 66 6,361 912 653 95 86 93 329 144 270 435 23 3 3,217 6 288 424 6,845<br />
111<br />
Cont<strong>in</strong>ues on next page<br />
Association of American <strong>Medical</strong> Colleges
Table 31: Number of Applicants by State, U.S. <strong>Medical</strong> School, Gender, and Race and Ethnicity, 2011<br />
(cont<strong>in</strong>ued)<br />
Table 31: U.S. <strong>Medical</strong> School Applicants by State, <strong>Medical</strong> School, Gender, and Race and Ethnicity*, 2011 (cont<strong>in</strong>ued)<br />
<strong>Diversity</strong> <strong>in</strong> <strong>Medical</strong> <strong>Education</strong>: <strong>Facts</strong> & <strong>Figures</strong> <strong>2012</strong><br />
Hispanic/Non-Hispanic Non-Hispanic Asians Non-Hispanic Other Races<br />
Ameri-<br />
Black can<br />
State/School/Gender** Mexi-<br />
Non<br />
or Afri- Indian Native<br />
No<br />
can Other<br />
Hispacan<br />
or Hawa-<br />
Race UnduAmeriHispa-<br />
Puerto nic or Chi- Asian Pakis- FilipiJapaKoVietna- Other Ameri- Alaska iian or Other Resplicatedcannic Cuban Rican Lat<strong>in</strong>o nese Indian tani nonesereanmese Asian can Native OPI White Race ponse Foreign Total<br />
Women 21 97 22 20 1,834 140 241 45 26 13 75 33 90 212 9 3 923 2 95 32 1,976<br />
Hofstra North Shore - LIJ<br />
School of Medic<strong>in</strong>e<br />
Men 25 75 11 16 1,978 155 274 62 37 7 64 42 92 111 4 1 1,097 1 90 27 2,100<br />
Subtotal 46 172 33 36 3,812 295 515 107 63 20 139 75 182 323 13 4 2,020 3 185 59 4,076<br />
Women 60 141 43 30 2,824 431 285 34 41 37 156 67 118 233 11 3 1,363 4 132 187 3,080<br />
Mount S<strong>in</strong>ai School of<br />
Medic<strong>in</strong>e<br />
Men 51 121 20 22 3,170 396 345 63 43 28 159 74 131 140 14 0 1,711 1 153 178 3,380<br />
Subtotal 111 262 63 52 5,994 827 630 97 84 65 315 141 249 373 25 3 3,074 5 285 365 6,460<br />
Women 95 192 61 45 5,054 534 618 107 94 86 257 163 210 353 22 3 2,563 3 214 234 5,420<br />
New York <strong>Medical</strong> College Men 94 180 47 37 5,765 617 676 138 104 56 259 188 261 211 21 4 3,201 1 192 234 6,109<br />
Subtotal 189 372 108 82 10,819 1,151 1,294 245 198 142 516 351 471 564 43 7 5,764 4 406 468 11,529<br />
Women 70 146 47 38 3,299 498 326 47 46 51 175 83 135 242 8 2 1,665 4 149 123 3,575<br />
New York University<br />
School of Medic<strong>in</strong>e<br />
Men 70 138 25 33 3,846 493 440 84 68 45 192 108 147 153 17 1 2,111 1 157 123 4,100<br />
Subtotal 140 284 72 71 7,145 991 766 131 114 96 367 191 282 395 25 3 3,776 5 306 246 7,675<br />
State University of New Women 45 123 28 31 2,499 283 287 42 42 28 129 51 114 310 9 2 1,213 1 112 42 2,709<br />
York Downstate <strong>Medical</strong> Men 35 86 14 22 2,704 303 286 73 53 28 108 63 119 156 7 2 1,484 1 119 41 2,861<br />
Center College of Medic<strong>in</strong>e<br />
Subtotal 80 209 42 53 5,203 586 573 115 95 56 237 114 233 466 16 4 2,697 2 231 83 5,570<br />
State University of New Women 24 76 17 22 2,147 253 276 49 34 20 109 52 95 197 5 1 998 1 76 210 2,280<br />
York Upstate <strong>Medical</strong> Men 30 65 11 14 2,428 287 272 69 45 22 113 58 108 114 7 2 1,248 0 95 217 2,549<br />
University<br />
Subtotal 54 141 28 36 4,575 540 548 118 79 42 222 110 203 311 12 3 2,246 1 171 427 4,829<br />
Women 27 100 15 23 2,010 218 222 40 30 17 93 29 82 224 7 1 1,007 1 95 65 2,160<br />
Stony Brookk University<br />
School of Medic<strong>in</strong>e<br />
Men 29 79 10 19 2,267 243 265 78 38 11 87 46 103 120 3 1 1,214 1 111 80 2,404<br />
Subtotal 56 179 25 42 4,277 461 487 118 68 28 180 75 185 344 10 2 2,221 2 206 145 4,564<br />
University at Buffalo State Women 15 73 10 18 1,911 220 240 53 36 24 92 50 81 153 5 0 951 2 79 22 2,018<br />
University of New York<br />
Men 27 61 10 11 2,386 283 280 68 43 11 109 76 123 98 7 1 1,268 0 102 21 2,494<br />
School of Medic<strong>in</strong>e &<br />
Biomedical Sciences Subtotal 42 134 20 29 4,297 503 520 121 79 35 201 126 204 251 12 1 2,219 2 181 43 4,512<br />
University of Rochester Women 29 67 17 16 2,181 287 235 37 23 42 114 64 89 136 7 1 1,144 2 104 8 2,301<br />
School of Medic<strong>in</strong>e and Men 37 75 7 12 2,495 296 243 51 33 23 116 70 89 94 10 1 1,481 2 97 6 2,623<br />
Dentistry<br />
Subtotal 66 142 24 28 4,676 583 478 88 56 65 230 134 178 230 17 2 2,625 4 201 14 4,924<br />
Women 54 95 32 28 2,414 402 218 24 36 37 126 58 102 200 6 4 1,175 2 118 143 2,611<br />
Weill Cornell <strong>Medical</strong><br />
College<br />
Men 60 102 17 31 2,906 389 330 55 32 36 162 57 128 148 12 0 1,524 1 140 142 3,111<br />
Subtotal 114 197 49 59 5,320 791 548 79 68 73 288 115 230 348 18 4 2,699 3 258 285 5,722<br />
112<br />
NY<br />
Association of American <strong>Medical</strong> Colleges<br />
Cont<strong>in</strong>ues on next page
Table 31: Number of Applicants by State, U.S. <strong>Medical</strong> School, Gender, and Race and Ethnicity, 2011<br />
(cont<strong>in</strong>ued)<br />
Table 31: U.S. <strong>Medical</strong> School Applicants by State, <strong>Medical</strong> School, Gender, and Race and Ethnicity*, 2011 (cont<strong>in</strong>ued)<br />
<strong>Diversity</strong> <strong>in</strong> <strong>Medical</strong> <strong>Education</strong>: <strong>Facts</strong> & <strong>Figures</strong> <strong>2012</strong><br />
Hispanic/Non-Hispanic Non-Hispanic Asians Non-Hispanic Other Races<br />
Ameri-<br />
Black can<br />
State/School/Gender** Mexi-<br />
Non<br />
or Afri- Indian Native<br />
No<br />
can Other<br />
Hispacan<br />
or Hawa-<br />
Race UnduAmeriHispa-<br />
Puerto nic or Chi- Asian Pakis- FilipiJapaKoVietna- Other Ameri- Alaska iian or Other Resplicatedcannic Cuban Rican Lat<strong>in</strong>o nese Indian tani nonesereanmese Asian can Native OPI White Race ponse Foreign Total<br />
Case Western Reserve Women 43 39 17 10 2,201 353 233 28 25 36 108 43 83 182 7 2 1,075 1 75 192 2,309<br />
University School of Men 44 54 9 11 2,862 348 350 54 26 26 113 77 114 112 15 1 1,560 1 121 190 2,983<br />
Medic<strong>in</strong>e<br />
Subtotal 87 93 26 21 5,063 701 583 82 51 62 221 120 197 294 22 3 2,635 2 196 382 5,292<br />
Women 14 28 7 4 923 30 132 23 18 6 27 28 39 95 4 0 535 0 20 5 976<br />
Northeast Ohio <strong>Medical</strong><br />
University<br />
Men 18 21 6 6 1,171 53 143 33 9 5 30 31 44 62 8 1 747 0 33 13 1,221<br />
Subtotal 32 49 13 10 2,094 83 275 56 27 11 57 59 83 157 12 1 1,282 0 53 18 2,197<br />
Women 48 68 14 20 1,746 177 145 22 24 20 56 27 51 308 15 0 943 0 52 7 1,888<br />
Ohio State University<br />
College of Medic<strong>in</strong>e<br />
Men 60 67 7 10 2,511 174 220 49 22 12 68 63 91 167 17 1 1,629 1 84 2 2,651<br />
Subtotal 108 135 21 30 4,257 351 365 71 46 32 124 90 142 475 32 1 2,572 1 136 9 4,539<br />
Women 16 32 12 7 1,700 142 203 32 30 22 68 52 65 111 9 0 984 0 64 5 1,767<br />
The University of Toledo<br />
College of Medic<strong>in</strong>e<br />
Men 32 31 12 4 2,378 193 267 56 35 18 77 79 100 83 15 1 1,481 0 68 14 2,456<br />
Subtotal 48 63 24 11 4,078 335 470 88 65 40 145 131 165 194 24 1 2,465 0 132 19 4,223<br />
Women 27 31 10 9 1,762 163 177 22 26 21 58 35 55 146 8 2 1,072 1 58 8 1,837<br />
University of C<strong>in</strong>c<strong>in</strong>nati<br />
College of Medic<strong>in</strong>e<br />
Men 25 38 6 8 2,395 177 245 45 32 14 68 61 89 87 13 1 1,569 0 78 13 2,470<br />
Subtotal 52 69 16 17 4,157 340 422 67 58 35 126 96 144 233 21 3 2,641 1 136 21 4,307<br />
Wright State University Women 18 39 13 9 1,289 63 144 24 16 12 31 24 48 169 10 0 763 1 39 9 1,365<br />
Boonshoft School of Men 17 28 11 5 1,549 67 164 28 19 9 33 39 69 97 11 1 1,000 0 48 13 1,608<br />
Medic<strong>in</strong>e<br />
Subtotal 35 67 24 14 2,838 130 308 52 35 21 64 63 117 266 21 1 1,763 1 87 22 2,973<br />
Women 16 15 4 3 627 32 75 15 10 5 9 30 25 53 31 0 372 1 10 1 664<br />
University of Oklahoma<br />
College of Medic<strong>in</strong>e<br />
Men 23 33 8 1 790 40 76 11 6 5 9 33 31 28 36 1 541 1 15 4 853<br />
Subtotal 39 48 12 4 1,417 72 151 26 16 10 18 63 56 81 67 1 913 2 25 5 1,517<br />
Oregon Health & Science Women 75 63 10 12 2,097 219 122 18 37 63 77 75 86 56 18 1 1,350 2 100 10 2,250<br />
University School of Men 80 65 6 4 2,388 222 143 20 38 43 59 83 94 40 12 1 1,671 0 85 14 2,537<br />
Medic<strong>in</strong>e<br />
Subtotal 155 128 16 16 4,485 441 265 38 75 106 136 158 180 96 30 2 3,021 2 185 24 4,787<br />
Women 101 206 62 50 5,583 488 645 99 98 78 245 161 208 531 26 2 3,042 5 230 19 5,973<br />
Drexel University College<br />
of Medic<strong>in</strong>e<br />
Men 100 191 49 40 6,230 577 730 141 118 51 250 176 248 283 23 4 3,698 2 199 23 6,592<br />
Subtotal 201 397 111 90 11,813 1,065 1,375 240 216 129 495 337 456 814 49 6 6,740 7 429 42 12,565<br />
Jefferson <strong>Medical</strong> College Women 68 125 44 29 4,482 458 491 63 71 72 231 126 152 259 11 3 2,452 4 183 263 4,740<br />
of Thomas Jefferson Men 58 133 29 29 4,922 491 569 93 82 49 204 128 196 135 20 1 2,905 1 155 261 5,169<br />
University<br />
Subtotal 126 258 73 58 9,404 949 1,060 156 153 121 435 254 348 394 31 4 5,357 5 338 524 9,909<br />
113<br />
OH<br />
OK<br />
OR<br />
Cont<strong>in</strong>ues on next page<br />
Association of American <strong>Medical</strong> Colleges
Table 31: Number of Applicants by State, U.S. <strong>Medical</strong> School, Gender, and Race and Ethnicity, 2011<br />
(cont<strong>in</strong>ued)<br />
Table 31: U.S. <strong>Medical</strong> School Applicants by State, <strong>Medical</strong> School, Gender, and Race and Ethnicity*, 2011 (cont<strong>in</strong>ued)<br />
<strong>Diversity</strong> <strong>in</strong> <strong>Medical</strong> <strong>Education</strong>: <strong>Facts</strong> & <strong>Figures</strong> <strong>2012</strong><br />
Hispanic/Non-Hispanic Non-Hispanic Asians Non-Hispanic Other Races<br />
Ameri-<br />
Black can<br />
State/School/Gender** Mexi-<br />
Non<br />
or Afri- Indian Native<br />
No<br />
can Other<br />
Hispacan<br />
or Hawa-<br />
Race UnduAmeriHispa-<br />
Puerto nic or Chi- Asian Pakis- FilipiJapaKoVietna- Other Ameri- Alaska iian or Other Resplicatedcannic Cuban Rican Lat<strong>in</strong>o nese Indian tani nonesereanmese Asian can Native OPI White Race ponse Foreign Total<br />
Pennsylvania State Women 38 82 18 24 3,136 297 353 59 46 39 162 79 119 196 17 1 1,721 2 119 198 3,294<br />
University College of Men 43 73 24 17 3,817 379 397 75 66 39 156 109 160 112 18 1 2,265 0 115 212 3,969<br />
Medic<strong>in</strong>e<br />
Subtotal 81 155 42 41 6,953 676 750 134 112 78 318 188 279 308 35 2 3,986 2 234 410 7,263<br />
Raymond and Ruth Women 52 83 25 20 2,535 377 192 21 24 31 133 53 96 229 7 0 1,334 3 106 118 2,708<br />
Perelman School of<br />
Men 67 93 25 28 3,241 379 369 43 43 40 140 69 136 145 16 0 1,851 2 139 128 3,449<br />
Medic<strong>in</strong>e at the University<br />
of Pennsylvania<br />
Subtotal 119 176 50 48 5,776 756 561 64 67 71 273 122 232 374 23 0 3,185 5 245 246 6,157<br />
Women 71 161 53 33 4,509 403 511 64 71 61 213 129 151 492 16 2 2,415 4 187 29 4,806<br />
Temple University School<br />
of Medic<strong>in</strong>e<br />
Men 75 159 43 33 5,088 471 564 104 88 36 193 133 188 237 20 2 3,090 0 166 31 5,387<br />
Subtotal 146 320 96 66 9,597 874 1,075 168 159 97 406 262 339 729 36 4 5,505 4 353 60 10,193<br />
Women 29 67 16 14 1,985 130 295 43 36 17 77 60 89 170 11 1 1,058 0 72 32 2,105<br />
The Commonwealth<br />
<strong>Medical</strong> College<br />
Men 28 57 15 17 2,204 176 277 62 43 17 70 50 98 121 8 1 1,274 1 80 40 2,317<br />
Subtotal 57 124 31 31 4,189 306 572 105 79 34 147 110 187 291 19 2 2,332 1 152 72 4,422<br />
Women 42 69 14 16 2,054 254 184 17 21 26 89 51 57 195 4 2 1,159 3 89 9 2,187<br />
University of Pittsburgh<br />
School of Medic<strong>in</strong>e<br />
Men 54 77 11 18 2,661 272 284 34 30 22 87 47 102 140 13 1 1,635 2 115 10 2,816<br />
Subtotal 96 146 25 34 4,715 526 468 51 51 48 176 98 159 335 17 3 2,794 5 204 19 5,003<br />
Women 22 74 37 227 265 18 40 7 5 4 6 11 11 45 3 2 112 1 12 11 612<br />
Ponce School of Medic<strong>in</strong>e<br />
and Health Sciences<br />
Men 21 56 37 179 325 19 47 14 8 2 10 7 24 33 0 1 151 0 15 15 602<br />
Subtotal 43 130 74 406 590 37 87 21 13 6 16 18 35 78 3 3 263 1 27 26 1,214<br />
Women 19 72 32 205 265 11 38 11 6 1 7 11 9 39 4 5 126 0 10 11 580<br />
San Juan Bautista School<br />
of Medic<strong>in</strong>e<br />
Men 21 51 22 141 287 12 39 11 8 1 8 8 15 39 2 1 140 0 12 8 507<br />
Subtotal 40 123 54 346 552 23 77 22 14 2 15 19 24 78 6 6 266 0 22 19 1,087<br />
Women 20 55 24 240 172 8 25 4 1 1 6 8 3 34 2 4 74 0 8 6 499<br />
Universidad Central del<br />
Caribe School of Medic<strong>in</strong>e<br />
Men 14 52 22 184 231 14 34 7 7 2 6 4 19 33 1 2 105 0 5 8 486<br />
Subtotal 34 107 46 424 403 22 59 11 8 3 12 12 22 67 3 6 179 0 13 14 985<br />
Women 19 42 18 194 151 10 21 5 4 2 5 5 8 23 2 2 75 1 6 2 411<br />
University of Puerto Rico<br />
School of Medic<strong>in</strong>e<br />
Men 12 42 18 146 230 6 30 7 5 2 4 10 14 31 1 3 115 0 6 8 440<br />
Subtotal 31 84 36 340 381 16 51 12 9 4 9 15 22 54 3 5 190 1 12 10 851<br />
Women 35 61 26 16 2,086 269 199 20 22 29 113 45 84 142 9 0 1,121 4 82 127 2,216<br />
The Warren Alpert <strong>Medical</strong><br />
School of Brown University<br />
Men 35 71 11 12 1,978 206 222 30 19 28 83 50 98 86 10 2 1,117 2 78 115 2,104<br />
Subtotal 70 132 37 28 4,064 475 421 50 41 57 196 95 182 228 19 2 2,238 6 160 242 4,320<br />
114<br />
PA<br />
PR<br />
RI<br />
Association of American <strong>Medical</strong> Colleges<br />
Cont<strong>in</strong>ues on next page
Table 31: Number of Applicants by State, U.S. <strong>Medical</strong> School, Gender, and Race and Ethnicity, 2011<br />
(cont<strong>in</strong>ued)<br />
Table 31: U.S. <strong>Medical</strong> School Applicants by State, <strong>Medical</strong> School, Gender, and Race and Ethnicity*, 2011 (cont<strong>in</strong>ued)<br />
<strong>Diversity</strong> <strong>in</strong> <strong>Medical</strong> <strong>Education</strong>: <strong>Facts</strong> & <strong>Figures</strong> <strong>2012</strong><br />
Hispanic/Non-Hispanic Non-Hispanic Asians Non-Hispanic Other Races<br />
Ameri-<br />
Black can<br />
State/School/Gender** Mexi-<br />
Non<br />
or Afri- Indian Native<br />
No<br />
can Other<br />
Hispacan<br />
or Hawa-<br />
Race UnduAmeriHispa-<br />
Puerto nic or Chi- Asian Pakis- FilipiJapaKoVietna- Other Ameri- Alaska iian or Other Resplicatedcannic Cuban Rican Lat<strong>in</strong>o nese Indian tani nonesereanmese Asian can Native OPI White Race ponse Foreign Total<br />
<strong>Medical</strong> University of South Women 24 52 23 15 1,405 42 131 24 15 13 25 24 32 160 9 0 931 0 36 29 1,517<br />
Carol<strong>in</strong>a College of Men 21 32 16 6 1,594 58 106 28 14 3 24 24 51 92 16 1 1,169 0 47 30 1,665<br />
Medic<strong>in</strong>e<br />
Subtotal 45 84 39 21 2,999 100 237 52 29 16 49 48 83 252 25 1 2,100 0 83 59 3,182<br />
University of South Women 19 42 21 14 1,263 42 139 18 13 16 20 33 33 140 7 0 815 0 34 13 1,357<br />
Carol<strong>in</strong>a School of Men 20 33 18 2 1,473 57 121 25 18 6 25 36 54 77 13 1 1,057 0 31 13 1,545<br />
Medic<strong>in</strong>e<br />
Subtotal 39 75 39 16 2,736 99 260 43 31 22 45 69 87 217 20 1 1,872 0 65 26 2,902<br />
Sanford School of Medic<strong>in</strong>e Women 1 2 0 3 172 8 6 2 1 2 4 1 2 8 4 0 135 0 4 2 177<br />
The University of South Men 3 4 3 1 232 9 11 0 2 2 2 2 8 4 1 0 187 0 6 4 242<br />
Dakota<br />
Subtotal 4 6 3 4 404 17 17 2 3 4 6 3 10 12 5 0 322 0 10 6 419<br />
East Tennessee State Women 10 13 6 4 687 28 85 12 7 7 7 18 20 84 3 0 417 0 17 19 719<br />
University James H. Men 24 17 8 6 888 29 75 20 7 3 18 19 39 55 8 1 604 0 23 32 939<br />
Quillen College of Medic<strong>in</strong>e<br />
Subtotal 34 30 14 10 1,575 57 160 32 14 10 25 37 59 139 11 1 1,021 0 40 51 1,658<br />
Women 62 119 33 33 2,545 99 290 79 51 18 43 92 117 1,199 9 0 556 1 40 116 2,779<br />
Meharry <strong>Medical</strong> College Men 58 89 21 23 2,042 104 280 76 37 19 48 64 121 587 15 3 680 1 47 122 2,222<br />
Subtotal 120 208 54 56 4,587 203 570 155 88 37 91 156 238 1,786 24 3 1,236 2 87 238 5,001<br />
University of Tennessee Women 4 8 1 3 576 17 35 7 2 6 4 9 15 95 3 0 392 0 12 0 592<br />
Health Science Center Men 8 11 2 5 687 12 40 4 0 1 10 6 23 43 6 0 544 0 15 1 710<br />
College of Medic<strong>in</strong>e<br />
Subtotal 12 19 3 8 1,263 29 75 11 2 7 14 15 38 138 9 0 936 0 27 1 1,302<br />
Women 33 56 20 10 2,198 231 152 16 11 21 61 37 66 227 11 1 1,317 2 71 140 2,321<br />
Vanderbilt University<br />
School of Medic<strong>in</strong>e<br />
Men 55 58 21 13 2,858 223 274 34 24 22 82 43 97 129 24 1 1,849 0 97 171 3,009<br />
Subtotal 88 114 41 23 5,056 454 426 50 35 43 143 80 163 356 35 2 3,166 2 168 311 5,330<br />
Women 73 78 14 16 2,042 233 197 45 34 16 74 70 84 256 17 0 1,005 3 72 84 2,223<br />
Baylor College of Medic<strong>in</strong>e Men 92 94 9 10 2,406 255 253 46 28 23 77 87 98 109 17 1 1,418 2 82 88 2,611<br />
Subtotal 165 172 23 26 4,448 488 450 91 62 39 151 157 182 365 34 1 2,423 5 154 172 4,834<br />
Women 51 170 5 8 1,481 75 136 44 21 7 30 50 195 167 15 0 774 1 24 36 1,716<br />
Texas A&M Health Science<br />
Center College of Medic<strong>in</strong>e<br />
Men 55 174 1 4 1,559 88 118 29 17 4 29 53 176 77 14 0 991 0 23 19 1,795<br />
Subtotal 106 344 6 12 3,040 163 254 73 38 11 59 103 371 244 29 0 1,765 1 47 55 3,511<br />
Texas Tech University Women 43 140 4 7 1,094 46 113 35 15 6 21 46 154 130 11 0 541 1 19 16 1,287<br />
Health Sciences Center<br />
Men 46 151 1 4 1,222 68 94 26 14 3 24 48 151 68 12 0 749 0 19 6 1,426<br />
Paul L. Foster School of<br />
Medic<strong>in</strong>e<br />
Subtotal 89 291 5 11 2,316 114 207 61 29 9 45 94 305 198 23 0 1,290 1 38 22 2,713<br />
SC<br />
115<br />
SD<br />
TN<br />
Cont<strong>in</strong>ues on next page<br />
Association of American <strong>Medical</strong> Colleges
Table 31: Number of Applicants by State, U.S. <strong>Medical</strong> School, Gender, and Race and Ethnicity, 2011<br />
(cont<strong>in</strong>ued)<br />
Table 31: U.S. <strong>Medical</strong> School Applicants by State, <strong>Medical</strong> School, Gender, and Race and Ethnicity*, 2011 (cont<strong>in</strong>ued)<br />
<strong>Diversity</strong> <strong>in</strong> <strong>Medical</strong> <strong>Education</strong>: <strong>Facts</strong> & <strong>Figures</strong> <strong>2012</strong><br />
Hispanic/Non-Hispanic Non-Hispanic Asians Non-Hispanic Other Races<br />
Ameri-<br />
Black can<br />
State/School/Gender** Mexi-<br />
Non<br />
or Afri- Indian Native<br />
No<br />
can Other<br />
Hispacan<br />
or Hawa-<br />
Race UnduAmeriHispa-<br />
Puerto nic or Chi- Asian Pakis- FilipiJapaKoVietna- Other Ameri- Alaska iian or Other Resplicatedcannic Cuban Rican Lat<strong>in</strong>o nese Indian tani nonesereanmese Asian can Native OPI White Race ponse Foreign Total<br />
Texas Tech University Women 40 165 5 8 1,333 56 130 41 18 6 23 47 188 157 16 0 679 1 22 22 1,551<br />
Health Sciences Center Men 53 174 1 3 1,444 75 114 25 15 3 26 52 175 76 15 0 903 0 23 11 1,679<br />
School of Medic<strong>in</strong>e<br />
Subtotal 93 339 6 11 2,777 131 244 66 33 9 49 99 363 233 31 0 1,582 1 45 33 3,230<br />
The University of Texas Women 57 195 5 10 1,542 91 135 44 22 8 27 55 196 177 14 0 811 1 27 24 1,807<br />
School of Medic<strong>in</strong>e at San Men 63 186 1 4 1,639 98 127 30 17 4 34 57 180 79 13 0 1,035 0 34 11 1,895<br />
Antonio<br />
Subtotal 120 381 6 14 3,181 189 262 74 39 12 61 112 376 256 27 0 1,846 1 61 35 3,702<br />
Women 56 191 5 8 1,591 85 138 45 22 7 29 53 203 199 14 0 823 1 26 46 1,853<br />
University of Texas <strong>Medical</strong><br />
Branch School of Medic<strong>in</strong>e<br />
Men 69 191 1 4 1,667 99 133 30 18 7 35 58 188 87 15 0 1,031 0 33 29 1,936<br />
Subtotal 125 382 6 12 3,258 184 271 75 40 14 64 111 391 286 29 0 1,854 1 59 75 3,789<br />
Women 62 191 5 8 1,641 95 148 46 23 8 32 59 201 208 13 0 844 1 24 44 1,907<br />
University of Texas <strong>Medical</strong><br />
School at Houston<br />
Men 69 184 1 5 1,723 106 136 30 17 7 37 61 184 85 15 0 1,077 0 36 25 1,985<br />
Subtotal 131 375 6 13 3,364 201 284 76 40 15 69 120 385 293 28 0 1,921 1 60 69 3,892<br />
University of Texas Women 60 165 3 9 1,561 103 133 38 22 7 32 56 186 191 11 0 803 1 26 48 1,799<br />
Southwestern <strong>Medical</strong><br />
Men 70 176 1 4 1,676 110 145 29 18 9 36 54 168 86 17 0 1,030 0 39 32 1,931<br />
Center at Dallas<br />
Southwestern <strong>Medical</strong> Subtotal 130 341 4 13 3,237 213 278 67 40 16 68 110 354 277 28 0 1,833 1 65 80 3,730<br />
Women 29 47 14 7 449 25 42 6 20 9 11 13 12 52 10 0 260 0 8 9 545<br />
University of Utah School<br />
of Medic<strong>in</strong>e<br />
Men 49 37 9 3 856 32 21 6 17 6 14 17 12 36 11 1 678 0 23 11 954<br />
Subtotal 78 84 23 10 1,305 57 63 12 37 15 25 30 24 88 21 1 938 0 31 20 1,499<br />
Women 23 64 13 20 2,165 166 263 54 56 24 98 70 90 223 13 0 1,077 1 81 128 2,283<br />
Eastern Virg<strong>in</strong>ia <strong>Medical</strong><br />
School<br />
Men 25 52 17 15 2,522 217 299 68 45 15 108 92 109 133 11 2 1,399 0 61 166 2,632<br />
Subtotal 48 116 30 35 4,687 383 562 122 101 39 206 162 199 356 24 2 2,476 1 142 294 4,915<br />
Women 30 49 13 12 1,812 158 148 25 18 17 73 40 61 148 7 1 1,090 2 71 86 1,916<br />
University of Virg<strong>in</strong>ia<br />
School of Medic<strong>in</strong>e<br />
Men 22 54 12 8 2,206 178 219 47 22 20 86 41 85 102 11 1 1,369 0 84 74 2,298<br />
Subtotal 52 103 25 20 4,018 336 367 72 40 37 159 81 146 250 18 2 2,459 2 155 160 4,214<br />
Virg<strong>in</strong>ia Commonwealth Women 39 60 24 18 2,842 251 343 49 48 43 130 100 112 251 15 0 1,503 3 115 71 2,978<br />
University School of Men 37 76 25 15 3,326 309 389 85 58 28 141 123 149 141 16 1 1,915 0 93 88 3,473<br />
Medic<strong>in</strong>e<br />
Subtotal 76 136 49 33 6,168 560 732 134 106 71 271 223 261 392 31 1 3,418 3 208 159 6,451<br />
Women 17 32 11 10 1,175 70 144 27 26 10 54 37 57 108 9 0 645 0 38 18 1,243<br />
Virg<strong>in</strong>ia Tech Carilion<br />
School of Medic<strong>in</strong>e<br />
Men 17 38 11 7 1,434 101 178 43 27 8 49 43 65 75 8 1 853 0 38 25 1,500<br />
Subtotal 34 70 22 17 2,609 171 322 70 53 18 103 80 122 183 17 1 1,498 0 76 43 2,743<br />
TX<br />
116<br />
UT<br />
VA<br />
Association of American <strong>Medical</strong> Colleges<br />
Cont<strong>in</strong>ues on next page
Table 31: Number of Applicants by State, U.S. <strong>Medical</strong> School, Gender, and Race and Ethnicity, 2011<br />
(cont<strong>in</strong>ued)<br />
Table 31: U.S. <strong>Medical</strong> School Applicants by State, <strong>Medical</strong> School, Gender, and Race and Ethnicity*, 2011 (cont<strong>in</strong>ued)<br />
Hispanic/Non-Hispanic Non-Hispanic Asians Non-Hispanic Other Races<br />
Black AmeriMexi-<br />
Non<br />
or African Native<br />
No<br />
can Other<br />
Hispacan<br />
Indian or Hawa-<br />
Race<br />
UnduAmeriHispa-<br />
Puerto nic or Chi- Asian Pakis- FilipiJapaKoVietna- Other Ameri- Alaska iian or Other Resplicatedcannic<br />
Cuban Rican Lat<strong>in</strong>o nese Indian tani nonesereanmese Asian can Native OPI White Race ponse Foreign Total<br />
Women 39 58 16 12 2,551 208 223 29 38 45 92 68 71 74 18 0 1,692 1 124 14 2,669<br />
Men 50 71 13 11 3,047 247 250 47 43 34 90 83 110 72 19 1 2,058 0 107 17 3,189<br />
State/School/Gender**<br />
University of Vermont<br />
College of Medic<strong>in</strong>e<br />
VT<br />
<strong>Diversity</strong> <strong>in</strong> <strong>Medical</strong> <strong>Education</strong>: <strong>Facts</strong> & <strong>Figures</strong> <strong>2012</strong><br />
Subtotal 89 129 29 23 5,598 455 473 76 81 79 182 151 181 146 37 1 3,750 1 231 31 5,858<br />
Women 85 94 19 13 2,153 233 130 21 40 50 99 75 72 123 30 2 1,338 3 78 35 2,351<br />
117<br />
Men 94 83 7 12 2,417 227 164 25 36 47 88 59 86 86 18 2 1,603 1 97 41 2,609<br />
Subtotal 179 177 26 25 4,570 460 294 46 76 97 187 134 158 209 48 4 2,941 4 175 76 4,960<br />
University of Wash<strong>in</strong>gton<br />
School of Medic<strong>in</strong>e<br />
WA<br />
Women 55 61 25 10 2,750 230 277 50 42 44 105 79 105 124 17 2 1,699 3 78 102 2,899<br />
Men 71 65 18 8 3,673 292 315 67 54 31 117 97 135 89 14 1 2,431 1 112 137 3,833<br />
<strong>Medical</strong> College of<br />
Wiscons<strong>in</strong><br />
Subtotal 126 126 43 18 6,423 522 592 117 96 75 222 176 240 213 31 3 4,130 4 190 239 6,732<br />
Women 36 33 10 6 1,593 142 132 19 14 15 40 36 46 106 10 1 1,057 1 46 12 1,676<br />
WI<br />
Men 41 42 4 6 2,134 159 151 29 29 14 66 44 65 67 8 1 1,488 0 82 20 2,224<br />
Subtotal 77 75 14 12 3,727 301 283 48 43 29 106 80 111 173 18 2 2,545 1 128 32 3,900<br />
University of Wiscons<strong>in</strong><br />
School of Medic<strong>in</strong>e and<br />
Public Health<br />
Women 10 18 5 7 585 19 74 12 10 4 14 19 18 39 4 0 370 0 26 3 625<br />
Men 10 17 6 6 763 32 67 14 12 2 25 20 32 41 5 1 505 0 25 4 801<br />
Marshall University Joan<br />
C. Edwards School of<br />
Medic<strong>in</strong>e<br />
Subtotal 20 35 11 13 1,348 51 141 26 22 6 39 39 50 80 9 1 875 0 51 7 1,426<br />
Women 17 35 12 5 1,085 77 150 24 19 11 36 44 50 50 7 0 638 0 40 8 1,153<br />
WV<br />
Men 23 27 9 6 1,455 96 138 36 17 7 50 50 57 53 8 1 954 0 37 12 1,517<br />
Subtotal 40 62 21 11 2,540 173 288 60 36 18 86 94 107 103 15 1 1,592 0 77 20 2,670<br />
West Virg<strong>in</strong>ia University<br />
School of Medic<strong>in</strong>e<br />
*Start<strong>in</strong>g <strong>in</strong> 2002, students had the option of report<strong>in</strong>g their race and ethnicity alone or <strong>in</strong> comb<strong>in</strong>ation with some other race and ethnicity. Therefore, the unduplicated total was given.<br />
**Four applicants did not report gender, so they were excluded <strong>in</strong> this table.<br />
Data Source: <strong>AAMC</strong> Data Warehouse: Applicant-Matriculant File, as of March 16, <strong>2012</strong><br />
Association of American <strong>Medical</strong> Colleges
Table 32: U.S. <strong>Medical</strong> School Matriculants by State, <strong>Medical</strong> School, Gender, and Race and<br />
Ethnicity, 2011<br />
Table 32: U.S. <strong>Medical</strong> School Matriculants by State, <strong>Medical</strong> School, Gender, and Race and Ethnicity*, 2011<br />
<strong>Diversity</strong> <strong>in</strong> <strong>Medical</strong> <strong>Education</strong>: <strong>Facts</strong> & <strong>Figures</strong> <strong>2012</strong><br />
Hispanic/Non-Hispanic Non-Hispanic Asians Non-Hispanic Other Races<br />
Ameri-<br />
Black can<br />
State/School/Gender Mexi-<br />
Non<br />
or Afri- Indian Native<br />
No<br />
can Other<br />
Hispacan<br />
or Hawa-<br />
Race<br />
UnduAmeriHispa-<br />
Puerto nic or Chi- Asian Pakis- FilipiJapaKoVietna- Other Ameri- Alaska iian or Other Resplicatedcannic<br />
Cuban Rican Lat<strong>in</strong>o nese Indian tani nonesereanmese Asian can Native OPI White Race ponse Foreign Total<br />
Women 0 0 0 0 82 5 8 0 2 1 2 0 1 4 1 0 60 0 3 0 82<br />
University of Alabama<br />
School of Medic<strong>in</strong>e<br />
Men 1 1 0 0 92 4 6 0 0 1 2 0 1 3 0 0 74 0 4 0 94<br />
Subtotal 1 1 0 0 174 9 14 0 2 2 4 0 2 7 1 0 134 0 7 0 176<br />
University of South Women 0 0 1 0 31 1 3 0 0 0 0 0 1 2 0 0 24 0 0 0 32<br />
Alabama College of Men 0 1 0 0 41 1 0 0 0 0 0 0 0 2 0 0 37 0 1 0 42<br />
Medic<strong>in</strong>e<br />
Subtotal 0 1 1 0 72 2 3 0 0 0 0 0 1 4 0 0 61 0 1 0 74<br />
University of Arkansas Women 1 0 0 1 52 1 2 1 0 0 0 2 1 4 0 0 40 0 2 0 54<br />
for <strong>Medical</strong> Sciences Men 2 1 0 0 110 2 4 2 1 1 0 1 2 4 0 0 89 0 6 0 113<br />
College of Medic<strong>in</strong>e<br />
Subtotal 3 1 0 1 162 3 6 3 1 1 0 3 3 8 0 0 129 0 8 0 167<br />
Women 4 3 0 0 49 3 5 1 1 1 2 4 1 3 3 0 36 0 1 0 56<br />
University of Arizona<br />
College of Medic<strong>in</strong>e<br />
Men 5 1 0 1 53 3 4 0 0 0 1 2 3 1 0 0 40 0 2 0 60<br />
Subtotal 9 4 0 1 102 6 9 1 1 1 3 6 4 4 3 0 76 0 3 0 116<br />
Keck School of Medic<strong>in</strong>e Women 9 1 0 1 72 14 3 0 1 1 2 2 3 1 0 0 41 0 6 0 83<br />
of the University of Men 7 2 0 0 86 12 7 0 2 4 2 1 1 6 0 0 56 0 4 0 95<br />
Southern California<br />
Subtotal 16 3 0 1 158 26 10 0 3 5 4 3 4 7 0 0 97 0 10 0 178<br />
Women 1 2 0 0 66 5 1 0 5 1 10 1 2 12 0 0 26 0 3 6 70<br />
Loma L<strong>in</strong>da University<br />
School of Medic<strong>in</strong>e<br />
Men 2 4 0 1 91 8 4 2 4 2 8 5 4 4 0 0 47 0 1 7 98<br />
Subtotal 3 6 0 1 157 13 5 2 9 3 18 6 6 16 0 0 73 0 4 13 168<br />
Women 2 1 1 0 42 9 2 0 1 2 3 3 2 0 1 0 20 0 1 1 46<br />
Stanford University<br />
School of Medic<strong>in</strong>e<br />
Men 5 2 0 0 33 4 2 0 0 0 1 1 4 4 0 0 18 0 1 1 40<br />
Subtotal 7 3 1 0 75 13 4 0 1 2 4 4 6 4 1 0 38 0 2 2 86<br />
Women 1 0 0 0 7 0 0 0 0 1 1 0 0 4 0 0 2 0 0 0 9<br />
UCLA/Drew <strong>Medical</strong><br />
<strong>Education</strong> Program<br />
Men 6 1 0 1 8 2 0 0 1 0 0 1 2 0 0 0 2 0 1 0 15<br />
Subtotal 7 1 0 1 15 2 0 0 1 1 1 1 2 4 0 0 4 0 1 0 24<br />
University of California, Women 8 6 0 1 38 7 3 1 0 3 1 3 2 1 0 0 20 0 0 0 53<br />
Davis, School of Men 5 1 1 0 41 8 2 0 1 4 0 3 3 1 0 0 23 0 1 0 47<br />
Medic<strong>in</strong>e<br />
Subtotal 13 7 1 1 79 15 5 1 1 7 1 6 5 2 0 0 43 0 1 0 100<br />
University of California, Women 4 4 0 0 43 6 3 0 1 2 2 5 1 2 0 0 17 0 5 0 51<br />
Irv<strong>in</strong>e, School of Men 1 2 0 0 50 3 2 1 2 0 3 1 2 2 0 0 35 0 2 0 53<br />
Medic<strong>in</strong>e<br />
Subtotal 5 6 0 0 93 9 5 1 3 2 5 6 3 4 0 0 52 0 7 0 104<br />
University of California, Women 5 1 1 1 70 20 2 1 2 4 3 3 6 4 0 0 30 0 6 0 78<br />
Los Angeles David<br />
Men 3 1 1 1 79 16 8 0 2 2 5 2 4 1 0 0 43 0 2 0 85<br />
Geffen School of<br />
Medic<strong>in</strong>e<br />
Subtotal 8 2 2 2 149 36 10 1 4 6 8 5 10 5 0 0 73 0 8 0 163<br />
AL<br />
AR<br />
118<br />
AZ<br />
CA<br />
Association of American <strong>Medical</strong> Colleges<br />
Cont<strong>in</strong>ues on next page
Table 32: U.S. <strong>Medical</strong> School Matriculants by State, <strong>Medical</strong> School, Gender, and Race and<br />
Table 32: U.S. <strong>Medical</strong> School Matriculants Ethnicity, by State, 2011 (cont<strong>in</strong>ued)<br />
<strong>Medical</strong> School, Gender, and Race and Ethnicity*, 2011 (cont<strong>in</strong>ued)<br />
<strong>Diversity</strong> <strong>in</strong> <strong>Medical</strong> <strong>Education</strong>: <strong>Facts</strong> & <strong>Figures</strong> <strong>2012</strong><br />
Hispanic/Non-Hispanic Non-Hispanic Asians Non-Hispanic Other Races<br />
Ameri-<br />
Black can<br />
State/School/Gender Mexi-<br />
Non<br />
or Afri- Indian Native<br />
No<br />
can Other<br />
Hispacan<br />
or Hawa-<br />
Race<br />
UnduAmeriHispa-<br />
Puerto nic or Chi- Asian Pakis- FilipiJapaKoVietna- Other Ameri- Alaska iian or Other Resplicatedcannic<br />
Cuban Rican Lat<strong>in</strong>o nese Indian tani nonesereanmese Asian can Native OPI White Race ponse Foreign Total<br />
University of California, Women 5 1 0 1 53 13 3 0 0 2 3 2 4 1 0 0 25 0 3 0 60<br />
San Diego School of Men 1 3 0 2 59 11 7 0 3 2 1 0 4 0 0 0 31 0 6 0 65<br />
Medic<strong>in</strong>e<br />
Subtotal 6 4 0 3 112 24 10 0 3 4 4 2 8 1 0 0 56 0 9 0 125<br />
University of California, Women 11 5 0 0 80 13 4 0 1 3 0 3 3 4 1 0 49 0 3 0 96<br />
San Francisco, School of Men 5 2 0 0 62 10 2 0 4 1 3 2 2 4 0 0 37 0 5 0 69<br />
Medic<strong>in</strong>e<br />
Subtotal 16 7 0 0 142 23 6 0 5 4 3 5 5 8 1 0 86 0 8 0 165<br />
Women 4 9 2 1 64 5 2 0 0 0 1 4 1 3 2 0 46 0 2 4 79<br />
University of Colorado<br />
School of Medic<strong>in</strong>e<br />
Men 9 6 0 1 65 6 1 0 0 1 0 5 1 3 2 0 52 0 3 0 81<br />
Subtotal 13 15 2 2 129 11 3 0 0 1 1 9 2 6 4 0 98 0 5 4 160<br />
Women 0 1 0 0 42 1 2 0 0 0 0 0 1 5 0 0 28 0 4 1 43<br />
University of Connecticut<br />
School of Medic<strong>in</strong>e<br />
Men 0 0 1 1 44 3 4 0 1 0 0 1 1 3 1 0 33 0 1 0 46<br />
Subtotal 0 1 1 1 86 4 6 0 1 0 0 1 2 8 1 0 61 0 5 1 89<br />
Women 0 0 0 1 40 13 4 0 0 0 3 0 3 6 0 0 13 0 0 11 42<br />
Yale University School of<br />
Medic<strong>in</strong>e<br />
Men 1 0 0 1 57 8 8 0 0 1 3 0 4 8 0 0 22 0 2 8 59<br />
Subtotal 1 0 0 2 97 21 12 0 0 1 6 0 7 14 0 0 35 0 2 19 101<br />
George Wash<strong>in</strong>gton Women 1 4 0 1 82 8 9 0 1 0 3 2 3 5 1 0 48 0 5 2 87<br />
University School of<br />
Men 1 2 1 1 86 4 16 1 1 1 5 1 5 6 1 0 48 0 1 3 91<br />
Medic<strong>in</strong>e and Health<br />
Sciences<br />
Subtotal 2 6 1 2 168 12 25 1 2 1 8 3 8 11 2 0 96 0 6 5 178<br />
Women 0 1 0 0 98 9 4 1 2 3 4 2 2 4 0 0 68 0 4 0 99<br />
Georgetown University<br />
School of Medic<strong>in</strong>e<br />
Men 0 3 0 1 96 6 6 1 3 1 1 2 2 5 1 0 67 0 3 0 100<br />
Subtotal 0 4 0 1 194 15 10 2 5 4 5 4 4 9 1 0 135 0 7 0 199<br />
Women 0 3 0 1 57 2 1 0 1 0 0 1 1 44 0 0 5 0 0 3 61<br />
Howard University<br />
College of Medic<strong>in</strong>e<br />
Men 0 2 0 0 50 0 4 2 0 0 0 0 1 33 0 0 6 0 1 5 52<br />
Subtotal 0 5 0 1 107 2 5 2 1 0 0 1 2 77 0 0 11 0 1 8 113<br />
Charles E. Schmidt Women 1 5 2 2 24 1 2 1 1 0 0 1 0 0 0 0 17 0 2 0 32<br />
College of Medic<strong>in</strong>e at Men 0 0 0 0 32 0 1 0 1 0 0 2 0 0 0 0 27 0 1 0 32<br />
Florida Atlantic University<br />
Subtotal 1 5 2 2 56 1 3 1 2 0 0 3 0 0 0 0 44 0 3 0 64<br />
Florida International Women 1 6 7 2 26 2 2 0 0 0 0 0 0 5 0 0 18 0 0 0 39<br />
University Herbert<br />
Men 0 5 6 0 32 1 1 1 0 0 0 0 2 3 1 0 24 0 0 0 43<br />
Wertheim College of<br />
Medic<strong>in</strong>e<br />
Subtotal 1 11 13 2 58 3 3 1 0 0 0 0 2 8 1 0 42 0 0 0 82<br />
Women 0 4 2 4 44 1 5 1 0 1 0 2 4 5 0 0 25 0 2 0 54<br />
Florida State University<br />
College of Medic<strong>in</strong>e<br />
Men 0 5 4 2 55 4 4 0 1 0 1 1 0 4 0 0 40 0 1 0 66<br />
Subtotal 0 9 6 6 99 5 9 1 1 1 1 3 4 9 0 0 65 0 3 0 120<br />
Women 0 4 3 1 53 3 10 1 0 1 1 2 0 3 0 0 33 0 0 0 60<br />
USF Health Morsani<br />
College of Medic<strong>in</strong>e<br />
Men 0 5 3 2 69 4 8 1 1 0 0 2 3 2 0 0 49 0 1 0 79<br />
Subtotal 0 9 6 3 122 7 18 2 1 1 1 4 3 5 0 0 82 0 1 0 139<br />
CO<br />
119<br />
CT<br />
DC<br />
FL<br />
Cont<strong>in</strong>ues on next page<br />
Association of American <strong>Medical</strong> Colleges
Table 32: U.S. <strong>Medical</strong> School Matriculants by State, <strong>Medical</strong> School, Gender, and Race and<br />
Table 32: U.S. <strong>Medical</strong> School Matriculants Ethnicity, by State, 2011 (cont<strong>in</strong>ued)<br />
<strong>Medical</strong> School, Gender, and Race and Ethnicity*, 2011 (cont<strong>in</strong>ued)<br />
<strong>Diversity</strong> <strong>in</strong> <strong>Medical</strong> <strong>Education</strong>: <strong>Facts</strong> & <strong>Figures</strong> <strong>2012</strong><br />
Hispanic/Non-Hispanic Non-Hispanic Asians Non-Hispanic Other Races<br />
Ameri-<br />
Black can<br />
State/School/Gender Mexi-<br />
Non<br />
or Afri- Indian Native<br />
No<br />
can Other<br />
Hispacan<br />
or Hawa-<br />
Race<br />
UnduAmeriHispa-<br />
Puerto nic or Chi- Asian Pakis- FilipiJapaKoVietna- Other Ameri- Alaska iian or Other Resplicatedcannic<br />
Cuban Rican Lat<strong>in</strong>o nese Indian tani nonesereanmese Asian can Native OPI White Race ponse Foreign Total<br />
University of Central Women 1 2 2 0 35 3 2 2 0 0 2 3 2 1 0 0 21 0 1 0 40<br />
Florida College of Men 1 1 0 0 38 0 4 2 1 0 1 0 2 3 0 0 27 0 1 0 40<br />
Medic<strong>in</strong>e<br />
Subtotal 2 3 2 0 73 3 6 4 1 0 3 3 4 4 0 0 48 0 2 0 80<br />
Women 0 6 6 0 47 4 5 1 0 0 1 2 2 6 0 0 27 0 2 0 59<br />
University of Florida<br />
College of Medic<strong>in</strong>e<br />
Men 0 3 2 1 70 6 3 2 0 0 1 0 2 6 1 0 51 0 0 0 76<br />
Subtotal 0 9 8 1 117 10 8 3 0 0 2 2 4 12 1 0 78 0 2 0 135<br />
University of Miami Women 1 6 11 2 92 6 6 1 3 0 1 2 2 8 0 0 62 0 5 0 110<br />
Leonard M. Miller School Men 0 5 4 0 86 5 7 2 0 0 1 2 2 6 0 0 65 0 1 1 95<br />
of Medic<strong>in</strong>e<br />
Subtotal 1 11 15 2 178 11 13 3 3 0 2 4 4 14 0 0 127 0 6 1 205<br />
Women 2 3 1 0 64 5 8 0 0 1 0 0 0 6 0 0 43 0 2 1 70<br />
Emory University School<br />
of Medic<strong>in</strong>e<br />
Men 1 1 0 1 63 2 6 1 0 2 3 1 1 2 0 0 43 0 4 1 66<br />
Subtotal 3 4 1 1 127 7 14 1 0 3 3 1 1 8 0 0 86 0 6 2 136<br />
<strong>Medical</strong> College of Women 2 3 0 0 87 7 6 2 1 1 9 3 1 10 0 0 53 0 1 0 92<br />
Georgia at Georgia<br />
Men 1 3 0 0 134 5 9 1 1 0 1 2 5 7 0 0 105 0 4 0 138<br />
Health Sciences<br />
University<br />
Subtotal 3 6 0 0 221 12 15 3 2 1 10 5 6 17 0 0 158 0 5 0 230<br />
Women 0 0 1 0 46 1 5 0 1 0 0 3 0 5 0 0 31 0 3 1 47<br />
Mercer University School<br />
of Medic<strong>in</strong>e<br />
Men 0 1 0 0 52 0 3 0 0 0 1 1 1 2 0 0 44 0 1 0 53<br />
Subtotal 0 1 1 0 98 1 8 0 1 0 1 4 1 7 0 0 75 0 4 1 100<br />
Women 0 2 0 2 38 0 1 0 0 0 0 0 0 37 0 0 1 0 0 0 41<br />
Morehouse School of<br />
Medic<strong>in</strong>e<br />
Men 0 2 0 1 12 0 1 0 0 0 0 0 0 9 0 0 2 0 0 0 15<br />
Subtotal 0 4 0 3 50 0 2 0 0 0 0 0 0 46 0 0 3 0 0 0 56<br />
University of Hawaii, Women 0 1 0 0 31 7 0 0 2 19 7 2 1 0 1 0 10 0 1 0 32<br />
John A. Burns School of Men 1 0 0 1 32 8 1 0 6 16 0 1 3 0 0 0 11 0 0 3 34<br />
Medic<strong>in</strong>e<br />
Subtotal 1 1 0 1 63 15 1 0 8 35 7 3 4 0 1 0 21 0 1 3 66<br />
University of Iowa Roy J. Women 5 1 0 0 55 6 1 0 1 0 1 1 2 2 0 0 38 0 2 2 61<br />
and Lucille A. Carver Men 5 1 0 0 81 5 5 0 0 0 1 1 3 0 0 0 65 0 3 0 87<br />
College of Medic<strong>in</strong>e<br />
Subtotal 10 2 0 0 136 11 6 0 1 0 2 2 5 2 0 0 103 0 5 2 148<br />
Chicago <strong>Medical</strong> School Women 1 0 0 0 94 11 18 2 3 2 5 1 2 6 0 0 49 0 1 2 95<br />
at Rosal<strong>in</strong>d Frankl<strong>in</strong><br />
Men 2 0 0 0 94 10 15 4 4 1 4 3 5 5 1 0 43 0 3 4 96<br />
University of Medic<strong>in</strong>e &<br />
Science<br />
Subtotal 3 0 0 0 188 21 33 6 7 3 9 4 7 11 1 0 92 0 4 6 191<br />
Loyola University Women 2 2 0 4 64 6 0 0 2 0 0 0 0 8 1 0 50 0 1 0 71<br />
Chicago Stritch School of Men 3 2 0 0 74 1 3 1 2 0 1 0 1 1 0 0 64 0 2 0 79<br />
Medic<strong>in</strong>e<br />
Subtotal 5 4 0 4 138 7 3 1 4 0 1 0 1 9 1 0 114 0 3 0 150<br />
Northwestern University Women 7 4 2 0 67 4 6 0 0 0 4 1 1 5 1 1 45 1 1 2 80<br />
The Fe<strong>in</strong>berg School of Men 2 4 0 3 82 12 13 1 0 0 2 0 2 3 1 0 51 0 2 1 92<br />
Medic<strong>in</strong>e<br />
Subtotal 9 8 2 3 149 16 19 1 0 0 6 1 3 8 2 1 96 1 3 3 172<br />
120<br />
GA<br />
HI<br />
IA<br />
Association of American <strong>Medical</strong> Colleges<br />
Cont<strong>in</strong>ues on next page
Table 32: U.S. <strong>Medical</strong> School Matriculants by State, <strong>Medical</strong> School, Gender, and Race and<br />
Table 32: U.S. <strong>Medical</strong> School Matriculants Ethnicity, by State, 2011 (cont<strong>in</strong>ued)<br />
<strong>Medical</strong> School, Gender, and Race and Ethnicity*, 2011 (cont<strong>in</strong>ued)<br />
<strong>Diversity</strong> <strong>in</strong> <strong>Medical</strong> <strong>Education</strong>: <strong>Facts</strong> & <strong>Figures</strong> <strong>2012</strong><br />
Hispanic/Non-Hispanic Non-Hispanic Asians Non-Hispanic Other Races<br />
Ameri-<br />
Black can<br />
State/School/Gender Mexi-<br />
Non<br />
or Afri- Indian Native<br />
No<br />
can Other<br />
Hispacan<br />
or Hawa-<br />
Race<br />
UnduAmeriHispa-<br />
Puerto nic or Chi- Asian Pakis- FilipiJapaKoVietna- Other Ameri- Alaska iian or Other Resplicatedcannic<br />
Cuban Rican Lat<strong>in</strong>o nese Indian tani nonesereanmese Asian can Native OPI White Race ponse Foreign Total<br />
Rush <strong>Medical</strong> College of Women 1 3 3 0 60 1 7 1 0 0 2 0 4 1 1 1 42 0 3 0 67<br />
Rush University <strong>Medical</strong> Men 2 3 1 1 55 0 5 0 3 0 1 1 0 2 1 0 43 0 1 0 62<br />
Center<br />
Subtotal 3 6 4 1 115 1 12 1 3 0 3 1 4 3 2 1 85 0 4 0 129<br />
Southern Ill<strong>in</strong>ois Women 0 0 0 0 38 1 2 0 0 0 1 1 1 5 0 0 29 0 0 0 38<br />
University School of Men 0 0 0 0 34 0 0 0 0 0 1 0 0 2 0 0 30 0 1 0 34<br />
Medic<strong>in</strong>e<br />
Subtotal 0 0 0 0 72 1 2 0 0 0 2 1 1 7 0 0 59 0 1 0 72<br />
University of Chicago Women 1 0 1 2 39 4 1 0 0 0 3 0 1 2 0 0 24 0 5 0 43<br />
Division of the Biological<br />
Men 4 0 0 3 38 4 7 0 0 0 0 0 0 4 0 0 24 0 2 0 45<br />
Sciences The Pritzker<br />
School of Medic<strong>in</strong>e Subtotal 5 0 1 5 77 8 8 0 0 0 3 0 1 6 0 0 48 0 7 0 88<br />
Women 12 10 3 0 130 21 16 2 1 1 8 1 2 18 0 1 59 0 3 0 155<br />
University of Ill<strong>in</strong>ois<br />
College of Medic<strong>in</strong>e<br />
Men 11 8 3 1 142 7 15 7 0 1 3 2 5 10 1 0 88 0 4 0 163<br />
Subtotal 23 18 6 1 272 28 31 9 1 2 11 3 7 28 1 1 147 0 7 0 318<br />
Women 1 3 2 0 142 9 7 0 1 1 2 1 3 16 1 0 103 0 3 1 148<br />
Indiana University School<br />
of Medic<strong>in</strong>e<br />
Men 4 3 0 1 172 4 9 2 0 0 2 0 1 7 0 0 142 0 4 2 180<br />
Subtotal 5 6 2 1 314 13 16 2 1 1 4 1 4 23 1 0 245 0 7 3 328<br />
Women 4 1 0 0 78 0 1 0 0 1 3 3 1 7 1 0 65 0 1 0 83<br />
University of Kansas<br />
School of Medic<strong>in</strong>e<br />
Men 5 1 1 0 101 0 2 0 0 1 0 2 3 6 1 0 88 0 1 0 108<br />
Subtotal 9 2 1 0 179 0 3 0 0 2 3 5 4 13 2 0 153 0 2 0 191<br />
Women 0 1 0 0 44 1 4 0 0 0 1 0 1 3 0 0 33 0 0 1 45<br />
University of Kentucky<br />
College of Medic<strong>in</strong>e<br />
Men 2 1 0 1 64 1 2 0 0 1 1 0 0 1 0 0 54 0 2 3 68<br />
Subtotal 2 2 0 1 108 2 6 0 0 1 2 0 1 4 0 0 87 0 2 4 113<br />
Women 0 0 1 1 82 0 4 0 1 0 1 0 3 7 0 0 67 0 1 0 84<br />
University of Louisville<br />
School of Medic<strong>in</strong>e<br />
Men 0 1 0 0 75 3 3 0 0 0 0 1 1 1 0 0 66 0 1 0 76<br />
Subtotal 0 1 1 1 157 3 7 0 1 0 1 1 4 8 0 0 133 0 2 0 160<br />
Louisiana State Women 0 3 0 0 79 1 4 1 0 0 0 2 0 7 0 0 65 0 1 0 82<br />
University School of Men 0 2 1 0 102 1 6 0 0 0 2 2 1 2 0 0 85 0 4 0 105<br />
Medic<strong>in</strong>e <strong>in</strong> New Orleans<br />
Subtotal 0 5 1 0 181 2 10 1 0 0 2 4 1 9 0 0 150 0 5 0 187<br />
Louisiana State Women 0 3 0 0 46 0 0 0 0 0 0 0 4 4 0 0 39 0 0 0 49<br />
University School of Men 0 1 1 1 67 0 3 1 0 0 1 0 0 1 0 0 61 0 0 0 69<br />
Medic<strong>in</strong>e <strong>in</strong> Shreveport<br />
Subtotal 0 4 1 1 113 0 3 1 0 0 1 0 4 5 0 0 100 0 0 0 118<br />
Women 1 0 0 0 84 1 6 0 3 2 2 0 2 2 0 0 65 0 5 2 85<br />
Tulane University School<br />
of Medic<strong>in</strong>e<br />
Men 1 4 1 0 97 8 1 1 3 0 1 4 3 3 0 1 69 0 6 0 103<br />
Subtotal 2 4 1 0 181 9 7 1 6 2 3 4 5 5 0 1 134 0 11 2 188<br />
Women 2 6 2 0 77 8 9 1 0 1 5 2 2 4 1 0 46 0 3 3 87<br />
Boston University School<br />
of Medic<strong>in</strong>e<br />
Men 1 5 0 0 81 8 12 0 0 0 4 1 4 4 0 0 50 0 3 2 87<br />
Subtotal 3 11 2 0 158 16 21 1 0 1 9 3 6 8 1 0 96 0 6 5 174<br />
IL<br />
121<br />
IN<br />
KS<br />
KY<br />
LA<br />
Cont<strong>in</strong>ues on next page<br />
Association of American <strong>Medical</strong> Colleges
Table 32: U.S. <strong>Medical</strong> School Matriculants by State, <strong>Medical</strong> School, Gender, and Race and<br />
Ethnicity, 2011 (cont<strong>in</strong>ued)<br />
Table 32: U.S. <strong>Medical</strong> School Matriculants by State, <strong>Medical</strong> School, Gender, and Race and Ethnicity*, 2011 (cont<strong>in</strong>ued)<br />
<strong>Diversity</strong> <strong>in</strong> <strong>Medical</strong> <strong>Education</strong>: <strong>Facts</strong> & <strong>Figures</strong> <strong>2012</strong><br />
Hispanic/Non-Hispanic Non-Hispanic Asians Non-Hispanic Other Races<br />
Ameri-<br />
Black can<br />
State/School/Gender Mexi-<br />
Non<br />
or Afri- Indian Native<br />
No<br />
can Other<br />
Hispacan<br />
or Hawa-<br />
Race<br />
UnduAmeriHispa-<br />
Puerto nic or Chi- Asian Pakis- FilipiJapaKoVietna- Other Ameri- Alaska iian or Other Resplicatedcannic<br />
Cuban Rican Lat<strong>in</strong>o nese Indian tani nonesereanmese Asian can Native OPI White Race ponse Foreign Total<br />
Women 2 3 1 2 70 16 6 0 0 2 4 0 1 4 0 0 32 0 5 6 77<br />
Harvard <strong>Medical</strong> School Men 3 4 0 2 79 10 11 0 0 0 4 1 1 6 0 0 41 0 5 4 88<br />
Subtotal 5 7 1 4 149 26 17 0 0 2 8 1 2 10 0 0 73 0 10 10 165<br />
Women 0 5 1 0 87 4 6 1 0 1 3 1 0 3 0 0 67 0 5 0 93<br />
Tufts University School<br />
of Medic<strong>in</strong>e<br />
Men 3 2 0 0 103 9 4 2 1 1 3 1 4 4 1 0 70 0 5 0 108<br />
Subtotal 3 7 1 0 190 13 10 3 1 2 6 2 4 7 1 0 137 0 10 0 201<br />
University of<br />
Women 0 0 0 0 68 3 4 0 0 0 0 1 0 3 0 0 55 0 3 0 68<br />
Massachusetts <strong>Medical</strong> Men 0 0 0 1 56 3 4 0 0 0 0 2 1 4 0 0 42 0 1 0 57<br />
School<br />
Subtotal 0 0 0 1 124 6 8 0 0 0 0 3 1 7 0 0 97 0 4 0 125<br />
Women 0 0 0 0 57 10 4 0 0 1 3 1 1 6 0 0 30 0 2 1 57<br />
Johns Hopk<strong>in</strong>s University<br />
School of Medic<strong>in</strong>e<br />
Men 0 1 1 0 61 8 8 0 0 1 2 1 2 8 0 0 29 0 4 3 63<br />
Subtotal 0 1 1 0 118 18 12 0 0 2 5 2 3 14 0 0 59 0 6 4 120<br />
Uniformed Services Women 3 1 0 4 46 3 0 0 1 1 3 4 1 2 0 0 32 0 3 0 53<br />
University of the Health<br />
Men 4 3 0 0 113 13 0 0 1 0 7 1 3 2 1 0 85 0 4 0 119<br />
Sciences F. Edward<br />
Hebert School of Subtotal 7 4 0 4 159 16 0 0 2 1 10 5 4 4 1 0 117 0 7 0 172<br />
Women 0 2 1 0 81 10 4 0 0 0 4 1 0 5 0 0 50 1 7 0 84<br />
University of Maryland<br />
School of Medic<strong>in</strong>e<br />
Men 0 1 0 0 74 5 3 2 2 0 1 2 0 3 0 0 52 1 2 1 75<br />
Subtotal 0 3 1 0 155 15 7 2 2 0 5 3 0 8 0 0 102 2 9 1 159<br />
Michigan State University Women 2 4 1 0 97 7 5 2 5 0 1 4 7 9 0 0 61 0 1 1 103<br />
College of Human Men 0 1 0 0 96 3 4 1 1 0 1 1 5 3 0 0 76 0 2 4 97<br />
Medic<strong>in</strong>e<br />
Subtotal 2 5 1 0 193 10 9 3 6 0 2 5 12 12 0 0 137 0 3 5 200<br />
Oakland University Women 0 1 0 0 22 1 0 1 0 0 0 0 0 0 0 0 20 0 0 0 23<br />
William Beaumont Men 0 1 0 0 26 1 4 2 0 0 1 0 0 1 0 0 17 0 1 0 27<br />
School of Medic<strong>in</strong>e<br />
Subtotal 0 2 0 0 48 2 4 3 0 0 1 0 0 1 0 0 37 0 1 0 50<br />
Women 1 2 1 1 78 14 4 2 0 0 1 1 2 4 1 0 47 0 4 0 82<br />
University of Michigan<br />
<strong>Medical</strong> School<br />
Men 0 4 1 1 83 9 6 1 0 1 4 0 3 5 0 0 57 0 2 0 89<br />
Subtotal 1 6 2 2 161 23 10 3 0 1 5 1 5 9 1 0 104 0 6 0 171<br />
Women 2 1 0 0 126 10 13 3 0 1 7 1 3 12 1 0 73 0 2 10 129<br />
Wayne State University<br />
School of Medic<strong>in</strong>e<br />
Men 0 0 0 0 161 8 14 6 4 2 4 2 1 2 0 0 113 0 4 6 161<br />
Subtotal 2 1 0 0 287 18 27 9 4 3 11 3 4 14 1 0 186 0 6 16 290<br />
Women 1 0 0 0 21 5 4 0 0 1 0 1 0 1 0 0 12 0 0 0 22<br />
Mayo <strong>Medical</strong> School Men 1 1 0 0 26 1 1 0 0 0 1 0 0 1 1 0 18 0 1 3 28<br />
Subtotal 2 1 0 0 47 6 5 0 0 1 1 1 0 2 1 0 30 0 1 3 50<br />
Women 2 0 0 0 109 4 2 0 0 0 0 1 5 6 3 0 86 0 3 2 111<br />
University of M<strong>in</strong>nesota<br />
<strong>Medical</strong> School<br />
Men 1 0 0 0 118 3 2 2 0 0 2 2 0 2 1 0 99 0 6 0 119<br />
Subtotal 3 0 0 0 227 7 4 2 0 0 2 3 5 8 4 0 185 0 9 2 230<br />
MA<br />
122<br />
MD<br />
MI<br />
MN<br />
Association of American <strong>Medical</strong> Colleges<br />
Cont<strong>in</strong>ues on next page
Table 32: U.S. <strong>Medical</strong> School Matriculants by State, <strong>Medical</strong> School, Gender, and Race and<br />
Table 32: U.S. <strong>Medical</strong> School Matriculants Ethnicity, by State, 2011 (cont<strong>in</strong>ued)<br />
<strong>Medical</strong> School, Gender, and Race and Ethnicity*, 2011 (cont<strong>in</strong>ued)<br />
<strong>Diversity</strong> <strong>in</strong> <strong>Medical</strong> <strong>Education</strong>: <strong>Facts</strong> & <strong>Figures</strong> <strong>2012</strong><br />
Hispanic/Non-Hispanic Non-Hispanic Asians Non-Hispanic Other Races<br />
Ameri-<br />
Black can<br />
State/School/Gender Mexi-<br />
Non<br />
or Afri- Indian Native<br />
No<br />
can Other<br />
Hispacan<br />
or Hawa-<br />
Race<br />
UnduAmeriHispa-<br />
Puerto nic or Chi- Asian Pakis- FilipiJapaKoVietna- Other Ameri- Alaska iian or Other Resplicatedcannic<br />
Cuban Rican Lat<strong>in</strong>o nese Indian tani nonesereanmese Asian can Native OPI White Race ponse Foreign Total<br />
Women 2 1 1 0 81 10 7 0 1 2 6 1 2 8 0 0 43 0 3 2 85<br />
Sa<strong>in</strong>t Louis University<br />
School of Medic<strong>in</strong>e<br />
Men 0 2 0 0 88 12 2 2 0 2 2 3 3 3 0 0 60 0 2 3 90<br />
Subtotal 2 3 1 0 169 22 9 2 1 4 8 4 5 11 0 0 103 0 5 5 175<br />
University of Missouri- Women 1 2 1 0 48 1 1 1 0 0 1 2 1 3 2 0 36 0 2 0 51<br />
Columbia School of Men 0 1 0 0 52 1 2 0 0 0 0 1 1 2 1 0 45 0 0 0 53<br />
Medic<strong>in</strong>e<br />
Subtotal 1 3 1 0 100 2 3 1 0 0 1 3 2 5 3 0 81 0 2 0 104<br />
University of Missouri- Women 0 2 0 0 65 0 1 1 0 0 0 0 32 2 1 0 20 0 8 0 67<br />
Kansas City School of Men 0 1 0 0 47 0 2 0 0 0 0 0 11 5 0 0 21 0 8 0 48<br />
Medic<strong>in</strong>e<br />
Subtotal 0 3 0 0 112 0 3 1 0 0 0 0 43 7 1 0 41 0 16 0 115<br />
Wash<strong>in</strong>gton University <strong>in</strong> Women 2 0 0 1 54 16 4 0 0 1 5 0 1 4 0 0 27 0 0 1 57<br />
St. Louis School of Men 2 0 0 0 62 12 7 1 1 0 0 0 2 8 0 0 32 0 2 1 64<br />
Medic<strong>in</strong>e<br />
Subtotal 4 0 0 1 116 28 11 1 1 1 5 0 3 12 0 0 59 0 2 2 121<br />
Women 0 1 0 0 55 0 3 1 0 0 1 1 0 9 0 0 41 0 0 0 56<br />
University of Mississippi<br />
School of Medic<strong>in</strong>e<br />
Men 0 0 0 1 78 0 3 0 0 1 0 3 0 6 1 0 65 0 1 0 79<br />
Subtotal 0 1 0 1 133 0 6 1 0 1 1 4 0 15 1 0 106 0 1 0 135<br />
Women 2 3 1 0 47 12 2 1 0 0 1 0 1 12 0 0 17 0 1 2 53<br />
Duke University School<br />
of Medic<strong>in</strong>e<br />
Men 2 1 1 1 44 3 7 0 0 0 1 0 0 6 0 0 23 0 1 3 49<br />
Subtotal 4 4 2 1 91 15 9 1 0 0 2 0 1 18 0 0 40 0 2 5 102<br />
The Brody School of Women 2 1 0 0 37 2 3 1 0 0 0 1 2 5 1 0 26 0 0 0 40<br />
Medic<strong>in</strong>e at East Men 0 0 0 0 38 0 5 0 0 0 0 0 0 2 1 0 31 0 1 0 38<br />
Carol<strong>in</strong>a University<br />
Subtotal 2 1 0 0 75 2 8 1 0 0 0 1 2 7 2 0 57 0 1 0 78<br />
University of North Women 1 2 0 1 81 4 7 1 0 1 2 1 0 9 0 0 56 0 3 0 85<br />
Carol<strong>in</strong>a at Chapel Hill Men 1 4 1 0 79 4 9 1 0 0 0 0 1 6 1 0 60 0 3 0 85<br />
School of Medic<strong>in</strong>e<br />
Subtotal 2 6 1 1 160 8 16 2 0 1 2 1 1 15 1 0 116 0 6 0 170<br />
Wake Forest School of Women 0 1 0 0 53 4 1 0 1 0 0 0 1 7 1 0 39 0 2 0 54<br />
Medic<strong>in</strong>e of Wake Forest Men 0 1 0 0 65 4 3 0 1 0 2 1 3 6 0 0 45 0 3 0 66<br />
Baptist <strong>Medical</strong> Center<br />
Subtotal 0 2 0 0 118 8 4 0 2 0 2 1 4 13 1 0 84 0 5 0 120<br />
University of North Women 1 0 0 0 28 0 0 0 0 0 0 0 0 1 4 0 25 0 0 0 29<br />
Dakota School of<br />
Men 0 0 0 0 33 0 0 0 0 0 0 0 0 0 3 0 31 0 0 0 33<br />
Medic<strong>in</strong>e and Health<br />
Sciences<br />
Subtotal 1 0 0 0 61 0 0 0 0 0 0 0 0 1 7 0 56 0 0 0 62<br />
Women 2 1 1 0 77 4 2 0 1 3 2 4 3 2 0 0 60 0 1 0 81<br />
Creighton University<br />
School of Medic<strong>in</strong>e<br />
Men 1 3 0 0 65 3 1 0 1 2 2 1 0 0 0 0 57 0 0 0 69<br />
Subtotal 3 4 1 0 142 7 3 0 2 5 4 5 3 2 0 0 117 0 1 0 150<br />
Women 0 0 0 0 50 2 0 0 0 0 0 0 0 2 0 0 46 0 1 0 50<br />
University of Nebraska<br />
College of Medic<strong>in</strong>e<br />
Men 0 0 1 0 73 0 4 0 1 0 1 1 1 1 0 0 63 0 3 0 74<br />
Subtotal 0 0 1 0 123 2 4 0 1 0 1 1 1 3 0 0 109 0 4 0 124<br />
MO<br />
123<br />
MS<br />
NC<br />
ND<br />
NE<br />
Cont<strong>in</strong>ues on next page<br />
Association of American <strong>Medical</strong> Colleges
Table 32: U.S. <strong>Medical</strong> School Matriculants by State, <strong>Medical</strong> School, Gender, and Race and<br />
Ethnicity, 2011 (cont<strong>in</strong>ued)<br />
Table 32: U.S. <strong>Medical</strong> School Matriculants by State, <strong>Medical</strong> School, Gender, and Race and Ethnicity*, 2011 (cont<strong>in</strong>ued)<br />
<strong>Diversity</strong> <strong>in</strong> <strong>Medical</strong> <strong>Education</strong>: <strong>Facts</strong> & <strong>Figures</strong> <strong>2012</strong><br />
Hispanic/Non-Hispanic Non-Hispanic Asians Non-Hispanic Other Races<br />
Ameri-<br />
Black can<br />
State/School/Gender Mexi-<br />
Non<br />
or Afri- Indian Native<br />
No<br />
can Other<br />
Hispacan<br />
or Hawa-<br />
Race<br />
UnduAmeriHispa-<br />
Puerto nic or Chi- Asian Pakis- FilipiJapaKoVietna- Other Ameri- Alaska iian or Other Resplicatedcannic<br />
Cuban Rican Lat<strong>in</strong>o nese Indian tani nonesereanmese Asian can Native OPI White Race ponse Foreign Total<br />
Women 3 0 1 1 40 3 6 0 0 4 2 0 3 1 0 0 21 0 1 3 45<br />
Dartmouth <strong>Medical</strong><br />
School<br />
Men 4 4 0 1 36 4 3 1 0 0 1 2 1 1 1 0 20 0 0 6 45<br />
Subtotal 7 4 1 2 76 7 9 1 0 4 3 2 4 2 1 0 41 0 1 9 90<br />
University of Medic<strong>in</strong>e Women 0 5 1 0 63 9 19 0 0 0 1 1 2 10 0 0 15 0 7 0 68<br />
and Dentistry of New<br />
Men 0 6 3 1 100 10 23 3 1 1 5 1 4 5 1 0 48 0 5 0 110<br />
Jersey-New Jersey<br />
<strong>Medical</strong> School Subtotal 0 11 4 1 163 19 42 3 1 1 6 2 6 15 1 0 63 0 12 0 178<br />
University of Medic<strong>in</strong>e Women 0 2 1 1 70 3 10 2 0 1 8 0 1 6 0 0 35 0 5 0 74<br />
and Dentistry of New<br />
Men 0 2 0 1 53 7 7 1 0 0 0 0 1 3 0 0 34 0 1 0 56<br />
Jersey-Robert Wood<br />
Johnson <strong>Medical</strong> School Subtotal 0 4 1 2 123 10 17 3 0 1 8 0 2 9 0 0 69 0 6 0 130<br />
Women 7 9 0 0 35 1 2 0 0 0 0 1 1 1 3 0 25 0 3 0 50<br />
University of New Mexico<br />
School of Medic<strong>in</strong>e<br />
Men 14 5 0 0 23 1 1 1 0 0 0 0 1 1 1 0 18 0 0 0 42<br />
Subtotal 21 14 0 0 58 2 3 1 0 0 0 1 2 2 4 0 43 0 3 0 92<br />
Women 2 0 0 1 26 4 2 0 1 1 0 0 0 1 0 0 17 0 1 0 29<br />
University of Nevada<br />
School of Medic<strong>in</strong>e<br />
Men 2 0 0 0 31 2 2 0 0 0 2 1 0 0 0 0 25 0 2 0 33<br />
Subtotal 4 0 0 1 57 6 4 0 1 1 2 1 0 1 0 0 42 0 3 0 62<br />
Women 1 0 0 0 64 8 11 0 0 0 4 2 3 5 0 0 32 0 3 0 65<br />
Albany <strong>Medical</strong> College Men 3 1 0 0 65 9 12 1 0 0 2 1 4 2 0 0 35 0 2 0 69<br />
Subtotal 4 1 0 0 129 17 23 1 0 0 6 3 7 7 0 0 67 0 5 0 134<br />
Albert E<strong>in</strong>ste<strong>in</strong> College of Women 0 8 0 4 70 9 5 0 1 0 3 1 2 2 0 0 41 0 5 2 81<br />
Medic<strong>in</strong>e of Yeshiva Men 0 3 1 1 97 9 6 2 0 1 4 2 4 4 0 0 65 0 1 1 102<br />
University<br />
Subtotal 0 11 1 5 167 18 11 2 1 1 7 3 6 6 0 0 106 0 6 3 183<br />
Columbia University Women 2 6 2 2 71 9 1 0 0 1 1 0 1 10 0 0 48 0 3 2 82<br />
College of Physicians Men 0 7 1 0 76 16 9 0 0 0 4 0 1 5 1 0 41 0 1 4 84<br />
and Surgeons<br />
Subtotal 2 13 3 2 147 25 10 0 0 1 5 0 2 15 1 0 89 0 4 6 166<br />
Women 1 1 0 0 18 3 1 0 1 0 0 0 1 1 1 0 11 0 2 0 20<br />
Hofstra North Shore - LIJ<br />
School of Medic<strong>in</strong>e<br />
Men 0 0 0 0 20 1 1 0 1 0 0 0 0 1 1 0 14 0 2 0 20<br />
Subtotal 1 1 0 0 38 4 2 0 2 0 0 0 1 2 2 0 25 0 4 0 40<br />
Women 1 4 3 0 59 6 4 0 0 2 3 0 3 6 0 0 35 0 3 2 65<br />
Mount S<strong>in</strong>ai School of<br />
Medic<strong>in</strong>e<br />
Men 1 7 1 2 65 5 5 1 1 0 3 0 2 4 0 0 42 0 3 1 75<br />
Subtotal 2 11 4 2 124 11 9 1 1 2 6 0 5 10 0 0 77 0 6 3 140<br />
Women 3 4 1 1 81 10 11 0 3 0 3 1 3 8 0 0 44 0 2 0 90<br />
New York <strong>Medical</strong><br />
College<br />
Men 1 4 2 0 101 12 4 3 3 1 5 2 3 3 0 0 69 1 1 0 108<br />
Subtotal 4 8 3 1 182 22 15 3 6 1 8 3 6 11 0 0 113 1 3 0 198<br />
Women 1 5 2 3 67 5 7 1 0 2 4 1 4 3 0 0 44 0 1 1 76<br />
New York University<br />
School of Medic<strong>in</strong>e<br />
Men 3 1 1 2 77 8 10 1 0 0 2 0 2 4 0 0 45 0 6 2 84<br />
Subtotal 4 6 3 5 144 13 17 2 0 2 6 1 6 7 0 0 89 0 7 3 160<br />
NH<br />
NJ<br />
124<br />
NM<br />
NV<br />
NY<br />
Association of American <strong>Medical</strong> Colleges<br />
Cont<strong>in</strong>ues on next page
Table 32: U.S. <strong>Medical</strong> School Matriculants by State, <strong>Medical</strong> School, Gender, and Race and<br />
Table 32: U.S. <strong>Medical</strong> School Matriculants Ethnicity, by State, 2011 (cont<strong>in</strong>ued)<br />
<strong>Medical</strong> School, Gender, and Race and Ethnicity*, 2011 (cont<strong>in</strong>ued)<br />
<strong>Diversity</strong> <strong>in</strong> <strong>Medical</strong> <strong>Education</strong>: <strong>Facts</strong> & <strong>Figures</strong> <strong>2012</strong><br />
Hispanic/Non-Hispanic Non-Hispanic Asians Non-Hispanic Other Races<br />
Ameri-<br />
Black can<br />
State/School/Gender Mexi-<br />
Non<br />
or Afri- Indian Native<br />
No<br />
can Other<br />
Hispacan<br />
or Hawa-<br />
Race<br />
UnduAmeriHispa-<br />
Puerto nic or Chi- Asian Pakis- FilipiJapaKoVietna- Other Ameri- Alaska iian or Other Resplicatedcannic<br />
Cuban Rican Lat<strong>in</strong>o nese Indian tani nonesereanmese Asian can Native OPI White Race ponse Foreign Total<br />
State University of New Women 0 5 0 3 75 15 5 2 0 1 3 1 4 7 0 0 33 0 8 0 81<br />
York Downstate <strong>Medical</strong><br />
Men 3 2 0 2 95 21 12 2 2 0 3 2 1 2 0 0 44 0 11 0 102<br />
Center College of<br />
Medic<strong>in</strong>e<br />
Subtotal 3 7 0 5 170 36 17 4 2 1 6 3 5 9 0 0 77 0 19 0 183<br />
State University of New Women 0 2 2 1 56 3 3 1 2 0 4 0 0 9 0 0 33 0 2 2 60<br />
York Upstate <strong>Medical</strong> Men 0 5 0 0 90 7 6 3 0 0 1 0 1 6 1 0 67 0 3 1 95<br />
University<br />
Subtotal 0 7 2 1 146 10 9 4 2 0 5 0 1 15 1 0 100 0 5 3 155<br />
Women 1 2 0 3 49 6 2 1 0 1 2 0 2 4 0 0 27 0 5 0 54<br />
Stony Brookk University<br />
School of Medic<strong>in</strong>e<br />
Men 1 3 0 0 66 4 8 1 0 1 1 3 1 3 0 0 42 0 4 0 70<br />
Subtotal 2 5 0 3 115 10 10 2 0 2 3 3 3 7 0 0 69 0 9 0 124<br />
University at Buffalo Women 0 0 1 2 54 5 6 1 2 2 2 0 1 2 1 0 32 0 3 0 56<br />
State University of New<br />
Men 1 0 0 1 86 7 7 3 3 0 8 0 1 4 0 0 49 0 4 0 88<br />
York School of Medic<strong>in</strong>e<br />
& Biomedical Sciences Subtotal 1 0 1 3 140 12 13 4 5 2 10 0 2 6 1 0 81 0 7 0 144<br />
University of Rochester Women 4 3 0 0 43 2 3 0 0 0 1 2 1 4 0 0 29 0 1 0 50<br />
School of Medic<strong>in</strong>e and Men 1 1 0 0 50 3 3 0 1 0 1 0 0 4 0 0 36 0 1 1 52<br />
Dentistry<br />
Subtotal 5 4 0 0 93 5 6 0 1 0 2 2 1 8 0 0 65 0 2 1 102<br />
Women 2 0 0 0 48 6 1 0 0 1 1 0 2 4 1 0 29 0 3 0 50<br />
Weill Cornell <strong>Medical</strong><br />
College<br />
Men 0 6 1 1 43 4 4 0 0 1 1 2 0 2 0 0 31 0 1 0 51<br />
Subtotal 2 6 1 1 91 10 5 0 0 2 2 2 2 6 1 0 60 0 4 0 101<br />
Case Western Reserve Women 1 3 0 2 85 20 6 0 0 5 3 0 4 3 0 0 43 0 6 3 90<br />
University School of Men 1 2 0 0 103 14 7 0 0 1 3 3 7 3 0 0 57 0 7 7 106<br />
Medic<strong>in</strong>e<br />
Subtotal 2 5 0 2 188 34 13 0 0 6 6 3 11 6 0 0 100 0 13 10 196<br />
Women 0 0 0 0 53 0 19 1 0 0 4 0 1 1 0 0 28 0 0 0 53<br />
Northeast Ohio <strong>Medical</strong><br />
University<br />
Men 0 0 1 1 72 1 13 2 0 0 2 3 1 1 2 0 45 0 4 0 74<br />
Subtotal 0 0 1 1 125 1 32 3 0 0 6 3 2 2 2 0 73 0 4 0 127<br />
Women 2 3 0 1 114 16 12 0 1 1 3 0 0 18 0 0 67 0 4 0 120<br />
Ohio State University<br />
College of Medic<strong>in</strong>e<br />
Men 4 1 1 0 138 8 16 2 0 1 2 3 5 7 0 0 86 0 9 0 144<br />
Subtotal 6 4 1 1 252 24 28 2 1 2 5 3 5 25 0 0 153 0 13 0 264<br />
Women 0 1 0 0 77 4 4 0 0 0 4 0 2 3 1 0 57 0 5 0 78<br />
The University of Toledo<br />
College of Medic<strong>in</strong>e<br />
Men 1 0 0 0 98 7 5 3 0 2 2 3 2 4 0 0 70 0 3 0 99<br />
Subtotal 1 1 0 0 175 11 9 3 0 2 6 3 4 7 1 0 127 0 8 0 177<br />
Women 1 1 0 2 77 8 3 1 0 0 2 0 1 5 0 0 58 0 2 0 81<br />
University of C<strong>in</strong>c<strong>in</strong>nati<br />
College of Medic<strong>in</strong>e<br />
Men 2 0 0 0 87 4 11 0 0 0 4 1 1 3 1 0 62 0 3 0 89<br />
Subtotal 3 1 0 2 164 12 14 1 0 0 6 1 2 8 1 0 120 0 5 0 170<br />
Wright State University Women 0 0 0 0 43 2 3 1 0 2 1 0 0 12 0 0 22 0 2 0 43<br />
Boonshoft School of Men 0 0 0 0 60 2 3 0 0 0 2 2 1 2 1 0 48 0 2 0 60<br />
Medic<strong>in</strong>e<br />
Subtotal 0 0 0 0 103 4 6 1 0 2 3 2 1 14 1 0 70 0 4 0 103<br />
125<br />
OH<br />
Cont<strong>in</strong>ues on next page<br />
Association of American <strong>Medical</strong> Colleges
Table 32: U.S. <strong>Medical</strong> School Matriculants by State, <strong>Medical</strong> School, Gender, and Race and<br />
Table 32: U.S. <strong>Medical</strong> School Matriculants Ethnicity, by State, 2011 (cont<strong>in</strong>ued)<br />
<strong>Medical</strong> School, Gender, and Race and Ethnicity*, 2011 (cont<strong>in</strong>ued)<br />
<strong>Diversity</strong> <strong>in</strong> <strong>Medical</strong> <strong>Education</strong>: <strong>Facts</strong> & <strong>Figures</strong> <strong>2012</strong><br />
Hispanic/Non-Hispanic Non-Hispanic Asians Non-Hispanic Other Races<br />
Ameri-<br />
Black can<br />
State/School/Gender Mexi-<br />
Non<br />
or Afri- Indian Native<br />
No<br />
can Other<br />
Hispacan<br />
or Hawa-<br />
Race<br />
UnduAmeriHispa-<br />
Puerto nic or Chi- Asian Pakis- FilipiJapaKoVietna- Other Ameri- Alaska iian or Other Resplicatedcannic<br />
Cuban Rican Lat<strong>in</strong>o nese Indian tani nonesereanmese Asian can Native OPI White Race ponse Foreign Total<br />
Women 1 1 0 0 68 4 3 1 0 0 1 2 2 0 3 0 54 0 0 0 70<br />
University of Oklahoma<br />
College of Medic<strong>in</strong>e<br />
Men 0 1 0 0 93 3 8 2 1 2 0 5 0 0 12 0 70 0 1 0 94<br />
Subtotal 1 2 0 0 161 7 11 3 1 2 1 7 2 0 15 0 124 0 1 0 164<br />
Oregon Health & Science Women 1 1 0 0 55 4 1 1 1 0 0 1 3 0 0 0 45 0 1 0 57<br />
University School of Men 3 1 0 0 68 3 3 1 0 0 0 2 2 0 0 0 57 0 1 0 71<br />
Medic<strong>in</strong>e<br />
Subtotal 4 2 0 0 123 7 4 2 1 0 0 3 5 0 0 0 102 0 2 0 128<br />
Women 0 4 0 0 126 5 22 2 3 1 5 3 4 12 0 0 67 0 5 0 130<br />
Drexel University College<br />
of Medic<strong>in</strong>e<br />
Men 1 1 0 0 128 13 15 3 2 0 5 1 2 6 0 1 83 0 3 0 130<br />
Subtotal 1 5 0 0 254 18 37 5 5 1 10 4 6 18 0 1 150 0 8 0 260<br />
Jefferson <strong>Medical</strong> Women 1 5 2 1 121 9 19 1 0 1 4 1 5 0 1 0 78 0 4 8 129<br />
College of Thomas Men 3 6 1 1 120 11 11 0 0 0 3 1 2 1 1 0 89 0 3 2 131<br />
Jefferson University<br />
Subtotal 4 11 3 2 241 20 30 1 0 1 7 2 7 1 2 0 167 0 7 10 260<br />
Pennsylvania State Women 1 3 0 0 72 5 4 0 1 1 1 2 0 5 0 0 52 0 4 1 77<br />
University College of Men 0 0 0 0 66 4 5 3 0 0 1 1 0 3 0 0 48 0 4 1 66<br />
Medic<strong>in</strong>e<br />
Subtotal 1 3 0 0 138 9 9 3 1 1 2 3 0 8 0 0 100 0 8 2 143<br />
Raymond and Ruth Women 0 4 1 2 75 10 0 0 0 1 3 2 2 10 0 0 41 0 6 1 82<br />
Perelman School of<br />
Men 5 8 2 0 70 4 7 0 0 1 1 0 1 5 3 0 48 0 3 1 84<br />
Medic<strong>in</strong>e at the<br />
University of<br />
Subtotal 5 12 3 2 145 14 7 0 0 2 4 2 3 15 3 0 89 0 9 2 166<br />
Women 0 4 1 1 95 8 4 0 1 1 3 1 1 12 1 0 64 0 3 0 101<br />
Temple University<br />
School of Medic<strong>in</strong>e<br />
Men 0 6 3 0 102 6 13 0 1 1 2 3 2 1 0 0 72 0 5 0 110<br />
Subtotal 0 10 4 1 197 14 17 0 2 2 5 4 3 13 1 0 136 0 8 0 211<br />
Women 0 0 1 1 31 1 3 0 1 0 1 1 2 3 0 0 21 0 1 0 33<br />
The Commonwealth<br />
<strong>Medical</strong> College<br />
Men 0 2 0 0 30 1 4 0 0 1 0 0 0 1 0 0 23 0 1 0 32<br />
Subtotal 0 2 1 1 61 2 7 0 1 1 1 1 2 4 0 0 44 0 2 0 65<br />
Women 1 2 0 0 68 17 4 0 0 0 2 1 0 9 0 0 36 0 1 0 71<br />
University of Pittsburgh<br />
School of Medic<strong>in</strong>e<br />
Men 3 3 1 0 68 9 6 0 1 2 2 1 4 6 0 0 39 0 3 0 75<br />
Subtotal 4 5 1 0 136 26 10 0 1 2 4 2 4 15 0 0 75 0 4 0 146<br />
Ponce School of Women 0 4 2 30 1 0 0 0 0 0 0 0 0 0 0 0 1 0 0 0 36<br />
Medic<strong>in</strong>e and Health Men 1 1 2 26 3 0 1 0 0 0 0 0 0 1 0 0 1 0 0 0 30<br />
Sciences<br />
Subtotal 1 5 4 56 4 0 1 0 0 0 0 0 0 1 0 0 2 0 0 0 66<br />
Women 4 8 3 16 2 0 0 0 0 0 0 0 0 1 0 0 0 0 1 0 33<br />
San Juan Bautista<br />
School of Medic<strong>in</strong>e<br />
Men 2 8 2 12 7 0 1 0 0 0 0 1 1 2 0 0 1 0 1 0 30<br />
Subtotal 6 16 5 28 9 0 1 0 0 0 0 1 1 3 0 0 1 0 2 0 63<br />
Universidad Central del Women 0 3 2 29 2 1 0 0 0 0 0 0 0 0 0 1 1 0 0 0 33<br />
Caribe School of Men 0 0 2 30 1 0 0 0 0 0 0 0 0 0 0 0 1 0 0 0 32<br />
Medic<strong>in</strong>e<br />
Subtotal 0 3 4 59 3 1 0 0 0 0 0 0 0 0 0 1 2 0 0 0 65<br />
OK<br />
OR<br />
126<br />
PA<br />
PR<br />
Association of American <strong>Medical</strong> Colleges<br />
Cont<strong>in</strong>ues on next page
Table 32: U.S. <strong>Medical</strong> School Matriculants by State, <strong>Medical</strong> School, Gender, and Race and<br />
Table 32: U.S. <strong>Medical</strong> School Matriculants Ethnicity, by State, 2011 (cont<strong>in</strong>ued)<br />
<strong>Medical</strong> School, Gender, and Race and Ethnicity*, 2011 (cont<strong>in</strong>ued)<br />
<strong>Diversity</strong> <strong>in</strong> <strong>Medical</strong> <strong>Education</strong>: <strong>Facts</strong> & <strong>Figures</strong> <strong>2012</strong><br />
Hispanic/Non-Hispanic Non-Hispanic Asians Non-Hispanic Other Races<br />
Ameri-<br />
Black can<br />
State/School/Gender Mexi-<br />
Non<br />
or Afri- Indian Native<br />
No<br />
can Other<br />
Hispacan<br />
or Hawa-<br />
Race<br />
UnduAmeriHispa-<br />
Puerto nic or Chi- Asian Pakis- FilipiJapaKoVietna- Other Ameri- Alaska iian or Other Resplicatedcannic<br />
Cuban Rican Lat<strong>in</strong>o nese Indian tani nonesereanmese Asian can Native OPI White Race ponse Foreign Total<br />
Women 0 0 2 55 0 0 0 0 0 0 0 0 0 0 0 0 0 0 0 0 55<br />
University of Puerto Rico<br />
School of Medic<strong>in</strong>e<br />
Men 0 0 2 56 1 0 0 0 0 0 0 0 1 0 0 0 0 0 0 0 58<br />
Subtotal 0 0 4 111 1 0 0 0 0 0 0 0 1 0 0 0 0 0 0 0 113<br />
The Warren Alpert Women 6 1 2 2 47 7 1 1 0 0 3 0 4 6 0 0 27 0 2 0 57<br />
<strong>Medical</strong> School of Brown Men 3 2 2 0 47 2 6 0 0 0 0 1 1 9 0 0 30 0 0 1 52<br />
University<br />
Subtotal 9 3 4 2 94 9 7 1 0 0 3 1 5 15 0 0 57 0 2 1 109<br />
<strong>Medical</strong> University of Women 1 1 0 4 59 1 3 1 1 0 0 0 0 14 0 0 39 0 1 0 65<br />
South Carol<strong>in</strong>a College Men 1 1 1 1 102 1 6 0 0 0 0 0 1 6 0 0 83 0 3 2 106<br />
of Medic<strong>in</strong>e<br />
Subtotal 2 2 1 5 161 2 9 1 1 0 0 0 1 20 0 0 122 0 4 2 171<br />
University of South Women 0 0 0 0 45 2 2 1 0 0 0 2 1 6 0 0 34 0 0 0 45<br />
Carol<strong>in</strong>a School of Men 0 0 0 0 47 1 0 0 1 1 0 2 0 1 0 0 43 0 0 0 47<br />
Medic<strong>in</strong>e<br />
Subtotal 0 0 0 0 92 3 2 1 1 1 0 4 1 7 0 0 77 0 0 0 92<br />
Sanford School of Women 0 1 0 0 22 0 0 0 1 0 0 0 0 0 0 0 21 0 0 0 23<br />
Medic<strong>in</strong>e The University Men 0 0 0 0 31 0 0 0 0 0 0 0 0 0 0 0 30 0 1 0 31<br />
of South Dakota<br />
Subtotal 0 1 0 0 53 0 0 0 1 0 0 0 0 0 0 0 51 0 1 0 54<br />
East Tennessee State Women 0 0 0 0 28 1 0 0 0 1 1 0 0 1 1 0 24 0 1 0 28<br />
University James H.<br />
Men 1 0 0 0 42 0 2 0 0 0 2 0 1 0 0 0 37 0 1 0 43<br />
Quillen College of<br />
Medic<strong>in</strong>e<br />
Subtotal 1 0 0 0 70 1 2 0 0 1 3 0 1 1 1 0 61 0 2 0 71<br />
Women 1 2 1 0 54 0 0 0 0 0 0 0 1 52 1 0 1 0 0 0 58<br />
Meharry <strong>Medical</strong> College Men 1 1 0 1 44 0 0 0 0 0 0 0 2 41 0 0 1 0 0 0 47<br />
Subtotal 2 3 1 1 98 0 0 0 0 0 0 0 3 93 1 0 2 0 0 0 105<br />
University of Tennessee Women 0 1 1 0 69 1 5 1 1 2 0 0 1 9 0 0 54 0 0 0 71<br />
Health Science Center Men 3 0 1 2 89 1 5 0 0 0 1 1 0 8 1 0 72 0 2 0 93<br />
College of Medic<strong>in</strong>e<br />
Subtotal 3 1 2 2 158 2 10 1 1 2 1 1 1 17 1 0 126 0 2 0 164<br />
Women 0 1 2 1 48 4 3 2 0 0 1 0 1 5 0 0 28 0 4 2 52<br />
Vanderbilt University<br />
School of Medic<strong>in</strong>e<br />
Men 4 1 1 0 46 4 5 1 0 1 2 0 2 3 1 0 28 0 1 2 52<br />
Subtotal 4 2 3 1 94 8 8 3 0 1 3 0 3 8 1 0 56 0 5 4 104<br />
Women 6 9 3 1 65 14 10 1 0 0 1 1 3 1 0 0 36 0 3 1 83<br />
Baylor College of<br />
Medic<strong>in</strong>e<br />
Men 3 7 1 0 93 11 12 5 0 1 1 5 1 3 5 0 54 0 3 0 103<br />
Subtotal 9 16 4 1 158 25 22 6 0 1 2 6 4 4 5 0 90 0 6 1 186<br />
Texas A&M Health Women 0 9 0 0 89 2 7 3 2 0 0 4 21 1 0 0 49 0 3 0 98<br />
Science Center College Men 1 11 1 0 87 2 7 2 1 0 4 3 9 2 1 0 57 0 2 1 100<br />
of Medic<strong>in</strong>e<br />
Subtotal 1 20 1 0 176 4 14 5 3 0 4 7 30 3 1 0 106 0 5 1 198<br />
Texas Tech University Women 1 3 0 0 33 1 5 1 1 0 4 1 2 0 0 0 18 0 0 0 37<br />
Health Sciences Center<br />
Men 0 1 0 0 43 4 6 1 2 1 1 1 7 1 1 0 25 0 1 0 44<br />
Paul L. Foster School of<br />
Medic<strong>in</strong>e<br />
Subtotal 1 4 0 0 76 5 11 2 3 1 5 2 9 1 1 0 43 0 1 0 81<br />
RI<br />
127<br />
SC<br />
SD<br />
TN<br />
Cont<strong>in</strong>ues on next page<br />
Association of American <strong>Medical</strong> Colleges
Table 32: U.S. <strong>Medical</strong> School Matriculants by State, <strong>Medical</strong> School, Gender, and Race and<br />
Table 32: U.S. <strong>Medical</strong> School Matriculants Ethnicity, by State, 2011 (cont<strong>in</strong>ued)<br />
<strong>Medical</strong> School, Gender, and Race and Ethnicity*, 2011 (cont<strong>in</strong>ued)<br />
<strong>Diversity</strong> <strong>in</strong> <strong>Medical</strong> <strong>Education</strong>: <strong>Facts</strong> & <strong>Figures</strong> <strong>2012</strong><br />
Hispanic/Non-Hispanic Non-Hispanic Asians Non-Hispanic Other Races<br />
Ameri-<br />
Black can<br />
State/School/Gender Mexi-<br />
Non<br />
or Afri- Indian Native<br />
No<br />
can Other<br />
Hispacan<br />
or Hawa-<br />
Race<br />
UnduAmeriHispa-<br />
Puerto nic or Chi- Asian Pakis- FilipiJapaKoVietna- Other Ameri- Alaska iian or Other Resplicatedcannic<br />
Cuban Rican Lat<strong>in</strong>o nese Indian tani nonesereanmese Asian can Native OPI White Race ponse Foreign Total<br />
Texas Tech University Women 1 10 0 0 56 1 4 2 0 0 0 2 6 1 3 0 39 0 2 0 67<br />
Health Sciences Center Men 1 2 0 0 77 3 5 1 1 0 1 2 9 0 1 0 56 0 0 0 80<br />
School of Medic<strong>in</strong>e<br />
Subtotal 2 12 0 0 133 4 9 3 1 0 1 4 15 1 4 0 95 0 2 0 147<br />
The University of Texas Women 5 5 0 1 101 4 7 1 1 0 2 1 11 7 1 0 66 0 2 0 111<br />
School of Medic<strong>in</strong>e at Men 6 15 0 0 84 6 3 3 1 0 4 3 3 1 0 0 62 0 1 0 105<br />
San Antonio<br />
Subtotal 11 20 0 1 185 10 10 4 2 0 6 4 14 8 1 0 128 0 3 0 216<br />
University of Texas Women 2 18 1 1 92 3 3 0 0 0 0 4 8 35 0 0 40 0 1 5 115<br />
<strong>Medical</strong> Branch School of Men 5 15 0 2 94 9 5 2 0 0 1 5 8 9 0 0 56 0 0 1 115<br />
Medic<strong>in</strong>e<br />
Subtotal 7 33 1 3 186 12 8 2 0 0 1 9 16 44 0 0 96 0 1 6 230<br />
University of Texas Women 4 13 0 0 95 4 2 0 0 1 2 1 3 14 2 0 69 0 1 0 112<br />
<strong>Medical</strong> School at Men 6 10 0 0 111 2 3 3 1 0 1 2 3 4 1 0 92 0 3 0 128<br />
Houston<br />
Subtotal 10 23 0 0 206 6 5 3 1 1 3 3 6 18 3 0 161 0 4 0 240<br />
University of Texas Women 2 4 2 2 106 12 9 3 1 1 3 1 17 4 1 0 57 0 3 1 115<br />
Southwestern <strong>Medical</strong><br />
Men 5 10 0 0 100 15 8 0 0 2 6 0 12 3 0 0 55 0 3 1 115<br />
Center at Dallas<br />
Southwestern <strong>Medical</strong> Subtotal 7 14 2 2 206 27 17 3 1 3 9 1 29 7 1 0 112 0 6 2 230<br />
Women 1 3 0 0 25 2 2 0 0 1 0 0 1 0 0 0 21 0 1 0 30<br />
University of Utah School<br />
of Medic<strong>in</strong>e<br />
Men 0 1 0 0 51 1 0 0 1 1 1 0 1 0 0 0 47 0 1 0 52<br />
Subtotal 1 4 0 0 76 3 2 0 1 2 1 0 2 0 0 0 68 0 2 0 82<br />
Women 0 0 0 2 59 2 3 4 3 0 3 1 2 11 1 0 26 0 8 0 61<br />
Eastern Virg<strong>in</strong>ia <strong>Medical</strong><br />
School<br />
Men 0 0 0 0 80 8 7 0 2 1 2 0 1 3 1 0 57 0 2 0 80<br />
Subtotal 0 0 0 2 139 10 10 4 5 1 5 1 3 14 2 0 83 0 10 0 141<br />
Women 0 3 1 0 68 3 7 1 0 0 2 0 1 7 1 0 40 0 7 2 73<br />
University of Virg<strong>in</strong>ia<br />
School of Medic<strong>in</strong>e<br />
Men 1 6 3 1 72 6 6 2 0 1 2 2 3 5 2 0 42 0 6 1 83<br />
Subtotal 1 9 4 1 140 9 13 3 0 1 4 2 4 12 3 0 82 0 13 3 156<br />
Virg<strong>in</strong>ia Commonwealth Women 3 0 0 1 88 8 13 1 4 1 6 3 1 5 0 0 44 0 4 0 92<br />
University School of Men 0 2 1 0 105 5 17 1 0 0 5 4 5 5 0 0 62 0 3 2 108<br />
Medic<strong>in</strong>e<br />
Subtotal 3 2 1 1 193 13 30 2 4 1 11 7 6 10 0 0 106 0 7 2 200<br />
Women 0 0 0 0 17 1 2 0 0 0 2 0 0 0 0 0 13 0 0 1 17<br />
Virg<strong>in</strong>ia Tech Carilion<br />
School of Medic<strong>in</strong>e<br />
Men 0 0 0 0 25 0 4 1 1 0 0 0 1 0 0 0 16 0 3 0 25<br />
Subtotal 0 0 0 0 42 1 6 1 1 0 2 0 1 0 0 0 29 0 3 1 42<br />
Women 0 2 2 0 51 3 3 0 0 0 0 1 1 1 0 0 39 0 4 0 55<br />
University of Vermont<br />
College of Medic<strong>in</strong>e<br />
Men 1 4 0 0 49 4 3 0 0 1 1 0 0 1 0 0 36 0 3 0 54<br />
Subtotal 1 6 2 0 100 7 6 0 0 1 1 1 1 2 0 0 75 0 7 0 109<br />
Women 6 7 0 1 103 8 3 0 1 2 1 3 3 2 0 0 83 0 4 0 115<br />
University of Wash<strong>in</strong>gton<br />
School of Medic<strong>in</strong>e<br />
Men 6 1 0 0 97 4 3 0 1 2 1 1 4 1 3 0 80 0 2 0 104<br />
Subtotal 12 8 0 1 200 12 6 0 2 4 2 4 7 3 3 0 163 0 6 0 219<br />
TX<br />
128<br />
UT<br />
VA<br />
VT<br />
WA<br />
Association of American <strong>Medical</strong> Colleges<br />
Cont<strong>in</strong>ues on next page
Table 32: U.S. <strong>Medical</strong> School Matriculants by State, <strong>Medical</strong> School, Gender, and Race and<br />
Ethnicity, 2011 (cont<strong>in</strong>ued)<br />
Table 32: U.S. <strong>Medical</strong> School Matriculants by State, <strong>Medical</strong> School, Gender, and Race and Ethnicity*, 2011 (cont<strong>in</strong>ued)<br />
<strong>Diversity</strong> <strong>in</strong> <strong>Medical</strong> <strong>Education</strong>: <strong>Facts</strong> & <strong>Figures</strong> <strong>2012</strong><br />
Hispanic/Non-Hispanic Non-Hispanic Asians Non-Hispanic Other Races<br />
Ameri-<br />
Black can<br />
State/School/Gender Mexi-<br />
Non<br />
or Afri- Indian Native<br />
No<br />
can Other<br />
Hispacan<br />
or Hawa-<br />
Race<br />
UnduAmeriHispa-<br />
Puerto nic or Chi- Asian Pakis- FilipiJapaKoVietna- Other Ameri- Alaska iian or Other Resplicatedcannic<br />
Cuban Rican Lat<strong>in</strong>o nese Indian tani nonesereanmese Asian can Native OPI White Race ponse Foreign Total<br />
Women 2 2 1 1 77 5 9 0 0 1 2 2 2 13 2 0 45 0 1 3 82<br />
<strong>Medical</strong> College of<br />
Wiscons<strong>in</strong><br />
Men 5 1 0 0 117 6 7 1 0 2 3 2 2 5 0 0 86 0 4 0 122<br />
Subtotal 7 3 1 1 194 11 16 1 0 3 5 4 4 18 2 0 131 0 5 3 204<br />
WI<br />
University of Wiscons<strong>in</strong> Women 4 0 0 0 81 5 1 0 0 0 0 2 3 5 0 1 64 0 1 0 85<br />
School of Medic<strong>in</strong>e and Men 5 1 0 0 82 3 3 0 2 0 1 2 0 3 1 0 68 0 1 0 88<br />
Public Health<br />
Subtotal 9 1 0 0 163 8 4 0 2 0 1 4 3 8 1 1 132 0 2 0 173<br />
Marshall University Joan Women 0 0 0 0 22 0 3 0 0 0 0 0 0 0 0 0 18 0 1 0 22<br />
C. Edwards School of Men 0 0 0 0 49 0 1 0 1 1 0 0 0 1 1 0 45 0 1 0 49<br />
Medic<strong>in</strong>e<br />
Subtotal 0 0 0 0 71 0 4 0 1 1 0 0 0 1 1 0 63 0 2 0 71<br />
WV<br />
Women 0 0 0 0 35 1 2 1 0 1 1 1 1 0 1 0 28 0 0 0 35<br />
West Virg<strong>in</strong>ia University<br />
School of Medic<strong>in</strong>e<br />
Men 0 0 0 0 69 3 5 0 0 0 0 1 2 0 0 0 57 0 1 0 69<br />
Subtotal 0 0 0 0 104 4 7 1 0 1 1 2 3 0 1 0 85 0 1 0 104<br />
* Start<strong>in</strong>g <strong>in</strong> 2002, students had the option of report<strong>in</strong>g their race and ethnicity alone or <strong>in</strong> comb<strong>in</strong>ation with some other race and ethnicity, therefore, the unduplicated total was given.<br />
129<br />
Data Source:<strong>AAMC</strong> Data Warehouse: Applicant-Matriculant File, as of March 9, <strong>2012</strong><br />
Association of American <strong>Medical</strong> Colleges
Table 33: Total Enrollment by U.S. <strong>Medical</strong> School and Gender, 2007–2011<br />
Table 33: Total Enrollment by U.S. <strong>Medical</strong> School and Gender, 2007-2011<br />
<strong>Diversity</strong> <strong>in</strong> <strong>Medical</strong> <strong>Education</strong>: <strong>Facts</strong> & <strong>Figures</strong> <strong>2012</strong><br />
Total Enrollment, 2007-2011<br />
2007 2008 2009 2010<br />
2011<br />
State <strong>Medical</strong> School Women Men All Women Men All Women Men All Women Men All Women Men All<br />
Alabama 286 428 714 299 429 728 305 437 742 319 429 748 336 419 755<br />
AL<br />
South Alabama 133 148 281 138 147 285 137 157 294 134 168 302 138 166 304<br />
AR Arkansas 251 365 616 247 374 621 260 370 630 258 384 642 263 401 664<br />
AZ Arizona 278 227 505 316 244 560 335 261 596 352 299 651 354 326 680<br />
Loma L<strong>in</strong>da 324 408 732 296 428 724 277 439 716 280 432 712 274 432 706<br />
Southern Cal-Keck 353 370 723 337 376 713 339 371 710 341 381 722 355 381 736<br />
Stanford 213 258 471 209 255 464 216 254 470 220 238 458 211 237 448<br />
UC Berkeley/SF Jo<strong>in</strong>t Prog 21 22 43 27 17 44 33 15 48 35 13 48 33 15 48<br />
UC Davis 237 183 420 245 183 428 257 176 433 249 184 433 244 191 435<br />
CA<br />
UC Irv<strong>in</strong>e 208 238 446 204 253 457 225 257 482 229 253 482 227 255 482<br />
UC San Diego 267 305 572 272 304 576 281 309 590 283 307 590 276 309 585<br />
UC San Francisco 381 320 701 394 322 716 399 336 735 402 338 740 415 346 761<br />
UCLA Drew 65 43 108 67 44 111 64 44 108 70 48 118 71 55 126<br />
UCLA-Geffen 317 349 666 316 357 673 313 394 707 314 406 720 332 399 731<br />
CO Colorado 301 329 630 322 334 656 322 357 679 325 363 688 334 367 701<br />
Connecticut 213 138 351 211 143 354 204 158 362 208 170 378 202 184 386<br />
CT<br />
Yale 265 243 508 254 254 508 249 260 509 245 254 499 245 275 520<br />
George Wash<strong>in</strong>gton 411 311 722 432 313 745 448 305 753 431 316 747 416 339 755<br />
DC Georgetown 397 402 799 388 416 804 398 412 810 390 421 811 393 426 819<br />
Howard 247 236 483 255 231 486 251 219 470 256 220 476 260 216 476<br />
Central Florida - - - - - - 22 19 41 57 44 101 96 83 179<br />
FIU-Wertheim - - - - - - 16 27 43 30 55 85 69 98 167<br />
Florida 262 256 518 268 267 535 257 283 540 251 296 547 251 309 560<br />
FL Florida Atlantic-Schmidt - - - - - - - - - - - - 32 32 64<br />
Florida State 214 144 358 245 171 416 263 192 455 246 232 478 233 249 482<br />
Miami-Miller 333 387 720 350 410 760 349 426 775 347 417 764 372 422 794<br />
USF-Morsani 258 225 483 251 232 483 251 235 486 235 245 480 241 265 506<br />
Emory 266 274 540 278 281 559 305 282 587 313 285 598 317 289 606<br />
MC Georgia 335 417 752 348 419 767 341 435 776 359 458 817 373 488 861<br />
GA<br />
Mercer 113 130 243 124 158 282 142 170 312 167 188 355 189 201 390<br />
Morehouse 132 85 217 133 84 217 137 80 217 142 83 225 154 79 233<br />
HI Hawaii-Burns 141 108 249 139 113 252 133 121 254 137 119 256 131 127 258<br />
IA Iowa-Carver 299 334 633 308 326 634 314 322 636 306 344 650 292 356 648<br />
Chicago Med-Frankl<strong>in</strong> 355 424 779 359 418 777 350 427 777 360 419 779 372 419 791<br />
Chicago-Pritzker 249 255 504 240 267 507 229 253 482 215 239 454 201 230 431<br />
Ill<strong>in</strong>ois 691 753 1,444 683 734 1,417 682 736 1,418 670 729 1,399 687 719 1,406<br />
130<br />
Association of American <strong>Medical</strong> Colleges<br />
Cont<strong>in</strong>ues on next page
Table 33: Total Enrollment by U.S. <strong>Medical</strong> School and Gender, 2007–2011 (cont<strong>in</strong>ued)<br />
Table 33: Total Enrollment by U.S. <strong>Medical</strong> School and Gender, 2007-2011 (cont<strong>in</strong>ued)<br />
<strong>Diversity</strong> <strong>in</strong> <strong>Medical</strong> <strong>Education</strong>: <strong>Facts</strong> & <strong>Figures</strong> <strong>2012</strong><br />
Total Enrollment, 2007-2011<br />
2007 2008 2009 2010<br />
2011<br />
State <strong>Medical</strong> School Women Men All Women Men All Women Men All Women Men All Women Men All<br />
IL Loyola-Stritch 294 281 575 292 286 578 311 278 589 316 284 600 314 291 605<br />
Northwestern-Fe<strong>in</strong>berg 363 402 765 360 406 766 358 402 760 363 411 774 350 421 771<br />
Rush 282 261 543 274 271 545 281 283 564 276 280 556 286 273 559<br />
Southern Ill<strong>in</strong>ois 154 139 293 149 144 293 145 152 297 142 157 299 146 162 308<br />
IN Indiana 511 661 1,172 522 683 1,205 538 711 1,249 558 735 1,293 568 741 1,309<br />
KS Kansas 344 371 715 355 363 718 361 371 732 344 388 732 338 417 755<br />
Kentucky 175 249 424 183 259 442 182 272 454 189 278 467 195 285 480<br />
KY<br />
Louisville 253 362 615 260 357 617 276 360 636 294 361 655 306 355 661<br />
LSU New Orleans 314 400 714 316 420 736 333 432 765 356 432 788 354 435 789<br />
LA LSU Shreveport 191 253 444 201 255 456 200 264 464 200 266 466 204 261 465<br />
Tulane 291 381 672 308 385 693 322 411 733 337 419 756 340 429 769<br />
Boston 398 338 736 407 353 760 412 368 780 416 382 798 415 393 808<br />
Harvard 407 438 845 399 437 836 395 432 827 390 449 839 384 449 833<br />
MA<br />
Massachusetts 258 205 463 267 211 478 279 224 503 284 240 524 302 259 561<br />
Tufts 336 409 745 337 411 748 348 431 779 374 436 810 381 453 834<br />
Johns Hopk<strong>in</strong>s 267 294 561 267 309 576 271 298 569 272 296 568 283 304 587<br />
MD Maryland 382 268 650 382 274 656 394 281 675 390 285 675 387 294 681<br />
Uniformed Services-Hebert 200 478 678 200 478 678 199 480 679 203 474 677 197 481 678<br />
Michigan 357 404 761 372 391 763 378 391 769 377 392 769 361 396 757<br />
Michigan State 270 224 494 292 259 551 313 297 610 340 352 692 360 386 746<br />
MI<br />
Oakland Beaumont - - - - - - - - - - - - 23 27 50<br />
Wayne State 565 636 1,201 578 653 1,231 584 680 1,264 578 694 1,272 560 679 1,239<br />
Mayo 93 100 193 102 105 207 106 111 217 111 121 232 118 117 235<br />
MN M<strong>in</strong>nesota 413 416 829 406 435 841 415 445 860 423 450 873 429 436 865<br />
M<strong>in</strong>nesota Duluth 55 61 116 64 58 122 68 55 123 67 59 126 55 68 123<br />
Missouri Columbia 189 198 387 189 203 392 195 203 398 193 201 394 200 201 401<br />
Missouri Kansas City 233 165 398 216 172 388 209 184 393 203 191 394 215 192 407<br />
MO<br />
St Louis 285 392 677 290 411 701 287 432 719 303 430 733 318 406 724<br />
Wash<strong>in</strong>gton U St Louis 282 319 601 283 321 604 286 323 609 294 320 614 299 318 617<br />
MS Mississippi 189 247 436 194 250 444 220 248 468 208 279 487 212 289 501<br />
Duke 223 247 470 233 245 478 228 241 469 225 239 464 228 238 466<br />
East Carol<strong>in</strong>a-Brody 146 155 301 145 154 299 151 156 307 157 160 317 160 160 320<br />
NC<br />
North Carol<strong>in</strong>a 356 380 736 363 368 731 378 356 734 385 368 753 391 380 771<br />
Wake Forest 215 253 468 213 269 482 224 269 493 226 266 492 220 271 491<br />
ND North Dakota 116 133 249 120 128 248 129 116 245 126 125 251 138 116 254<br />
Creighton 235 268 503 242 262 504 238 261 499 246 281 527 271 285 556<br />
NE<br />
Nebraska 206 281 487 205 292 497 207 294 501 208 298 506 216 303 519<br />
131<br />
Cont<strong>in</strong>ues on next page<br />
Association of American <strong>Medical</strong> Colleges
Table 33: Total Enrollment by U.S. <strong>Medical</strong> School and Gender, 2007–2011 (cont<strong>in</strong>ued)<br />
Table 33: Total Enrollment by U.S. <strong>Medical</strong> School and Gender, 2007-2011 (cont<strong>in</strong>ued)<br />
<strong>Diversity</strong> <strong>in</strong> <strong>Medical</strong> <strong>Education</strong>: <strong>Facts</strong> & <strong>Figures</strong> <strong>2012</strong><br />
Total Enrollment, 2007-2011<br />
2007 2008 2009 2010<br />
2011<br />
State <strong>Medical</strong> School Women Men All Women Men All Women Men All Women Men All Women Men All<br />
NH Dartmouth 168 167 335 164 178 342 179 185 364 184 187 371 197 197 394<br />
UMDNJ New Jersey 339 381 720 343 416 759 323 434 757 324 435 759 309 445 754<br />
NJ<br />
UMDNJ-RW Johnson 382 318 700 389 321 710 394 323 717 368 306 674 351 294 645<br />
NM New Mexico 168 155 323 167 156 323 180 151 331 184 161 345 194 162 356<br />
NV Nevada 111 114 225 116 121 237 120 125 245 116 132 248 123 130 253<br />
Albany 325 253 578 314 271 585 288 289 577 278 309 587 270 310 580<br />
Buffalo 305 282 587 314 273 587 290 288 578 298 295 593 279 318 597<br />
Columbia 323 372 695 338 373 711 336 374 710 340 369 709 357 384 741<br />
Cornell-Weill 235 252 487 238 253 491 232 270 502 235 265 500 232 273 505<br />
E<strong>in</strong>ste<strong>in</strong> 432 414 846 441 415 856 429 426 855 418 439 857 412 436 848<br />
Hofstra North Shore-LIJ - - - - - - - - - - - - 20 20 40<br />
NY Mount S<strong>in</strong>ai 300 281 581 302 294 596 315 304 619 310 330 640 308 344 652<br />
New York <strong>Medical</strong> 425 376 801 430 369 799 443 403 846 429 389 818 408 407 815<br />
New York University 354 376 730 358 389 747 363 388 751 366 379 745 360 376 736<br />
Rochester 233 220 453 229 233 462 234 243 477 234 246 480 228 245 473<br />
SUNY Downstate 396 401 797 373 415 788 385 417 802 393 434 827 392 452 844<br />
SUNY Upstate 324 320 644 324 341 665 323 327 650 312 340 652 294 358 652<br />
Stony Brook 245 237 482 242 264 506 248 282 530 252 291 543 248 306 554<br />
Case Western 349 433 782 377 457 834 392 474 866 414 488 902 414 488 902<br />
C<strong>in</strong>c<strong>in</strong>nati 286 385 671 265 399 664 270 403 673 284 395 679 300 391 691<br />
Northeast Ohio 248 231 479 250 249 499 246 253 499 241 272 513 240 290 530<br />
OH<br />
Ohio State 344 534 878 362 522 884 390 512 902 402 509 911 431 532 963<br />
Toledo 278 357 635 282 381 663 307 391 698 324 394 718 327 403 730<br />
Wright State-Boonshoft 235 177 412 228 190 418 225 191 416 213 213 426 201 222 423<br />
OK Oklahoma 250 384 634 252 405 657 263 405 668 270 408 678 273 396 669<br />
OR Oregon 281 234 515 281 246 527 281 244 525 284 237 521 283 259 542<br />
Commonwealth - - - - - - 23 42 65 47 83 130 80 115 195<br />
Drexel 538 551 1,089 534 552 1,086 536 577 1,113 534 582 1,116 539 561 1,100<br />
Jefferson 521 517 1,038 532 547 1,079 540 535 1,075 540 550 1,090 553 545 1,098<br />
PA Penn State 294 301 595 296 311 607 298 316 614 302 306 608 301 294 595<br />
Pennsylvania-Perelman 352 368 720 355 381 736 354 392 746 354 400 754 362 417 779<br />
Pittsburgh 314 352 666 302 368 670 297 372 669 312 376 688 304 378 682<br />
Temple 345 384 729 345 382 727 351 406 757 355 411 766 367 429 796<br />
Caribe 142 135 277 146 144 290 148 144 292 147 144 291 152 146 298<br />
Ponce 146 147 293 143 149 292 142 143 285 148 141 289 154 139 293<br />
PR<br />
Puerto Rico 218 224 442 229 215 444 252 199 451 261 197 458 261 202 463<br />
San Juan Bautista 164 86 250 157 109 266 147 109 256 143 126 269 134 125 259<br />
132<br />
Association of American <strong>Medical</strong> Colleges<br />
Cont<strong>in</strong>ues on next page
Table 33: Total Enrollment by U.S. <strong>Medical</strong> School and Gender, 2007–2011 (cont<strong>in</strong>ued)<br />
Table 33: Total Enrollment by U.S. <strong>Medical</strong> School and Gender, 2007-2011 (cont<strong>in</strong>ued)<br />
<strong>Diversity</strong> <strong>in</strong> <strong>Medical</strong> <strong>Education</strong>: <strong>Facts</strong> & <strong>Figures</strong> <strong>2012</strong><br />
Total Enrollment, 2007-2011<br />
2007 2008 2009 2010<br />
2011<br />
State <strong>Medical</strong> School Women Men All Women Men All Women Men All Women Men All Women Men All<br />
RI Brown-Alpert 217 173 390 232 193 425 227 201 428 235 189 424 236 194 430<br />
MU South Carol<strong>in</strong>a 273 365 638 276 384 660 287 398 685 294 416 710 294 414 708<br />
SC<br />
South Carol<strong>in</strong>a 150 169 319 150 175 325 155 180 335 174 172 346 177 177 354<br />
SD South Dakota-Sanford 100 109 209 102 108 210 98 119 217 100 126 226 96 132 228<br />
East Tennessee-Quillen 126 124 250 122 130 252 117 137 254 127 134 261 125 148 273<br />
Meharry 249 186 435 247 185 432 268 201 469 262 197 459 255 209 464<br />
TN<br />
Tennessee 234 383 617 240 367 607 249 380 629 248 398 646 257 407 664<br />
Vanderbilt 217 259 476 232 255 487 240 257 497 245 242 487 252 243 495<br />
Baylor 356 402 758 358 392 750 383 389 772 385 417 802 371 437 808<br />
Texas A & M 189 170 359 212 210 422 229 262 491 257 299 556 299 354 653<br />
Texas Tech 252 330 582 246 335 581 252 340 592 251 338 589 254 324 578<br />
Texas Tech-Foster - - - - - - 24 15 39 51 48 99 90 93 183<br />
TX<br />
UT Galveston 442 454 896 436 491 927 432 511 943 423 525 948 429 524 953<br />
UT HSC San Antonio 491 391 882 470 427 897 473 444 917 459 461 920 459 458 917<br />
UT Houston 406 492 898 409 528 937 412 563 975 415 563 978 411 556 967<br />
UT Southwestern 439 533 972 453 521 974 434 524 958 453 530 983 471 534 1,005<br />
UT Utah 159 276 435 152 280 432 143 272 415 132 266 398 126 238 364<br />
Eastern Virg<strong>in</strong>ia 223 223 446 215 231 446 205 246 451 218 250 468 222 275 497<br />
Virg<strong>in</strong>ia 278 323 601 283 330 613 282 330 612 272 358 630 280 367 647<br />
VA<br />
Virg<strong>in</strong>ia Commonwealth 368 398 766 371 406 777 383 418 801 375 430 805 382 446 828<br />
Virg<strong>in</strong>ia Tech Carilion - - - - - - - - - 12 30 42 29 55 84<br />
VT Vermont 254 185 439 252 215 467 254 219 473 242 232 474 238 229 467<br />
WA U Wash<strong>in</strong>gton 442 384 826 462 408 870 492 409 901 514 426 940 528 438 966<br />
MC Wiscons<strong>in</strong> 399 429 828 407 440 847 404 436 840 396 452 848 371 469 840<br />
WI<br />
Wiscons<strong>in</strong> 344 320 664 366 329 695 355 332 687 359 350 709 365 367 732<br />
Marshall-Edwards 107 139 246 134 146 280 144 152 296 145 156 301 127 168 295<br />
WV<br />
West Virg<strong>in</strong>ia 175 258 433 178 263 441 178 271 449 174 266 440 163 280 443<br />
133<br />
Total Count 35,924 38,378 74,302 36,364 39,420 75,784 36,989 40,394 77,383 37,384 41,386 78,770 37,878 42,401 80,279<br />
* Enrollment does not <strong>in</strong>clude students who were graduated, dismissed, withdrawn, deceased, never enrolled, completed fifth pathway, did not complete fifth pathway, or degree revoked.<br />
Source: <strong>AAMC</strong>: Data Warehouse: Student file as of 2/15/<strong>2012</strong>.<br />
Association of American <strong>Medical</strong> Colleges
Table 34: U.S. <strong>Medical</strong> School Total Enrollment by Gender and Race and Ethnicity, 2002–2011<br />
Table 34: U.S. <strong>Medical</strong> School Total Enrollment by Gender and Race and Ethnicity, 2002-2011<br />
<strong>Diversity</strong> <strong>in</strong> <strong>Medical</strong> <strong>Education</strong>: <strong>Facts</strong> & <strong>Figures</strong> <strong>2012</strong><br />
Students' Responses to Race and Ethnicity<br />
2002 2003 2004 2005 2006 2007 2008 2009 2010 2011<br />
Black or African American 3,265 3,285 3,381 3,363 3,385 3,390 3,409 3,466 3,440 3,472<br />
American Indian or Alaska Native 236 259 290 301 291 291 274 269 291 269<br />
Non-Hispanic Asian 6,524 6,764 7,036 7,400 7,587 7,867 8,032 8,274 8,531 8,689<br />
or Lat<strong>in</strong>o Native Hawaiian or Other Pacific Islander 74 61 52 40 43 63 81 96 96 93<br />
White 19,172 19,573 19,950 20,038 20,286 20,386 20,373 20,385 20,278 20,250<br />
Other Non-Hispanic or Lat<strong>in</strong>o Race 88 178 191 196 138 63 54 52 40 30<br />
Mexican American 782 805 802 864 909 945 981 1,021 977 964<br />
Hispanic Puerto Rican 702 707 735 772 767 803 801 814 852 879<br />
or Lat<strong>in</strong>o Cuban 39 68 108 151 165 186 214 233 253 299<br />
Other Hispanic or Lat<strong>in</strong>o 650 668 701 756 814 832 873 906 998 1,120<br />
Non-U.S. Foreign 470 501 553 642 697 767 811 808 779 738<br />
No Response or Unknown Citizen 375 389 389 333 315 331 461 665 849 1,075<br />
Unduplicated Total for Women<br />
32,377 33,258 34,188 34,856 35,397 35,924 36,364 36,989 37,384 37,878<br />
Black or African American 1,891 1,881 1,868 1,909 1,902 1,976 1,974 2,024 2,073 2,109<br />
American Indian or Alaska Native 242 241 256 281 285 299 299 296 299 296<br />
Non-Hispanic Asian 7,561 7,419 7,327 7,436 7,569 7,833 8,127 8,390 8,684 8,956<br />
or Lat<strong>in</strong>o Native Hawaiian or Other Pacific Islander 72 61 57 46 60 68 73 82 81 76<br />
White 24,141 23,682 23,406 23,399 23,734 24,128 24,551 24,909 25,163 25,622<br />
Other Non-Hispanic or Lat<strong>in</strong>o Race 129 246 271 279 189 90 70 63 48 31<br />
Mexican American 922 884 891 911 956 983 1,041 1,074 1,072 1,056<br />
Hispanic Puerto Rican 629 625 621 662 685 726 750 730 771 764<br />
or Lat<strong>in</strong>o Cuban 36 82 133 191 210 223 254 257 270 285<br />
Other Hispanic or Lat<strong>in</strong>o 781 765 769 775 805 836 874 913 1,016 1,120<br />
Non-U.S. Foreign 606 611 672 715 783 851 898 896 892 851<br />
No Response or Unknown Citizen 328 345 356 323 323 365 509 760 1,017 1,235<br />
Unduplicated Total for Men<br />
37,338 36,842 36,627 36,927 37,501 38,378 39,420 40,394 41,386 42,401<br />
Black or African American 5,156 5,166 5,249 5,272 5,287 5,366 5,383 5,490 5,513 5,581<br />
American Indian or Alaska Native 478 500 546 582 576 590 573 565 590 565<br />
Non-Hispanic Asian 14,085 14,183 14,363 14,836 15,156 15,700 16,159 16,664 17,215 17,645<br />
or Lat<strong>in</strong>o Native Hawaiian or Other Pacific Islander 146 122 109 86 103 131 154 178 177 169<br />
White 43,313 43,255 43,356 43,437 44,020 44,514 44,924 45,294 45,441 45,872<br />
Other Non-Hispanic or Lat<strong>in</strong>o Race 217 424 462 475 327 153 124 115 88 61<br />
Mexican American 1,704 1,689 1,693 1,775 1,865 1,928 2,022 2,095 2,049 2,020<br />
Hispanic Puerto Rican 1,331 1,332 1,356 1,434 1,452 1,529 1,551 1,544 1,623 1,643<br />
or Lat<strong>in</strong>o Cuban 75 150 241 342 375 409 468 490 523 584<br />
Other Hispanic or Lat<strong>in</strong>o 1,431 1,433 1,470 1,531 1,619 1,668 1,747 1,819 2,014 2,240<br />
Non-U.S. Foreign 1,076 1,112 1,225 1,357 1,480 1,618 1,709 1,704 1,671 1,589<br />
No Response or Unknown Citizen 703 734 745 656 638 696 970 1,425 1,866 2,310<br />
Unduplicated Total Enrollment<br />
69,715 70,100 70,815 71,783 72,898 74,302 75,784 77,383 78,770 80,279<br />
Women<br />
134<br />
Men<br />
All<br />
* Enrollment does not <strong>in</strong>clude students who were graduated, dismissed, withdrawn, deceased, never enrolled, completed fifth pathway, did not complete fifth pathway, or degree revoked.<br />
Source: <strong>AAMC</strong>: DW: Student file; App Mat File as of 2/17/<strong>2012</strong><br />
Association of American <strong>Medical</strong> Colleges
Table 35: Number of Graduates by State, U.S. <strong>Medical</strong> School, Gender, and Race and Ethnicity, 2011<br />
Table 35: Number of Graduates by State, U.S. <strong>Medical</strong> School, Gender, and Race and Ethnicity*, 2011<br />
<strong>Diversity</strong> <strong>in</strong> <strong>Medical</strong> <strong>Education</strong>: <strong>Facts</strong> & <strong>Figures</strong> <strong>2012</strong><br />
Non-Hispanic or<br />
Hispanic or Lat<strong>in</strong>o<br />
Lat<strong>in</strong>o M<strong>in</strong>orities<br />
Non-Hispanic or Lat<strong>in</strong>o Others<br />
Ameri-<br />
Black canMexi-<br />
or Indian<br />
Native<br />
No<br />
can<br />
Other<br />
African or<br />
Hawa-<br />
Race UndupliAmeri-<br />
Puerto<br />
HispaSubAmeri- Alaska Subiian<br />
or<br />
Other<br />
Rescatedcan Rican Cuban nictotalcan Native total Asian OPI White Race Foreign ponse Total<br />
Women 1 0 0 0 1 6 1 7 9 0 46 0 0 0 61<br />
Men 1 0 0 0 1 3 0 3 14 0 78 0 0 3 99<br />
Subtotal 2 0 0 0 2 9 1 10 23 0 124 0 0 3 160<br />
Women 0 0 0 0 0 2 0 2 5 0 21 0 0 0 28<br />
Men 0 0 0 0 0 5 0 5 4 0 32 0 1 0 41<br />
Subtotal 0 0 0 0 0 7 0 7 9 0 53 0 1 0 69<br />
Women 0 0 0 0 0 0 0 0 7 0 41 0 0 0 47<br />
Men 1 0 0 1 2 1 0 1 12 1 77 0 0 0 93<br />
Subtotal 1 0 0 1 2 1 0 1 19 1 118 0 0 0 140<br />
Women 9 1 0 0 10 2 1 3 9 1 59 0 0 0 77<br />
Men 3 0 1 2 6 2 2 4 12 1 33 0 0 0 48<br />
Subtotal 12 1 1 2 16 4 3 7 21 2 92 0 0 0 125<br />
Women 5 0 0 4 9 5 1 6 10 0 47 1 3 0 67<br />
Men 5 0 0 3 8 1 1 2 26 0 68 0 1 1 96<br />
Subtotal 10 0 0 7 17 6 2 8 36 0 115 1 4 1 163<br />
Women 0 1 0 6 7 8 0 8 24 0 36 0 5 0 71<br />
Men 2 0 0 6 8 3 0 3 30 0 48 0 7 1 91<br />
Subtotal 2 1 0 12 15 11 0 11 54 0 84 0 12 1 162<br />
Women 3 0 0 3 6 4 1 5 20 0 27 1 3 0 54<br />
Men 0 1 1 4 6 0 0 0 17 0 20 2 1 0 41<br />
Subtotal 3 1 1 7 12 4 1 5 37 0 47 3 4 0 95<br />
Women 3 0 0 1 4 6 1 7 1 0 4 0 0 0 11<br />
Men 2 0 0 0 2 2 0 2 4 0 1 0 0 0 9<br />
Subtotal 5 0 0 1 6 8 1 9 5 0 5 0 0 0 20<br />
Women 4 0 0 5 9 2 0 2 22 1 32 2 1 1 58<br />
Men 2 0 1 1 4 2 0 2 17 0 19 0 0 1 42<br />
Subtotal 6 0 1 6 13 4 0 4 39 1 51 2 1 2 100<br />
Women 2 0 0 0 2 1 0 1 20 0 31 1 0 0 51<br />
Men 4 0 0 0 4 1 0 1 16 1 31 1 0 0 51<br />
Subtotal 6 0 0 0 6 2 0 2 36 1 62 2 0 0 102<br />
Women 0 0 0 1 1 5 1 6 28 0 24 0 0 1 56<br />
Men 9 0 0 7 16 3 0 3 30 1 49 2 0 0 87<br />
Subtotal 9 0 0 8 17 8 1 9 58 1 73 2 0 1 143<br />
Women 4 1 0 2 7 1 1 2 28 0 34 1 0 0 67<br />
Men 4 0 0 0 4 0 0 0 23 0 36 0 0 0 60<br />
Subtotal 8 1 0 2 11 1 1 2 51 0 70 1 0 0 127<br />
State/School/Gender<br />
University of Alabama School<br />
of Medic<strong>in</strong>e<br />
135<br />
AL<br />
University of South Alabama<br />
College of Medic<strong>in</strong>e<br />
University of Arkansas for<br />
<strong>Medical</strong> Sciences College of<br />
Medic<strong>in</strong>e<br />
AR<br />
University of Arizona College<br />
of Medic<strong>in</strong>e<br />
AZ<br />
Keck School of Medic<strong>in</strong>e of<br />
the University of Southern<br />
California<br />
Loma L<strong>in</strong>da University School<br />
of Medic<strong>in</strong>e<br />
Stanford University School of<br />
Medic<strong>in</strong>e<br />
UCLA/Drew <strong>Medical</strong><br />
<strong>Education</strong> Program<br />
University of California, Davis,<br />
School of Medic<strong>in</strong>e<br />
CA<br />
University of California, Irv<strong>in</strong>e,<br />
School of Medic<strong>in</strong>e<br />
University of California, Los<br />
Angeles David Geffen School<br />
of Medic<strong>in</strong>e<br />
University of California, San<br />
Diego School of Medic<strong>in</strong>e<br />
Cont<strong>in</strong>ues on next page<br />
Association of American <strong>Medical</strong> Colleges
Table 35: Number of Graduates by State, U.S. <strong>Medical</strong> School, Gender, and Race and Ethnicity, 2011<br />
(cont<strong>in</strong>ued)<br />
Table 35: Number of Graduates by State, U.S. <strong>Medical</strong> School, Gender, and Race and Ethnicity*, 2011 (cont<strong>in</strong>ued)<br />
<strong>Diversity</strong> <strong>in</strong> <strong>Medical</strong> <strong>Education</strong>: <strong>Facts</strong> & <strong>Figures</strong> <strong>2012</strong><br />
Non-Hispanic or<br />
Hispanic or Lat<strong>in</strong>o<br />
Lat<strong>in</strong>o M<strong>in</strong>orities<br />
Non-Hispanic or Lat<strong>in</strong>o Others<br />
Ameri-<br />
Black canMexi-<br />
or Indian<br />
Native<br />
No<br />
can<br />
Other<br />
African or<br />
Hawa-<br />
Race UndupliAmeri-<br />
Puerto<br />
HispaSubAmeri- Alaska Subiian<br />
or<br />
Other<br />
Rescatedcan Rican Cuban nictotalcan Native total Asian OPI White Race Foreign ponse Total<br />
Women 7 1 1 0 9 7 4 11 27 0 56 0 0 0 85<br />
Men 5 0 0 3 8 4 1 5 19 1 31 1 0 2 58<br />
Subtotal 12 1 1 3 17 11 5 16 46 1 87 1 0 2 143<br />
Women 2 0 1 1 4 2 1 3 6 0 58 2 0 0 67<br />
Men 0 1 0 0 1 1 1 2 7 0 69 0 0 0 77<br />
Subtotal 2 1 1 1 5 3 2 5 13 0 127 2 0 0 144<br />
Women 1 0 0 1 2 2 1 3 10 0 35 0 2 0 47<br />
Men 1 0 0 3 4 2 0 2 8 0 22 0 0 1 34<br />
Subtotal 2 0 0 4 6 4 1 5 18 0 57 0 2 1 81<br />
Women 1 1 0 0 2 1 1 2 12 0 22 0 10 0 44<br />
Men 2 0 0 2 4 3 0 3 7 0 20 0 5 0 38<br />
Subtotal 3 1 0 2 6 4 1 5 19 0 42 0 15 0 82<br />
Women 0 0 0 1 1 14 1 15 25 0 60 0 0 0 101<br />
Men 0 1 1 1 3 7 0 7 22 1 36 0 2 0 66<br />
Subtotal 0 1 1 2 4 21 1 22 47 1 96 0 2 0 167<br />
Women 0 0 0 3 3 11 0 11 21 0 61 0 0 0 94<br />
Men 3 0 0 2 5 4 0 4 13 0 68 0 6 0 95<br />
Subtotal 3 0 0 5 8 15 0 15 34 0 129 0 6 0 189<br />
Women 0 1 0 2 3 43 0 43 5 0 6 0 4 0 57<br />
Men 0 1 0 2 3 33 0 33 8 0 6 0 8 0 53<br />
Subtotal 0 2 0 4 6 76 0 76 13 0 12 0 12 0 110<br />
Women 0 0 1 3 4 9 0 9 9 1 48 0 0 0 65<br />
Men 0 0 2 1 3 1 0 1 6 1 41 0 0 0 48<br />
Subtotal 0 0 3 4 7 10 0 10 15 2 89 0 0 0 113<br />
Women 1 0 1 0 2 3 0 3 18 0 33 0 0 0 54<br />
Men 1 2 2 3 8 2 0 2 16 0 39 0 0 0 58<br />
Subtotal 2 2 3 3 10 5 0 5 34 0 72 0 0 0 112<br />
Women 0 0 3 3 6 6 0 6 18 0 35 1 0 1 60<br />
Men 0 0 3 3 6 2 0 2 13 0 49 0 0 2 67<br />
Subtotal 0 0 6 6 12 8 0 8 31 0 84 1 0 3 127<br />
Women 1 2 4 4 11 7 0 7 15 0 56 0 0 0 79<br />
Men 0 0 8 8 16 4 1 5 22 0 69 0 0 0 93<br />
Subtotal 1 2 12 12 27 11 1 12 37 0 125 0 0 0 172<br />
Women 0 0 0 2 2 3 0 3 18 0 43 0 2 2 67<br />
Men 0 1 0 6 7 3 1 4 11 0 43 1 1 0 61<br />
Subtotal 0 1 0 8 9 6 1 7 29 0 86 1 3 2 128<br />
State/School/Gender<br />
University of California, San<br />
Francisco, School of Medic<strong>in</strong>e<br />
136<br />
University of Colorado School<br />
of Medic<strong>in</strong>e<br />
CO<br />
University of Connecticut<br />
School of Medic<strong>in</strong>e<br />
CT<br />
Yale University School of<br />
Medic<strong>in</strong>e<br />
George Wash<strong>in</strong>gton University<br />
School of Medic<strong>in</strong>e and Health<br />
Sciences<br />
Georgetown University School<br />
of Medic<strong>in</strong>e<br />
DC<br />
Howard University College of<br />
Medic<strong>in</strong>e<br />
Florida State University<br />
College of Medic<strong>in</strong>e<br />
USF Health Morsani College<br />
of Medic<strong>in</strong>e<br />
FL<br />
University of Florida College<br />
of Medic<strong>in</strong>e<br />
University of Miami Leonard<br />
M. Miller School of Medic<strong>in</strong>e<br />
Emory University School of<br />
Medic<strong>in</strong>e<br />
Association of American <strong>Medical</strong> Colleges<br />
Cont<strong>in</strong>ues on next page
Table 35: Number of Graduates by State, U.S. <strong>Medical</strong> School, Gender, and Race and Ethnicity, 2011<br />
(cont<strong>in</strong>ued)<br />
Table 35: Number of Graduates by State, U.S. <strong>Medical</strong> School, Gender, and Race and Ethnicity*, 2011 (cont<strong>in</strong>ued)<br />
<strong>Diversity</strong> <strong>in</strong> <strong>Medical</strong> <strong>Education</strong>: <strong>Facts</strong> & <strong>Figures</strong> <strong>2012</strong><br />
Non-Hispanic or<br />
Hispanic or Lat<strong>in</strong>o<br />
Lat<strong>in</strong>o M<strong>in</strong>orities<br />
Non-Hispanic or Lat<strong>in</strong>o Others<br />
Ameri-<br />
Black canMexi-<br />
or Indian<br />
Native<br />
No<br />
can<br />
Other<br />
African or<br />
Hawa-<br />
Race UndupliAmeri-<br />
Puerto<br />
HispaSubAmeri- Alaska Subiian<br />
or<br />
Other<br />
Rescatedcan Rican Cuban nictotalcan Native total Asian OPI White Race Foreign ponse Total<br />
Women 1 1 0 0 2 9 0 9 15 0 51 0 1 0 77<br />
Men 0 1 1 5 7 2 0 2 14 0 84 0 0 0 102<br />
Subtotal 1 2 1 5 9 11 0 11 29 0 135 0 1 0 179<br />
Women 0 0 0 1 1 1 0 1 2 0 19 0 1 1 24<br />
Men 0 0 0 0 0 0 0 0 7 0 33 0 0 2 41<br />
Subtotal 0 0 0 1 1 1 0 1 9 0 52 0 1 3 65<br />
Women 0 1 0 0 1 23 0 23 3 0 2 0 0 0 28<br />
Men 0 0 0 0 0 12 0 12 4 0 2 0 0 0 18<br />
Subtotal 0 1 0 0 1 35 0 35 7 0 4 0 0 0 46<br />
Women 0 0 0 0 0 0 1 1 29 6 11 0 1 0 37<br />
Men 0 0 0 0 0 0 0 0 17 5 8 0 1 0 25<br />
Subtotal 0 0 0 0 0 0 1 1 46 11 19 0 2 0 62<br />
Women 6 0 0 0 6 3 2 5 2 0 64 0 0 0 73<br />
Men 0 0 0 0 0 5 0 5 7 0 63 0 0 0 74<br />
Subtotal 6 0 0 0 6 8 2 10 9 0 127 0 0 0 147<br />
Women 0 0 0 1 1 3 0 3 24 0 51 0 6 0 82<br />
Men 0 1 0 1 2 4 0 4 33 0 49 0 6 0 92<br />
Subtotal 0 1 0 2 3 7 0 7 57 0 100 0 12 0 174<br />
Women 3 3 0 0 6 3 0 3 8 0 56 0 0 0 70<br />
Men 2 1 0 0 3 1 0 1 11 0 56 0 0 0 69<br />
Subtotal 5 4 0 0 9 4 0 4 19 0 112 0 0 0 139<br />
Women 2 0 0 4 6 4 4 8 34 1 49 0 3 0 91<br />
Men 3 0 1 3 7 5 1 6 22 0 50 1 3 0 83<br />
Subtotal 5 0 1 7 13 9 5 14 56 1 99 1 6 0 174<br />
Women 3 0 1 1 5 0 0 0 22 0 37 0 0 0 57<br />
Men 2 2 0 3 7 1 0 1 20 0 43 0 0 0 64<br />
Subtotal 5 2 1 4 12 1 0 1 42 0 80 0 0 0 121<br />
Women 1 0 0 0 1 3 1 4 5 0 26 0 0 0 33<br />
Men 0 0 0 0 0 1 0 1 4 0 24 0 0 0 29<br />
Subtotal 1 0 0 0 1 4 1 5 9 0 50 0 0 0 62<br />
Women 2 3 0 0 5 9 1 10 18 2 29 0 0 0 58<br />
Men 2 0 0 1 3 5 1 6 14 0 35 0 2 0 53<br />
Subtotal 4 3 0 1 8 14 2 16 32 2 64 0 2 0 111<br />
Women 11 1 1 8 21 13 2 15 52 0 66 3 0 0 138<br />
Men 10 3 0 7 20 8 0 8 56 0 91 1 0 0 166<br />
Subtotal 21 4 1 15 41 21 2 23 108 0 157 4 0 0 304<br />
State/School/Gender<br />
<strong>Medical</strong> College of Georgia at<br />
Georgia Health Sciences<br />
University<br />
137<br />
GA<br />
Mercer University School of<br />
Medic<strong>in</strong>e<br />
Morehouse School of<br />
Medic<strong>in</strong>e<br />
University of Hawaii, John A.<br />
Burns School of Medic<strong>in</strong>e<br />
HI<br />
University of Iowa Roy J. and<br />
Lucille A. Carver College of<br />
Medic<strong>in</strong>e<br />
Chicago <strong>Medical</strong> School at<br />
Rosal<strong>in</strong>d Frankl<strong>in</strong> University of<br />
Medic<strong>in</strong>e & Science<br />
IA<br />
Loyola University Chicago<br />
Stritch School of Medic<strong>in</strong>e<br />
Northwestern University The<br />
Fe<strong>in</strong>berg School of Medic<strong>in</strong>e<br />
Rush <strong>Medical</strong> College of Rush<br />
University <strong>Medical</strong> Center<br />
IL<br />
Southern Ill<strong>in</strong>ois University<br />
School of Medic<strong>in</strong>e<br />
University of Chicago Division<br />
of the Biological Sciences The<br />
Pritzker School of Medic<strong>in</strong>e<br />
University of Ill<strong>in</strong>ois College of<br />
Medic<strong>in</strong>e<br />
Cont<strong>in</strong>ues on next page<br />
Association of American <strong>Medical</strong> Colleges
Table 35: Number of Graduates by State, U.S. <strong>Medical</strong> School, Gender, and Race and Ethnicity, 2011<br />
(cont<strong>in</strong>ued)<br />
Table 35: Number of Graduates by State, U.S. <strong>Medical</strong> School, Gender, and Race and Ethnicity*, 2011 (cont<strong>in</strong>ued)<br />
<strong>Diversity</strong> <strong>in</strong> <strong>Medical</strong> <strong>Education</strong>: <strong>Facts</strong> & <strong>Figures</strong> <strong>2012</strong><br />
Non-Hispanic or<br />
Hispanic or Lat<strong>in</strong>o<br />
Lat<strong>in</strong>o M<strong>in</strong>orities<br />
Non-Hispanic or Lat<strong>in</strong>o Others<br />
Ameri-<br />
Black canMexi-<br />
or Indian<br />
Native<br />
No<br />
can<br />
Other<br />
African or<br />
Hawa-<br />
Race UndupliAmeri-<br />
Puerto<br />
HispaSubAmeri- Alaska Subiian<br />
or<br />
Other<br />
Rescatedcan Rican Cuban nictotalcan Native total Asian OPI White Race Foreign ponse Total<br />
Women 4 1 0 1 6 11 1 12 22 0 101 0 1 0 132<br />
Men 8 0 0 2 10 6 2 8 29 0 125 0 1 0 167<br />
Subtotal 12 1 0 3 16 17 3 20 51 0 226 0 2 0 299<br />
Women 1 0 0 0 1 5 2 7 12 0 73 0 0 0 88<br />
Men 8 0 0 1 9 5 1 6 7 0 61 1 0 0 78<br />
Subtotal 9 0 0 1 10 10 3 13 19 0 134 1 0 0 166<br />
Women 0 0 0 0 0 0 0 0 6 0 30 0 1 0 37<br />
Men 0 0 0 0 0 2 0 2 6 0 45 0 4 2 58<br />
Subtotal 0 0 0 0 0 2 0 2 12 0 75 0 5 2 95<br />
Women 0 0 0 1 1 6 1 7 12 0 53 0 0 0 69<br />
Men 0 1 0 0 1 2 0 2 7 0 65 0 0 2 77<br />
Subtotal 0 1 0 1 2 8 1 9 19 0 118 0 0 2 146<br />
Women 1 0 0 1 2 9 1 10 8 0 64 0 0 0 81<br />
Men 2 0 0 2 4 3 0 3 7 2 87 0 0 3 99<br />
Subtotal 3 0 0 3 6 12 1 13 15 2 151 0 0 3 180<br />
Women 1 0 0 0 1 3 0 3 1 0 38 0 0 0 42<br />
Men 0 1 1 1 3 2 0 2 5 0 62 0 0 3 70<br />
Subtotal 1 1 1 1 4 5 0 5 6 0 100 0 0 3 112<br />
Women 0 0 0 3 3 7 0 7 17 0 60 0 1 0 82<br />
Men 1 0 0 1 2 3 1 4 19 1 71 0 0 0 94<br />
Subtotal 1 0 0 4 5 10 1 11 36 1 131 0 1 0 176<br />
Women 2 2 1 4 9 12 2 14 26 1 40 0 5 0 83<br />
Men 5 1 0 5 11 5 0 5 23 0 42 1 3 0 75<br />
Subtotal 7 3 1 9 20 17 2 19 49 1 82 1 8 0 158<br />
Women 3 0 1 3 7 8 1 9 28 0 42 0 6 0 84<br />
Men 2 1 0 4 7 8 1 9 19 0 47 1 10 1 90<br />
Subtotal 5 1 1 7 14 16 2 18 47 0 89 1 16 1 174<br />
Women 0 1 1 0 2 4 0 4 24 0 54 0 0 1 83<br />
Men 0 1 1 5 7 2 1 3 23 0 64 0 1 0 92<br />
Subtotal 0 2 2 5 9 6 1 7 47 0 118 0 1 1 175<br />
Women 0 0 0 2 2 5 0 5 4 0 40 0 0 0 49<br />
Men 1 1 0 0 2 3 0 3 6 0 28 0 0 0 37<br />
Subtotal 1 1 0 2 4 8 0 8 10 0 68 0 0 0 86<br />
Women 2 1 0 0 3 4 0 4 15 0 22 2 3 0 45<br />
Men 1 0 0 1 2 4 1 5 26 0 25 0 2 0 55<br />
Subtotal 3 1 0 1 5 8 1 9 41 0 47 2 5 0 100<br />
State/School/Gender<br />
Indiana University School of<br />
Medic<strong>in</strong>e<br />
IN<br />
138<br />
University of Kansas School of<br />
Medic<strong>in</strong>e<br />
KS<br />
University of Kentucky College<br />
of Medic<strong>in</strong>e<br />
KY<br />
University of Louisville School<br />
of Medic<strong>in</strong>e<br />
Louisiana State University<br />
School of Medic<strong>in</strong>e <strong>in</strong> New<br />
Orleans<br />
Louisiana State University<br />
School of Medic<strong>in</strong>e <strong>in</strong><br />
Shreveport<br />
LA<br />
Tulane University School of<br />
Medic<strong>in</strong>e<br />
Boston University School of<br />
Medic<strong>in</strong>e<br />
Harvard <strong>Medical</strong> School<br />
MA<br />
Tufts University School of<br />
Medic<strong>in</strong>e<br />
University of Massachusetts<br />
<strong>Medical</strong> School<br />
Johns Hopk<strong>in</strong>s University<br />
School of Medic<strong>in</strong>e<br />
Association of American <strong>Medical</strong> Colleges<br />
Cont<strong>in</strong>ues on next page
Table 35: Number of Graduates by State, U.S. <strong>Medical</strong> School, Gender, and Race and Ethnicity, 2011<br />
(cont<strong>in</strong>ued)<br />
Table 35: Number of Graduates by State, U.S. <strong>Medical</strong> School, Gender, and Race and Ethnicity*, 2011 (cont<strong>in</strong>ued)<br />
<strong>Diversity</strong> <strong>in</strong> <strong>Medical</strong> <strong>Education</strong>: <strong>Facts</strong> & <strong>Figures</strong> <strong>2012</strong><br />
Non-Hispanic or<br />
Hispanic or Lat<strong>in</strong>o<br />
Lat<strong>in</strong>o M<strong>in</strong>orities<br />
Non-Hispanic or Lat<strong>in</strong>o Others<br />
Ameri-<br />
Black canMexi-<br />
or Indian<br />
Native<br />
No<br />
can<br />
Other<br />
African or<br />
Hawa-<br />
Race UndupliAmeri-<br />
Puerto<br />
HispaSubAmeri- Alaska Subiian<br />
or<br />
Other<br />
Rescatedcan Rican Cuban nictotalcan Native total Asian OPI White Race Foreign ponse Total<br />
Women 1 1 0 1 3 0 1 1 9 0 48 0 0 0 59<br />
Men 3 1 0 3 7 2 1 3 23 0 89 1 0 0 109<br />
Subtotal 4 2 0 4 10 2 2 4 32 0 137 1 0 0 168<br />
Women 0 0 0 0 0 10 0 10 20 0 60 0 0 1 88<br />
Men 0 0 0 0 0 4 0 4 20 0 39 1 0 1 63<br />
Subtotal 0 0 0 0 0 14 0 14 40 0 99 1 0 2 151<br />
Women 4 0 0 1 5 10 1 11 17 0 47 0 3 0 79<br />
Men 1 0 0 0 1 0 1 1 8 0 52 0 0 0 64<br />
Subtotal 5 0 0 1 6 10 2 12 25 0 99 0 3 0 143<br />
Women 1 1 1 4 7 7 2 9 22 0 70 0 0 0 96<br />
Men 0 1 0 2 3 5 0 5 21 1 56 1 1 0 84<br />
Subtotal 1 2 1 6 10 12 2 14 43 1 126 1 1 0 180<br />
Women 3 0 0 0 3 22 0 22 27 1 85 0 2 1 136<br />
Men 1 1 1 1 4 10 2 12 39 0 122 0 2 2 175<br />
Subtotal 4 1 1 1 7 32 2 34 66 1 207 0 4 3 311<br />
Women 0 0 0 0 0 0 0 0 4 0 12 0 0 0 16<br />
Men 2 1 0 0 3 4 1 5 4 0 25 1 0 0 33<br />
Subtotal 2 1 0 0 3 4 1 5 8 0 37 1 0 0 49<br />
Women 2 1 0 3 6 2 4 6 11 0 97 0 1 0 114<br />
Men 3 0 0 1 4 3 7 10 13 0 99 1 1 0 123<br />
Subtotal 5 1 0 4 10 5 11 16 24 0 196 1 2 0 237<br />
Women 0 0 0 0 0 1 1 2 15 1 54 0 0 0 70<br />
Men 1 0 0 0 1 2 0 2 31 0 76 0 0 0 110<br />
Subtotal 1 0 0 0 1 3 1 4 46 1 130 0 0 0 180<br />
Women 1 0 0 0 1 0 0 0 4 0 37 0 0 0 42<br />
Men 2 0 0 0 2 0 0 0 1 0 50 0 0 0 51<br />
Subtotal 3 0 0 0 3 0 0 0 5 0 87 0 0 0 93<br />
Women 0 0 0 2 2 6 0 6 23 0 26 0 0 0 58<br />
Men 1 0 0 2 3 1 0 1 17 0 21 0 0 2 43<br />
Subtotal 1 0 0 4 5 7 0 7 40 0 47 0 0 2 101<br />
Women 1 0 0 0 1 3 0 3 14 0 35 0 1 0 53<br />
Men 2 1 1 2 6 3 1 4 23 0 35 1 2 0 62<br />
Subtotal 3 1 1 2 7 6 1 7 37 0 70 1 3 0 115<br />
Women 0 0 0 0 0 9 0 9 5 0 40 0 0 0 52<br />
Men 0 1 0 0 1 2 0 2 7 0 60 0 0 0 68<br />
Subtotal 0 1 0 0 1 11 0 11 12 0 100 0 0 0 120<br />
State/School/Gender<br />
Uniformed Services University<br />
of the Health Sciences F.<br />
Edward Hebert School of<br />
MD<br />
139<br />
University of Maryland School<br />
of Medic<strong>in</strong>e<br />
Michigan State University<br />
College of Human Medic<strong>in</strong>e<br />
University of Michigan <strong>Medical</strong><br />
School<br />
MI<br />
Wayne State University<br />
School of Medic<strong>in</strong>e<br />
Mayo <strong>Medical</strong> School<br />
MN<br />
University of M<strong>in</strong>nesota<br />
<strong>Medical</strong> School<br />
Sa<strong>in</strong>t Louis University School<br />
of Medic<strong>in</strong>e<br />
University of Missouri-<br />
Columbia School of Medic<strong>in</strong>e<br />
MO<br />
University of Missouri-Kansas<br />
City School of Medic<strong>in</strong>e<br />
Wash<strong>in</strong>gton University <strong>in</strong> St.<br />
Louis School of Medic<strong>in</strong>e<br />
University of Mississippi<br />
School of Medic<strong>in</strong>e<br />
MS<br />
Cont<strong>in</strong>ues on next page<br />
Association of American <strong>Medical</strong> Colleges
Table 35: Number of Graduates by State, U.S. <strong>Medical</strong> School, Gender, and Race and Ethnicity, 2011<br />
(cont<strong>in</strong>ued)<br />
Table 35: Number of Graduates by State, U.S. <strong>Medical</strong> School, Gender, and Race and Ethnicity*, 2011 (cont<strong>in</strong>ued)<br />
<strong>Diversity</strong> <strong>in</strong> <strong>Medical</strong> <strong>Education</strong>: <strong>Facts</strong> & <strong>Figures</strong> <strong>2012</strong><br />
Non-Hispanic or<br />
Hispanic or Lat<strong>in</strong>o<br />
Lat<strong>in</strong>o M<strong>in</strong>orities<br />
Non-Hispanic or Lat<strong>in</strong>o Others<br />
Ameri-<br />
Black canMexi-<br />
or Indian<br />
Native<br />
No<br />
can<br />
Other<br />
African or<br />
Hawa-<br />
Race UndupliAmeri-<br />
Puerto<br />
HispaSubAmeri- Alaska Subiian<br />
or<br />
Other<br />
Rescatedcan Rican Cuban nictotalcan Native total Asian OPI White Race Foreign ponse Total<br />
Women 1 0 0 0 1 14 3 17 10 0 23 0 4 0 50<br />
Men 1 0 1 0 2 6 0 6 11 0 32 0 1 0 50<br />
Subtotal 2 0 1 0 3 20 3 23 21 0 55 0 5 0 100<br />
Women 0 0 0 2 2 6 1 7 5 0 25 0 0 0 35<br />
Men 0 0 0 3 3 3 0 3 4 0 28 0 0 0 35<br />
Subtotal 0 0 0 5 5 9 1 10 9 0 53 0 0 0 70<br />
Women 2 1 0 2 5 12 1 13 16 0 54 0 1 0 81<br />
Men 0 0 0 0 0 6 0 6 4 0 63 0 0 0 73<br />
Subtotal 2 1 0 2 5 18 1 19 20 0 117 0 1 0 154<br />
Women 2 1 0 0 3 7 0 7 4 0 46 0 1 0 59<br />
Men 1 0 0 1 2 2 0 2 13 0 44 0 1 0 60<br />
Subtotal 3 1 0 1 5 9 0 9 17 0 90 0 2 0 119<br />
Women 0 0 0 0 0 0 1 1 0 0 17 0 0 0 18<br />
Men 0 0 0 0 0 0 1 1 0 0 36 0 0 0 37<br />
Subtotal 0 0 0 0 0 0 2 2 0 0 53 0 0 0 55<br />
Women 0 0 0 0 0 1 1 2 9 0 44 0 0 0 54<br />
Men 0 0 1 1 2 3 0 3 10 0 51 0 1 0 65<br />
Subtotal 0 0 1 1 2 4 1 5 19 0 95 0 1 0 119<br />
Women 1 0 0 1 2 0 0 0 1 0 40 0 0 0 42<br />
Men 2 0 0 1 3 1 1 2 2 0 61 0 1 2 68<br />
Subtotal 3 0 0 2 5 1 1 2 3 0 101 0 1 2 110<br />
Women 1 0 1 0 2 0 0 0 7 0 19 0 4 3 34<br />
Men 3 0 0 1 4 0 0 0 10 1 19 0 2 0 34<br />
Subtotal 4 0 1 1 6 0 0 0 17 1 38 0 6 3 68<br />
Women 1 2 5 3 11 9 0 9 34 0 37 0 0 0 81<br />
Men 0 3 4 8 15 6 0 6 39 1 48 1 0 1 99<br />
Subtotal 1 5 9 11 26 15 0 15 73 1 85 1 0 1 180<br />
Women 0 1 0 6 7 9 0 9 30 0 47 0 0 1 89<br />
Men 0 0 0 2 2 5 0 5 26 0 34 0 0 0 68<br />
Subtotal 0 1 0 8 9 14 0 14 56 0 81 0 0 1 157<br />
Women 8 0 0 5 13 0 2 2 5 0 29 0 0 1 41<br />
Men 11 0 0 3 14 0 1 1 2 1 29 1 0 0 39<br />
Subtotal 19 0 0 8 27 0 3 3 7 1 58 1 0 1 80<br />
Women 1 0 0 0 1 0 1 1 4 0 18 0 0 0 22<br />
Men 1 0 0 1 2 0 1 1 6 0 26 0 0 0 33<br />
Subtotal 2 0 0 1 3 0 2 2 10 0 44 0 0 0 55<br />
State/School/Gender<br />
Duke University School of<br />
Medic<strong>in</strong>e<br />
140<br />
The Brody School of Medic<strong>in</strong>e<br />
at East Carol<strong>in</strong>a University<br />
NC<br />
University of North Carol<strong>in</strong>a at<br />
Chapel Hill School of Medic<strong>in</strong>e<br />
Wake Forest School of<br />
Medic<strong>in</strong>e of Wake Forest<br />
Baptist <strong>Medical</strong> Center<br />
University of North Dakota<br />
School of Medic<strong>in</strong>e and Health<br />
Sciences<br />
ND<br />
Creighton University School of<br />
Medic<strong>in</strong>e<br />
NE<br />
University of Nebraska<br />
College of Medic<strong>in</strong>e<br />
NH Dartmouth <strong>Medical</strong> School<br />
University of Medic<strong>in</strong>e and<br />
Dentistry of New Jersey-New<br />
Jersey <strong>Medical</strong> School<br />
University of Medic<strong>in</strong>e and<br />
Dentistry of New Jersey-<br />
Robert Wood Johnson<br />
NJ<br />
University of New Mexico<br />
School of Medic<strong>in</strong>e<br />
NM<br />
University of Nevada School<br />
of Medic<strong>in</strong>e<br />
NV<br />
Association of American <strong>Medical</strong> Colleges<br />
Cont<strong>in</strong>ues on next page
Table 35: Number of Graduates by State, U.S. <strong>Medical</strong> School, Gender, and Race and Ethnicity, 2011<br />
(cont<strong>in</strong>ued)<br />
Table 35: Number of Graduates by State, U.S. <strong>Medical</strong> School, Gender, and Race and Ethnicity*, 2011 (cont<strong>in</strong>ued)<br />
<strong>Diversity</strong> <strong>in</strong> <strong>Medical</strong> <strong>Education</strong>: <strong>Facts</strong> & <strong>Figures</strong> <strong>2012</strong><br />
Non-Hispanic or<br />
Hispanic or Lat<strong>in</strong>o<br />
Lat<strong>in</strong>o M<strong>in</strong>orities<br />
Non-Hispanic or Lat<strong>in</strong>o Others<br />
Ameri-<br />
Black canMexi-<br />
or Indian<br />
Native<br />
No<br />
can<br />
Other<br />
African or<br />
Hawa-<br />
Race UndupliAmeri-<br />
Puerto<br />
HispaSubAmeri- Alaska Subiian<br />
or<br />
Other<br />
Rescatedcan Rican Cuban nictotalcan Native total Asian OPI White Race Foreign ponse Total<br />
Women 2 2 0 1 5 0 2 2 23 1 38 0 2 4 77<br />
Men 0 0 0 1 1 1 0 1 24 0 39 1 1 3 71<br />
Subtotal 2 2 0 2 6 1 2 3 47 1 77 1 3 7 148<br />
Women 0 1 1 0 2 7 1 8 26 2 44 1 6 0 87<br />
Men 2 1 1 2 6 7 0 7 21 0 66 0 5 1 101<br />
Subtotal 2 2 2 2 8 14 1 15 47 2 110 1 11 1 188<br />
Women 4 1 0 5 10 5 0 5 12 0 44 0 6 0 67<br />
Men 1 3 2 0 6 6 0 6 8 0 49 0 2 1 66<br />
Subtotal 5 4 2 5 16 11 0 11 20 0 93 0 8 1 133<br />
Women 2 2 2 4 10 3 1 4 13 0 45 2 3 0 65<br />
Men 0 2 3 2 7 3 1 4 11 0 35 0 4 1 57<br />
Subtotal 2 4 5 6 17 6 2 8 24 0 80 2 7 1 122<br />
Women 0 0 0 1 1 2 1 3 40 1 63 0 2 7 113<br />
Men 0 0 0 4 4 0 0 0 36 1 44 0 2 2 86<br />
Subtotal 0 0 0 5 5 2 1 3 76 2 107 0 4 9 199<br />
Women 2 3 1 6 12 5 0 5 27 1 44 0 1 5 86<br />
Men 1 1 1 3 6 5 2 7 24 0 53 0 0 3 86<br />
Subtotal 3 4 2 9 18 10 2 12 51 1 97 0 1 8 172<br />
Women 1 3 1 3 8 14 0 14 29 1 37 1 0 13 96<br />
Men 0 1 0 4 5 4 1 5 24 0 56 0 1 9 97<br />
Subtotal 1 4 1 7 13 18 1 19 53 1 93 1 1 22 193<br />
Women 0 0 0 0 0 9 1 10 15 0 43 0 6 0 74<br />
Men 0 0 0 0 0 3 0 3 18 0 51 0 9 0 82<br />
Subtotal 0 0 0 0 0 12 1 13 33 0 94 0 15 0 156<br />
Women 0 1 0 3 4 3 0 3 22 0 25 1 1 9 63<br />
Men 1 0 1 0 2 3 0 3 18 0 28 1 1 2 55<br />
Subtotal 1 1 1 3 6 6 0 6 40 0 53 2 2 11 118<br />
Women 0 0 1 0 1 1 1 2 33 0 41 0 0 0 75<br />
Men 0 0 0 1 1 3 0 3 14 0 47 0 0 1 65<br />
Subtotal 0 0 1 1 2 4 1 5 47 0 88 0 0 1 140<br />
Women 0 0 0 0 0 5 3 8 11 0 37 0 0 0 56<br />
Men 1 1 0 1 3 3 0 3 11 0 33 1 0 0 51<br />
Subtotal 1 1 0 1 3 8 3 11 22 0 70 1 0 0 107<br />
Women 0 1 0 5 6 8 0 8 10 0 30 0 0 0 51<br />
Men 4 1 0 2 7 6 1 7 3 0 29 1 0 1 42<br />
Subtotal 4 2 0 7 13 14 1 15 13 0 59 1 0 1 93<br />
State/School/Gender<br />
Albany <strong>Medical</strong> College<br />
141<br />
Albert E<strong>in</strong>ste<strong>in</strong> College of<br />
Medic<strong>in</strong>e of Yeshiva<br />
University<br />
Columbia University College<br />
of Physicians and Surgeons<br />
Mount S<strong>in</strong>ai School of<br />
Medic<strong>in</strong>e<br />
New York <strong>Medical</strong> College<br />
New York University School of<br />
Medic<strong>in</strong>e<br />
NY<br />
State University of New York<br />
Downstate <strong>Medical</strong> Center<br />
College of Medic<strong>in</strong>e<br />
State University of New York<br />
Upstate <strong>Medical</strong> University<br />
The School of Medic<strong>in</strong>e at<br />
Stony Brook University<br />
<strong>Medical</strong> Center<br />
University at Buffalo State<br />
University of New York School<br />
of Medic<strong>in</strong>e & Biomedical<br />
University of Rochester<br />
School of Medic<strong>in</strong>e and<br />
Dentistry<br />
Weill Cornell <strong>Medical</strong> College<br />
Cont<strong>in</strong>ues on next page<br />
Association of American <strong>Medical</strong> Colleges
Table 35: Number of Graduates by State, U.S. <strong>Medical</strong> School, Gender, and Race and Ethnicity, 2011<br />
(cont<strong>in</strong>ued)<br />
Table 35: Number of Graduates by State, U.S. <strong>Medical</strong> School, Gender, and Race and Ethnicity*, 2011 (cont<strong>in</strong>ued)<br />
<strong>Diversity</strong> <strong>in</strong> <strong>Medical</strong> <strong>Education</strong>: <strong>Facts</strong> & <strong>Figures</strong> <strong>2012</strong><br />
Non-Hispanic or<br />
Hispanic or Lat<strong>in</strong>o<br />
Lat<strong>in</strong>o M<strong>in</strong>orities<br />
Non-Hispanic or Lat<strong>in</strong>o Others<br />
Ameri-<br />
Black canMexi-<br />
or Indian<br />
Native<br />
No<br />
can<br />
Other<br />
African or<br />
Hawa-<br />
Race UndupliAmeri-<br />
Puerto<br />
HispaSubAmeri- Alaska Subiian<br />
or<br />
Other<br />
Rescatedcan Rican Cuban nictotalcan Native total Asian OPI White Race Foreign ponse Total<br />
Women 0 3 1 2 6 3 1 4 28 0 44 0 9 0 86<br />
Men 1 0 0 2 3 4 1 5 26 0 68 0 2 2 104<br />
Subtotal 1 3 1 4 9 7 2 9 54 0 112 0 11 2 190<br />
Women 0 0 1 1 2 3 0 3 26 1 30 0 0 1 59<br />
Men 0 1 0 1 2 1 1 2 20 0 43 0 0 2 64<br />
Subtotal 0 1 1 2 4 4 1 5 46 1 73 0 0 3 123<br />
Women 0 0 0 0 0 10 0 10 18 0 63 0 1 0 89<br />
Men 2 5 1 1 9 2 0 2 20 0 91 0 0 0 117<br />
Subtotal 2 5 1 1 9 12 0 12 38 0 154 0 1 0 206<br />
Women 0 0 1 0 1 8 0 8 20 0 48 0 0 0 74<br />
Men 2 0 0 0 2 2 0 2 18 0 63 0 1 0 86<br />
Subtotal 2 0 1 0 3 10 0 10 38 0 111 0 1 0 160<br />
Women 0 0 0 0 0 2 0 2 10 0 52 0 0 0 64<br />
Men 1 0 0 1 2 8 0 8 20 0 65 0 0 0 91<br />
Subtotal 1 0 0 1 2 10 0 10 30 0 117 0 0 0 155<br />
Women 0 0 0 0 0 7 1 8 11 0 36 0 0 0 53<br />
Men 1 0 0 0 1 0 0 0 6 0 41 0 0 0 46<br />
Subtotal 1 0 0 0 1 7 1 8 17 0 77 0 0 0 99<br />
Women 0 0 0 1 1 1 9 10 13 0 45 0 0 0 65<br />
Men 2 0 0 2 4 1 10 11 16 0 71 2 0 0 99<br />
Subtotal 2 0 0 3 5 2 19 21 29 0 116 2 0 0 164<br />
Women 1 0 0 0 1 0 0 0 6 0 48 1 0 0 56<br />
Men 0 0 0 0 0 1 1 2 4 0 39 0 0 1 45<br />
Subtotal 1 0 0 0 1 1 1 2 10 0 87 1 0 1 101<br />
Women 2 0 0 4 6 8 1 9 43 0 71 0 0 0 125<br />
Men 1 0 0 3 4 4 0 4 54 1 88 0 0 3 148<br />
Subtotal 3 0 0 7 10 12 1 13 97 1 159 0 0 3 273<br />
Women 0 0 0 0 0 6 0 6 35 0 74 0 6 0 117<br />
Men 1 0 0 4 5 5 2 7 38 1 86 0 4 4 134<br />
Subtotal 1 0 0 4 5 11 2 13 73 1 160 0 10 4 251<br />
Women 1 1 1 0 3 7 0 7 12 1 51 0 7 0 76<br />
Men 1 1 1 0 3 3 0 3 12 1 51 0 8 0 74<br />
Subtotal 2 2 2 0 6 10 0 10 24 2 102 0 15 0 150<br />
Women 0 3 1 3 7 7 1 8 12 0 54 0 1 0 75<br />
Men 2 2 0 4 8 7 0 7 14 0 43 0 1 3 71<br />
Subtotal 2 5 1 7 15 14 1 15 26 0 97 0 2 3 146<br />
State/School/Gender<br />
Case Western Reserve<br />
University School of Medic<strong>in</strong>e<br />
142<br />
Northeast Ohio <strong>Medical</strong><br />
University<br />
Ohio State University College<br />
of Medic<strong>in</strong>e<br />
OH<br />
The University of Toledo<br />
College of Medic<strong>in</strong>e<br />
University of C<strong>in</strong>c<strong>in</strong>nati<br />
College of Medic<strong>in</strong>e<br />
Wright State University<br />
Boonshoft School of Medic<strong>in</strong>e<br />
University of Oklahoma<br />
College of Medic<strong>in</strong>e<br />
OK<br />
Oregon Health & Science<br />
University School of Medic<strong>in</strong>e<br />
OR<br />
Drexel University College of<br />
Medic<strong>in</strong>e<br />
Jefferson <strong>Medical</strong> College of<br />
Thomas Jefferson University<br />
Pennsylvania State University<br />
College of Medic<strong>in</strong>e<br />
PA<br />
Raymond and Ruth Perelman<br />
School of Medic<strong>in</strong>e at the<br />
University of Pennsylvania<br />
Association of American <strong>Medical</strong> Colleges<br />
Cont<strong>in</strong>ues on next page
Table 35: Number of Graduates by State, U.S. <strong>Medical</strong> School, Gender, and Race and Ethnicity, 2011<br />
(cont<strong>in</strong>ued)<br />
Table 35: Number of Graduates by State, U.S. <strong>Medical</strong> School, Gender, and Race and Ethnicity*, 2011 (cont<strong>in</strong>ued)<br />
<strong>Diversity</strong> <strong>in</strong> <strong>Medical</strong> <strong>Education</strong>: <strong>Facts</strong> & <strong>Figures</strong> <strong>2012</strong><br />
Non-Hispanic or<br />
Hispanic or Lat<strong>in</strong>o<br />
Lat<strong>in</strong>o M<strong>in</strong>orities<br />
Non-Hispanic or Lat<strong>in</strong>o Others<br />
Ameri-<br />
Black canMexi-<br />
or Indian<br />
Native<br />
No<br />
can<br />
Other<br />
African or<br />
Hawa-<br />
Race UndupliAmeri-<br />
Puerto<br />
HispaSubAmeri- Alaska Subiian<br />
or<br />
Other<br />
Rescatedcan Rican Cuban nictotalcan Native total Asian OPI White Race Foreign ponse Total<br />
Women 0 4 3 3 10 11 1 12 24 0 56 0 0 0 91<br />
Men 4 1 3 3 11 1 3 4 10 0 77 1 0 0 94<br />
Subtotal 4 5 6 6 21 12 4 16 34 0 133 1 0 0 185<br />
Women 2 1 1 6 10 11 0 11 17 1 48 0 0 0 78<br />
Men 0 0 0 0 0 6 0 6 25 0 42 0 0 0 71<br />
Subtotal 2 1 1 6 10 17 0 17 42 1 90 0 0 0 149<br />
Women 0 23 3 3 29 1 0 1 1 0 26 0 0 1 32<br />
Men 1 22 1 2 26 1 0 1 1 1 18 0 0 1 27<br />
Subtotal 1 45 4 5 55 2 0 2 2 1 44 0 0 2 59<br />
Women 0 24 0 1 25 2 0 2 1 0 19 0 0 9 35<br />
Men 0 18 0 0 18 1 0 1 0 0 14 0 0 6 24<br />
Subtotal 0 42 0 1 43 3 0 3 1 0 33 0 0 15 59<br />
Women 1 22 3 4 30 1 0 1 0 0 23 1 0 0 29<br />
Men 1 28 1 1 31 1 0 1 0 0 28 0 1 0 33<br />
Subtotal 2 50 4 5 61 2 0 2 0 0 51 1 1 0 62<br />
Women 0 44 0 2 46 5 0 5 0 0 37 0 0 0 47<br />
Men 1 50 0 0 51 5 1 6 0 0 34 1 0 0 51<br />
Subtotal 1 94 0 2 97 10 1 11 0 0 71 1 0 0 98<br />
Women 2 1 0 0 3 4 0 4 10 0 30 0 4 0 54<br />
Men 0 0 1 2 3 2 0 2 12 0 23 0 2 0 46<br />
Subtotal 2 1 1 2 6 6 0 6 22 0 53 0 6 0 100<br />
Women 1 0 0 1 2 8 0 8 4 0 47 0 0 0 59<br />
Men 1 0 0 1 2 10 3 13 9 1 83 1 1 0 104<br />
Subtotal 2 0 0 2 4 18 3 21 13 1 130 1 1 0 163<br />
Women 0 0 0 0 0 6 0 6 10 0 25 0 0 0 40<br />
Men 0 0 0 0 0 1 0 1 5 0 35 0 0 0 40<br />
Subtotal 0 0 0 0 0 7 0 7 15 0 60 0 0 0 80<br />
Women 0 0 0 0 0 0 0 0 0 0 26 0 0 0 26<br />
Men 0 0 0 0 0 0 2 2 1 0 23 0 0 0 25<br />
Subtotal 0 0 0 0 0 0 2 2 1 0 49 0 0 0 51<br />
Women 0 1 0 0 1 0 0 0 5 0 27 0 0 0 30<br />
Men 0 0 0 0 0 2 0 2 0 0 27 0 0 0 30<br />
Subtotal 0 1 0 0 1 2 0 2 5 0 54 0 0 0 60<br />
State/School/Gender<br />
Temple University School of<br />
Medic<strong>in</strong>e<br />
143<br />
University of Pittsburgh<br />
School of Medic<strong>in</strong>e<br />
Ponce School of Medic<strong>in</strong>e and<br />
Health Sciences<br />
San Juan Bautista School of<br />
Medic<strong>in</strong>e<br />
PR<br />
Universidad Central del Caribe<br />
School of Medic<strong>in</strong>e<br />
University of Puerto Rico<br />
School of Medic<strong>in</strong>e<br />
The Warren Alpert <strong>Medical</strong><br />
School of Brown University<br />
RI<br />
<strong>Medical</strong> University of South<br />
Carol<strong>in</strong>a College of Medic<strong>in</strong>e<br />
SC<br />
University of South Carol<strong>in</strong>a<br />
School of Medic<strong>in</strong>e<br />
Sanford School of Medic<strong>in</strong>e<br />
The University of South<br />
Dakota<br />
East Tennessee State<br />
University James H. Quillen<br />
College of Medic<strong>in</strong>e<br />
SD<br />
Cont<strong>in</strong>ues on next page<br />
Association of American <strong>Medical</strong> Colleges
Table 35: Number of Graduates by State, U.S. <strong>Medical</strong> School, Gender, and Race and Ethnicity, 2011<br />
(cont<strong>in</strong>ued)<br />
Table 35: Number of Graduates by State, U.S. <strong>Medical</strong> School, Gender, and Race and Ethnicity*, 2011 (cont<strong>in</strong>ued)<br />
<strong>Diversity</strong> <strong>in</strong> <strong>Medical</strong> <strong>Education</strong>: <strong>Facts</strong> & <strong>Figures</strong> <strong>2012</strong><br />
Non-Hispanic or<br />
Hispanic or Lat<strong>in</strong>o<br />
Lat<strong>in</strong>o M<strong>in</strong>orities<br />
Non-Hispanic or Lat<strong>in</strong>o Others<br />
Ameri-<br />
Black canMexi-<br />
or Indian<br />
Native<br />
No<br />
can<br />
Other<br />
African or<br />
Hawa-<br />
Race UndupliAmeri-<br />
Puerto<br />
HispaSubAmeri- Alaska Subiian<br />
or<br />
Other<br />
Rescatedcan Rican Cuban nictotalcan Native total Asian OPI White Race Foreign ponse Total<br />
Women 0 0 1 2 3 51 1 52 5 0 4 0 1 0 61<br />
Men 0 1 1 0 2 25 0 25 1 0 5 0 0 0 31<br />
Subtotal 0 1 2 2 5 76 1 77 6 0 9 0 1 0 92<br />
Women 0 1 0 2 3 14 0 14 9 0 37 0 0 0 60<br />
Men 0 0 0 0 0 6 1 7 8 0 69 0 0 0 82<br />
Subtotal 0 1 0 2 3 20 1 21 17 0 106 0 0 0 142<br />
Women 0 0 0 1 1 6 1 7 16 0 22 0 4 0 45<br />
Men 1 0 1 0 2 2 0 2 6 0 38 0 4 1 52<br />
Subtotal 1 0 1 1 3 8 1 9 22 0 60 0 8 1 97<br />
Women 13 1 2 7 23 5 1 6 34 0 55 0 1 0 96<br />
Men 9 0 0 2 11 2 3 5 23 1 47 0 0 0 80<br />
Subtotal 22 1 2 9 34 7 4 11 57 1 102 0 1 0 176<br />
Women 7 0 0 4 11 1 0 1 21 0 32 1 0 0 56<br />
Men 2 0 0 1 3 0 0 0 17 0 23 3 0 0 43<br />
Subtotal 9 0 0 5 14 1 0 1 38 0 55 4 0 0 99<br />
Women 3 0 0 4 7 1 1 2 22 0 31 1 1 0 57<br />
Men 9 0 0 3 12 1 1 2 16 1 59 2 0 2 86<br />
Subtotal 12 0 0 7 19 2 2 4 38 1 90 3 1 2 143<br />
Women 13 0 0 6 19 8 3 11 25 0 75 1 0 0 109<br />
Men 14 1 0 3 18 5 0 5 18 0 71 2 1 2 107<br />
Subtotal 27 1 0 9 37 13 3 16 43 0 146 3 1 2 216<br />
Women 10 0 1 3 14 17 0 17 10 0 62 2 5 0 103<br />
Men 14 1 0 4 19 8 2 10 20 0 78 0 0 0 110<br />
Subtotal 24 1 1 7 33 25 2 27 30 0 140 2 5 0 213<br />
Women 13 0 1 5 19 9 0 9 16 0 79 1 2 0 113<br />
Men 10 0 1 2 13 7 0 7 20 1 91 0 1 4 129<br />
Subtotal 23 0 2 7 32 16 0 16 36 1 170 1 3 4 242<br />
Women 10 1 2 2 15 16 0 16 34 1 38 2 2 0 94<br />
Men 11 2 0 5 18 3 2 5 38 0 57 2 1 4 113<br />
Subtotal 21 3 2 7 33 19 2 21 72 1 95 4 3 4 207<br />
Women 0 0 0 0 0 0 0 0 8 0 23 0 1 0 32<br />
Men 1 1 0 3 5 1 0 1 6 0 65 0 0 0 74<br />
Subtotal 1 1 0 3 5 1 0 1 14 0 88 0 1 0 106<br />
State/School/Gender<br />
Meharry <strong>Medical</strong> College<br />
TN<br />
University of Tennessee<br />
Health Science Center<br />
College of Medic<strong>in</strong>e<br />
144<br />
Vanderbilt University School<br />
of Medic<strong>in</strong>e<br />
Baylor College of Medic<strong>in</strong>e<br />
Texas A&M Health Science<br />
Center College of Medic<strong>in</strong>e<br />
Texas Tech University Health<br />
Sciences Center School of<br />
Medic<strong>in</strong>e<br />
The University of Texas<br />
School of Medic<strong>in</strong>e at San<br />
Antonio<br />
TX<br />
University of Texas <strong>Medical</strong><br />
Branch School of Medic<strong>in</strong>e<br />
University of Texas <strong>Medical</strong><br />
School at Houston<br />
University of Texas<br />
Southwestern <strong>Medical</strong> Center<br />
at Dallas Southwestern<br />
University of Utah School of<br />
Medic<strong>in</strong>e<br />
UT<br />
Association of American <strong>Medical</strong> Colleges<br />
Cont<strong>in</strong>ues on next page
Table 35: Number of Graduates by State, U.S. <strong>Medical</strong> School, Gender, and Race and Ethnicity, 2011<br />
(cont<strong>in</strong>ued)<br />
Table 35: Number of Graduates by State, U.S. <strong>Medical</strong> School, Gender, and Race and Ethnicity*, 2011 (cont<strong>in</strong>ued)<br />
Non-Hispanic or Lat<strong>in</strong>o Others<br />
Non-Hispanic or<br />
Lat<strong>in</strong>o M<strong>in</strong>orities<br />
Hispanic or Lat<strong>in</strong>o<br />
<strong>Diversity</strong> <strong>in</strong> <strong>Medical</strong> <strong>Education</strong>: <strong>Facts</strong> & <strong>Figures</strong> <strong>2012</strong><br />
Ameri-<br />
State/School/Gender<br />
Black canMexi-<br />
or Indian<br />
Native<br />
No<br />
can<br />
Other<br />
African or<br />
Hawa-<br />
Race UndupliAmeri-<br />
Puerto<br />
HispaSubAmeri- Alaska Subiian<br />
or<br />
Other<br />
Rescatedcan Rican Cuban nictotalcan Native total Asian OPI White Race Foreign ponse Total<br />
Women 0 0 0 0 0 5 1 6 12 0 36 0 2 0 53<br />
Eastern Virg<strong>in</strong>ia <strong>Medical</strong><br />
Men 2 0 0 0 2 0 0 0 10 0 38 0 3 0 51<br />
School<br />
Subtotal 2 0 0 0 2 5 1 6 22 0 74 0 5 0 104<br />
Women 2 2 2 1 7 6 0 6 11 0 46 0 1 0 65<br />
University of Virg<strong>in</strong>ia School of<br />
VA<br />
Men 0 0 1 4 5 1 0 1 13 1 57 0 1 0 71<br />
Medic<strong>in</strong>e<br />
Subtotal 2 2 3 5 12 7 0 7 24 1 103 0 2 0 136<br />
Women 0 0 0 2 2 7 0 7 27 1 48 0 0 0 85<br />
Virg<strong>in</strong>ia Commonwealth<br />
Men 0 0 0 0 0 2 1 3 22 0 67 0 0 0 92<br />
University School of Medic<strong>in</strong>e<br />
Subtotal 0 0 0 2 2 9 1 10 49 1 115 0 0 0 177<br />
Women 2 1 0 1 4 1 0 1 9 0 46 0 1 0 56<br />
University of Vermont College<br />
VT<br />
Men 0 1 0 1 2 1 0 1 4 0 45 0 4 0 56<br />
of Medic<strong>in</strong>e<br />
Subtotal 2 2 0 2 6 2 0 2 13 0 91 0 5 0 112<br />
Women 2 0 0 3 5 0 1 1 16 0 82 0 0 0 98<br />
University of Wash<strong>in</strong>gton<br />
WA<br />
Men 1 1 0 1 3 1 1 2 13 0 77 0 0 0 90<br />
School of Medic<strong>in</strong>e<br />
Subtotal 3 1 0 4 8 1 2 3 29 0 159 0 0 0 188<br />
Women 5 2 0 1 8 3 0 3 24 0 79 0 1 0 108<br />
<strong>Medical</strong> College of Wiscons<strong>in</strong> Men 3 2 1 2 8 3 1 4 13 0 80 1 2 0 99<br />
Subtotal 8 4 1 3 16 6 1 7 37 0 159 1 3 0 207<br />
WI<br />
University of Wiscons<strong>in</strong> Women 1 0 0 2 3 4 0 4 13 0 59 0 0 0 77<br />
School of Medic<strong>in</strong>e and Public Men 1 0 0 1 2 4 0 4 11 0 56 0 0 1 72<br />
Health<br />
Subtotal 2 0 0 3 5 8 0 8 24 0 115 0 0 1 149<br />
Women 0 0 0 0 0 0 0 0 1 0 33 0 0 1 35<br />
Marshall University Joan C.<br />
Men 0 0 0 1 1 0 0 0 8 0 31 0 0 0 37<br />
Edwards School of Medic<strong>in</strong>e<br />
Subtotal 0 0 0 1 1 0 0 0 9 0 64 0 0 1 72<br />
WV<br />
Women 0 0 0 2 2 0 1 1 8 1 35 0 0 0 44<br />
West Virg<strong>in</strong>ia University<br />
Men 0 0 0 0 0 0 0 0 8 1 42 0 0 0 50<br />
School of Medic<strong>in</strong>e<br />
Subtotal 0 0 0 2 2 0 1 1 16 2 77 0 0 0 94<br />
* Start<strong>in</strong>g <strong>in</strong> 2002, students had the option of report<strong>in</strong>g their race and ethnicity alone or <strong>in</strong> comb<strong>in</strong>ation with some other race and ethnicity,<br />
therefore, the unduplicated total was given.<br />
Data Source:<strong>AAMC</strong> Data Warehouse: Student_Ind_R and App_Bio_R, as of March 16, <strong>2012</strong>.<br />
145<br />
Association of American <strong>Medical</strong> Colleges
<strong>Diversity</strong> <strong>in</strong> <strong>Medical</strong> <strong>Education</strong>: <strong>Facts</strong> & <strong>Figures</strong> <strong>2012</strong><br />
Table 36: U.S. <strong>Medical</strong> School M.D./Ph.D. Graduates by Race and Ethnicity, 1980–2011<br />
Table 36: U.S. <strong>Medical</strong> School M.D./Ph.D. Graduates by Race and Ethnicity, 1980-2011<br />
Year<br />
Mexican<br />
American<br />
Hispanic or Lat<strong>in</strong>o<br />
Puerto<br />
Rican Cuban<br />
Other<br />
Hispanic Subtotal<br />
146<br />
Black or<br />
African<br />
American<br />
American<br />
Indian or<br />
Alaska<br />
Native Asian<br />
Native<br />
Hawaiian<br />
or OPI White<br />
Other<br />
Race Foreign Unknown<br />
Unduplicated<br />
Total<br />
1980 0 0 0 1 1 2 0 1 0 24 1 0 15 44<br />
1981 0 0 0 0 0 0 2 2 0 36 1 1 10 52<br />
1982 0 0 0 0 0 1 0 3 0 47 3 1 11 66<br />
1983 0 0 0 0 0 3 0 0 0 47 0 1 8 59<br />
1984 0 0 0 2 2 2 0 1 0 64 1 4 5 79<br />
1985 0 0 0 0 0 1 0 3 0 63 0 1 5 73<br />
1986 0 0 0 1 1 1 0 8 0 80 0 2 3 95<br />
1987 0 0 0 0 0 4 1 7 0 100 0 2 3 117<br />
1988 1 1 0 3 5 2 0 12 0 104 0 2 3 128<br />
1989 1 0 0 1 2 2 0 13 0 126 0 3 2 148<br />
1990 1 0 0 5 6 5 0 21 0 174 0 3 2 211<br />
1991 2 0 0 1 3 6 0 26 0 166 0 3 3 207<br />
1992 1 0 0 4 5 0 0 32 0 207 0 2 2 248<br />
1993 0 0 0 4 4 5 0 34 0 201 0 4 0 248<br />
1994 0 1 0 6 7 9 1 50 0 226 0 4 0 297<br />
1995 3 1 0 2 6 9 1 52 0 236 0 8 2 313<br />
1996 3 2 0 5 10 8 1 53 0 243 0 5 5 325<br />
1997 5 3 0 6 14 10 1 63 0 269 0 10 7 374<br />
1998 13 2 0 5 20 13 1 84 0 268 0 10 4 400<br />
1999 5 0 0 10 15 9 1 73 0 237 0 14 2 351<br />
2000 5 4 0 4 13 14 1 74 0 271 0 11 2 386<br />
2001 2 0 0 4 6 18 0 89 0 263 0 15 1 392<br />
2002 3 1 0 6 10 13 2 97 0 194 0 7 4 327<br />
2003 2 3 0 9 14 23 1 106 0 263 0 15 6 428<br />
2004 11 5 0 7 23 20 1 105 0 238 0 10 3 400<br />
2005 3 1 0 11 15 14 2 99 0 239 0 15 5 389<br />
2006 4 2 0 10 16 21 0 108 0 259 0 6 7 417<br />
2007 10 3 0 15 28 20 0 113 0 301 1 26 7 494<br />
2008 6 4 0 7 17 28 2 112 0 318 1 21 4 499<br />
2009 8 4 0 12 24 39 1 93 0 365 5 21 10 547<br />
2010 9 4 1 19 33 32 0 121 1 346 17 20 5 535<br />
2011 13 4 3 11 31 26 6 119 0 377 18 20 1 564<br />
Data Source: <strong>AAMC</strong> Data Warehouse: Student_Ind_R and App_Bio_R, as of March 19, <strong>2012</strong><br />
Non-Hispanic or Lat<strong>in</strong>o<br />
Association of American <strong>Medical</strong> Colleges
Table 37a: MCAT Scores and GPAs for U.S. <strong>Medical</strong> School Applicants by Race and Ethnicity, 2011<br />
Table 37A: MCAT Scores and GPAs for U.S. <strong>Medical</strong> School Applicants by Race and Ethnicity, 2011<br />
Hispanic or Lat<strong>in</strong>o Non-Hispanic or Lat<strong>in</strong>o<br />
Table 37A: MCAT Scores and GPAs for U.S. <strong>Medical</strong> School Applicants by Race and Ethnicity, 2011<br />
Applicants, 2011<br />
Other Multiple Black or<br />
Native Hawaiian<br />
Mexican Puerto<br />
American Indian<br />
Other No Race More than Foreign All<br />
Cuban Hispanic or Hispanic or African Asian<br />
or Other Pacific White<br />
American Rican Hispanic or Lat<strong>in</strong>o or Alaska Native Non-Hispanic or Lat<strong>in</strong>o Race Response One Race<br />
Lat<strong>in</strong>o Lat<strong>in</strong>o American<br />
Islander<br />
MCAT Applicants, VR 2011<br />
Other Multiple Black or<br />
Native Hawaiian<br />
Mean Mexican 8.6 Puerto 6.5 8.4 8.2 8.3 7.1 9.0 American 8.6 Indian 7.8 9.4 Other 8.5 No 9.7 Race More 9.3than Foreign<br />
8.6 9.0 All<br />
Cuban Hispanic or Hispanic or African Asian<br />
or Other Pacific White<br />
SD*<br />
American<br />
2.1<br />
Rican<br />
2.5 2.2 2.3 2.2 2.3 2.1<br />
or Alaska<br />
2.0<br />
Native<br />
2.0 1.9<br />
Race<br />
2.7<br />
Response<br />
2.0<br />
One<br />
2.0<br />
Race<br />
Lat<strong>in</strong>o Lat<strong>in</strong>o American<br />
Islander<br />
2.2 2.1<br />
MCAT PS Mean 8.6 7.0 8.9 8.3 8.0 7.2 10.1 8.0 8.2 9.5 9.1 10.1 9.5 10.1 9.4<br />
MCAT VR Mean 8.6 6.5 8.4 8.2 8.3 7.1 9.0 8.6 7.8 9.4 8.5 9.7 9.3 8.6 9.0<br />
SD 2.1 2.1 2.1 2.2 2.0 2.1 2.2 2.0 2.2 2.1 2.3 2.1 2.2 2.3 2.3<br />
SD* 2.1 2.5 2.2 2.3 2.2 2.3 2.1 2.0 2.0 1.9 2.7 2.0 2.0 2.2 2.1<br />
MCAT BS Mean 9.5 7.7 9.5 9.0 8.7 7.7 10.2 8.7 8.5 10.1 9.5 10.4 10.1 10.4 9.9<br />
MCAT PS Mean 8.6 7.0 8.9 8.3 8.0 7.2 10.1 8.0 8.2 9.5 9.1 10.1 9.5 10.1 9.4<br />
SD 2.0 2.4 2.0 2.2 2.2 2.3 2.0 2.0 2.3 1.9 2.3 1.9 2.0 2.2 2.1<br />
SD 2.1 2.1 2.1 2.2 2.0 2.1 2.2 2.0 2.2 2.1 2.3 2.1 2.2 2.3 2.3<br />
Total MCAT** Mean 26.6 21.1 26.8 25.6 25.1 22.0 29.2 25.2 24.6 29.0 27.1 30.2 28.9 29.1 28.2<br />
MCAT BS Mean 9.5 7.7 9.5 9.0 8.7 7.7 10.2 8.7 8.5 10.1 9.5 10.4 10.1 10.4 9.9<br />
SD 5.1 6.0 5.3 5.7 5.5 5.6 5.3 4.9 5.6 4.8 6.6 5.0 5.2 5.7 5.5<br />
SD 2.0 2.4 2.0 2.2 2.2 2.3 2.0 2.0 2.3 1.9 2.3 1.9 2.0 2.2 2.1<br />
MCAT WS Median O M O O N N P O O P Q P P Q P<br />
Total MCAT** Mean 26.6 21.1 26.8 25.6 25.1 22.0 29.2 25.2 24.6 29.0 27.1 30.2 28.9 29.1 28.2<br />
GPA Science Mean 3.25 3.20 3.37 3.27 3.22 3.07 3.44 3.30 3.21 3.50 3.46 3.49 3.40 3.52 3.43<br />
SD 5.1 6.0 5.3 5.7 5.5 5.6 5.3 4.9 5.6 4.8 6.6 5.0 5.2 5.7 5.5<br />
SD 0.46 0.51 0.45 0.47 0.46 0.51 0.41 0.45 0.53 0.38 0.28 0.39 0.42 0.44 0.43<br />
MCAT WS Median O M O O N N P O O P Q P P Q P<br />
GPA non-Science Mean 3.54 3.59 3.65 3.58 3.56 3.49 3.65 3.60 3.57 3.68 3.70 3.68 3.65 3.66 3.65<br />
GPA Science Mean 3.25 3.20 3.37 3.27 3.22 3.07 3.44 3.30 3.21 3.50 3.46 3.49 3.40 3.52 3.43<br />
SD 0.34 0.34 0.34 0.33 0.34 0.36 0.30 0.27 0.36 0.29 0.29 0.28 0.30 0.32 0.30<br />
SD 0.46 0.51 0.45 0.47 0.46 0.51 0.41 0.45 0.53 0.38 0.28 0.39 0.42 0.44 0.43<br />
GPA total Mean 3.38 3.37 3.49 3.41 3.37 3.26 3.53 3.46 3.37 3.58 3.56 3.57 3.51 3.58 3.53<br />
GPA non-Science Mean 3.54 3.59 3.65 3.58 3.56 3.49 3.65 3.60 3.57 3.68 3.70 3.68 3.65 3.66 3.65<br />
SD 0.37 0.39 0.38 0.37 0.37 0.40 0.34 0.34 0.43 0.31 0.25 0.31 0.34 0.36 0.34<br />
SD 0.34 0.34 0.34 0.33 0.34 0.36 0.30 0.27 0.36 0.29 0.29 0.28 0.30 0.32 0.30<br />
Total Applicants 816 677 302 1,487 177 3,215 8,941 101 84 23,958 13 1,304 1,197 1,647 43,919<br />
GPA total Mean 3.38 3.37 3.49 3.41 3.37 3.26 3.53 3.46 3.37 3.58 3.56 3.57 3.51 3.58 3.53<br />
SD 0.37 0.39 0.38 0.37 0.37 0.40 0.34 0.34 0.43 0.31 0.25 0.31 0.34 0.36 0.34<br />
Total Applicants 816 677 302 1,487 177 3,215 8,941 101 84 23,958 13 1,304 1,197 1,647 43,919<br />
<strong>Diversity</strong> <strong>in</strong> <strong>Medical</strong> <strong>Education</strong>: <strong>Facts</strong> & <strong>Figures</strong> <strong>2012</strong><br />
147<br />
Table 37B: MCAT Scores and GPAs for U.S. <strong>Medical</strong> School Matriculants by Race and Ethnicity, 2011<br />
Table 37b: MCAT Scores and GPAs for U.S. <strong>Medical</strong> School Matriculants by Race and Ethnicity, 2011<br />
Hispanic or Lat<strong>in</strong>o Non-Hispanic or Lat<strong>in</strong>o<br />
Table 37B: MCAT Scores and GPAs for U.S. <strong>Medical</strong> School Matriculants by Race and Ethnicity, 2011<br />
Matriculants, 2011<br />
Other Multiple Black or<br />
Native Hawaiian<br />
Mexican Puerto<br />
American Indian<br />
Other No Race More than Foreign All<br />
Cuban Hispanic or Hispanic or African Asian<br />
or Other Pacific White<br />
American Rican Hispanic or Lat<strong>in</strong>o or Alaska Native<br />
Race Response One Race<br />
Lat<strong>in</strong>o Lat<strong>in</strong>o American<br />
Non-Hispanic<br />
Islander<br />
or Lat<strong>in</strong>o<br />
MCAT Matriculants, VR 2011 Mean 9.3 7.5 9.3 Other 9.2 Multiple 9.4 Black 8.4or 9.9 9.4 Native 8.6 Hawaiian<br />
Mexican Puerto<br />
American Indian<br />
10.1 Other 10.3 No 10.4 Race More 10.0 than Foreign 9.7 9.8 All<br />
Cuban Hispanic or Hispanic or African Asian<br />
or Other Pacific White<br />
SD* American 1.8 Rican 2.2 1.9 1.9 1.7 1.8 1.6 or Alaska 1.7Native 1.7 1.5 Race 2.2 Response 1.5 One 1.6 Race 1.7 1.7<br />
Lat<strong>in</strong>o Lat<strong>in</strong>o American<br />
Islander<br />
MCAT PS Mean 9.5 7.9 9.8 9.5 9.2 8.6 11.2 9.0 9.8 10.5 11.3 11.0 10.5 11.3 10.4<br />
MCAT VR Mean 9.3 7.5 9.3 9.2 9.4 8.4 9.9 9.4 8.6 10.1 10.3 10.4 10.0 9.7 9.8<br />
SD 1.9 1.9 1.8 1.9 1.8 1.8 1.8 2.0 1.9 1.8 1.7 1.8 1.9 2.0 1.9<br />
SD* 1.8 2.2 1.9 1.9 1.7 1.8 1.6 1.7 1.7 1.5 2.2 1.5 1.6 1.7 1.7<br />
MCAT BS Mean 10.3 8.8 10.2 10.3 10.0 9.3 11.2 9.8 10.0 10.9 11.0 11.2 10.9 11.4 10.8<br />
MCAT PS Mean 9.5 7.9 9.8 9.5 9.2 8.6 11.2 9.0 9.8 10.5 11.3 11.0 10.5 11.3 10.4<br />
SD 1.6 1.8 1.7 1.6 1.6 1.5 1.5 1.5 1.9 1.5 0.0 1.5 1.6 1.7 1.6<br />
SD 1.9 1.9 1.8 1.9 1.8 1.8 1.8 2.0 1.9 1.8 1.7 1.8 1.9 2.0 1.9<br />
Total MCAT** Mean 29.0 24.2 29.3 29.0 28.7 26.3 32.3 28.2 28.5 31.5 32.5 32.7 31.3 32.4 31.1<br />
MCAT BS Mean 10.3 8.8 10.2 10.3 10.0 9.3 11.2 9.8 10.0 10.9 11.0 11.2 10.9 11.4 10.8<br />
SD 4.0 4.8 3.9 4.2 4.1 3.8 3.7 4.4 4.4 3.5 3.0 3.6 3.9 4.3 4.1<br />
SD 1.6 1.8 1.7 1.6 1.6 1.5 1.5 1.5 1.9 1.5 0.0 1.5 1.6 1.7 1.6<br />
MCAT WS Median P M P P O O Q O O Q R Q Q Q Q<br />
Total MCAT** Mean 29.0 24.2 29.3 29.0 28.7 26.3 32.3 28.2 28.5 31.5 32.5 32.7 31.3 32.4 31.1<br />
GPA Science Mean 3.46 3.43 3.55 3.48 3.43 3.30 3.64 3.44 3.59 3.65 3.74 3.67 3.56 3.71 3.61<br />
SD 4.0 4.8 3.9 4.2 4.1 3.8 3.7 4.4 4.4 3.5 3.0 3.6 3.9 4.3 4.1<br />
SD 0.37 0.38 0.34 0.36 0.36 0.42 0.29 0.40 0.28 0.28 0.03 0.27 0.33 0.26 0.32<br />
MCAT WS Median P M P P O O Q O O Q R Q Q Q Q<br />
GPA non-Science Mean 3.63 3.67 3.77 3.68 3.67 3.61 3.76 3.72 3.79 3.76 3.75 3.77 3.73 3.76 3.74<br />
GPA Science Mean 3.46 3.43 3.55 3.48 3.43 3.30 3.64 3.44 3.59 3.65 3.74 3.67 3.56 3.71 3.61<br />
SD 0.32 0.29 0.25 0.27 0.30 0.31 0.22 0.23 0.16 0.23 0.10 0.21 0.26 0.22 0.25<br />
SD 0.37 0.38 0.34 0.36 0.36 0.42 0.29 0.40 0.28 0.28 0.03 0.27 0.33 0.26 0.32<br />
GPA total Mean 3.53 3.53 3.65 3.58 3.54 3.44 3.69 3.59 3.68 3.70 3.75 3.72 3.64 3.73 3.67<br />
GPA non-Science Mean 3.63 3.67 3.77 3.68 3.67 3.61 3.76 3.72 3.79 3.76 3.75 3.77 3.73 3.76 3.74<br />
SD 0.32 0.31 0.27 0.29 0.30 0.34 0.23 0.30 0.21 0.24 0.05 0.22 0.27 0.22 0.26<br />
SD 0.32 0.29 0.25 0.27 0.30 0.31 0.22 0.23 0.16 0.23 0.10 0.21 0.26 0.22 0.25<br />
Total Matriculants 426 359 148 629 71 1,182 3,859 41 21 11,060 4 623 579 228 19,230<br />
GPA total Mean 3.53 3.53 3.65 3.58 3.54 3.44 3.69 3.59 3.68 3.70 3.75 3.72 3.64 3.73 3.67<br />
* SD = standard deviation ** The table presents the most recent MCAT scores.<br />
SD 0.32 0.31 0.27 0.29 0.30 0.34 0.23 0.30 0.21 0.24 0.05 0.22 0.27 0.22 0.26<br />
Source: <strong>AAMC</strong> website: https://www.aamc.org/data/facts/applicantmatriculant/ (table 19)<br />
Total Matriculants 426 359 148 629 71 1,182 3,859 41 21 11,060 4 623 579 228 19,230<br />
* SD = standard deviation ** The table presents the most recent MCAT scores.<br />
Source: <strong>AAMC</strong> website: https://www.aamc.org/data/facts/applicantmatriculant/ (table 19)<br />
Association of American <strong>Medical</strong> Colleges
Table 38: Level of <strong>Education</strong> Indebtedness of <strong>Medical</strong> School Graduates by Race and Ethnicity and<br />
School Type, 2011<br />
Table 38: Level of <strong>Education</strong>al Indebtedness* of <strong>Medical</strong> School Graduates by Race and Ethnicity and by School Type,<br />
2011<br />
Level of Debt<br />
Percent<br />
with Debt<br />
>=<br />
$200,000<br />
Percent<br />
with Debt<br />
between<br />
$175,000<br />
and<br />
$199,999<br />
Percent<br />
with Debt<br />
Between<br />
$150,000<br />
and<br />
$174,999<br />
Percent<br />
with Debt<br />
Between<br />
$125,000<br />
and<br />
$149,999<br />
Percent<br />
with Debt<br />
between<br />
$100,000<br />
and<br />
$124,999<br />
Percent<br />
with Debt<br />
between<br />
$75,000<br />
and<br />
$99,999<br />
Percent<br />
with Debt<br />
Between<br />
$50,000<br />
and<br />
$74,999<br />
Percent<br />
with Debt<br />
Between<br />
$25,000<br />
and<br />
$49,999<br />
Median<br />
<strong>Education</strong>al<br />
Debt of<br />
Indebted<br />
Graduates<br />
Type of Schools / Race and<br />
Ethnicity**<br />
Percent<br />
with Debt<br />
up to<br />
$24,999<br />
Percent<br />
with No<br />
Debt*<br />
Mean<br />
<strong>Education</strong>al<br />
Debt of<br />
Indebted<br />
Graduates<br />
Number of<br />
Respondents<br />
All<br />
Black or African American 766 $164,000 $161,030 21.7% 2.6% 2.1% 4.6% 5.6% 10.6% 5.4% 12.7% 8.1% 26.8%<br />
<strong>Diversity</strong> <strong>in</strong> <strong>Medical</strong> <strong>Education</strong>: <strong>Facts</strong> & <strong>Figures</strong> <strong>2012</strong><br />
Hispanic/Lat<strong>in</strong>o 931 $150,000 $146,866 25.5% 2.3% 4.9% 5.2% 5.3% 11.7% 7.5% 10.9% 6.8% 20.0%<br />
American Indian/Alaska Native 40 $150,000 $137,091 17.5% 7.5% 0.0% 15.0% 10.0% 2.5% 0.0% 15.0% 7.5% 25.0%<br />
148<br />
Asian 2,449 $140,000 $135,143 33.4% 3.5% 8.1% 4.9% 5.0% 8.4% 4.7% 10.5% 5.5% 15.9%<br />
White 8,161 $160,000 $156,967 24.2% 2.6% 4.6% 3.9% 4.4% 7.8% 6.7% 13.7% 8.7% 23.4%<br />
Other 1,114 $138,000 $140,768 31.4% 3.3% 4.3% 5.0% 6.1% 10.4% 8.5% 10.2% 4.7% 16.1%<br />
Total 13,461 $156,000 $151,600 26.4% 2.8% 5.1% 4.4% 4.8% 8.5% 6.5% 12.6% 7.6% 21.4%<br />
Public<br />
Black or African American 351 $148,000 $146,538 24.5% 2.9% 2.6% 4.8% 6.8% 14.2% 6.6% 10.5% 7.7% 19.4%<br />
Hispanic/Lat<strong>in</strong>o 507 $129,000 $130,165 24.1% 2.6% 6.1% 7.5% 7.3% 13.6% 7.8% 12.2% 5.9% 12.8%<br />
American Indian/Alaska Native 28 $150,000 $149,174 17.8% 10.7% 0.0% 3.6% 7.1% 3.6% 0.0% 17.9% 10.7% 28.6%<br />
Asian 1,285 $130,000 $125,412 34.5% 3.4% 9.2% 4.6% 5.5% 9.1% 5.8% 11.7% 5.2% 10.9%<br />
White 5,044 $150,000 $146,287 23.8% 2.4% 4.6% 4.0% 4.6% 9.0% 8.7% 17.1% 10.0% 15.9%<br />
Other 675 $133,000 $134,258 29.3% 2.7% 4.9% 4.1% 5.9% 13.4% 9.9% 12.9% 4.8% 11.9%<br />
Total 7,890 $150,000 $141,254 26.0% 2.6% 5.4% 4.4% 5.2% 9.9% 8.1% 15.2% 8.4% 14.7%<br />
Private<br />
Black or African American 415 $176,000 $172,494 19.3% 2.4% 1.6% 4.3% 4.6% 7.5% 4.3% 14.5% 8.4% 33.0%<br />
Hispanic/Lat<strong>in</strong>o 424 $174,000 $167,743 27.2% 1.9% 3.5% 2.3% 2.8% 9.5% 7.1% 9.2% 7.8% 28.6%<br />
American Indian/Alaska Native 12 $76,500 $109,300 16.7% 0.0% 0.0% 41.7% 16.7% 0.0% 0.0% 8.3% 0.0% 16.7%<br />
Asian 1,164 $150,000 $145,528 32.3% 3.7% 6.8% 5.3% 4.4% 7.6% 3.6% 9.3% 5.7% 21.2%<br />
White 3,117 $189,000 $174,527 25.0% 2.9% 4.6% 3.8% 3.9% 5.7% 3.6% 8.2% 6.6% 35.6%<br />
Other 439 $150,000 $151,627 34.7% 4.3% 3.4% 6.4% 6.4% 5.7% 6.2% 5.9% 4.3% 22.6%<br />
Total 5,571 $176,000 $166,452 27.0% 3.1% 4.6% 4.4% 4.2% 6.5% 4.1% 8.8% 6.5% 30.8%<br />
*The debt here refers to the medical school education debt.<br />
** The total number of respondents for this debt question was 13,461. "Other" <strong>in</strong>cludes unknown race/ethnicity, unduplicated multiple race, and foreign graduates.<br />
Source: <strong>AAMC</strong> <strong>Medical</strong> School Graduation Questionnaire 2011, as of 3/20/<strong>2012</strong>.<br />
Association of American <strong>Medical</strong> Colleges
<strong>Diversity</strong> <strong>in</strong> <strong>Medical</strong> <strong>Education</strong>: <strong>Facts</strong> & <strong>Figures</strong> <strong>2012</strong><br />
Table 39: U.S. <strong>Medical</strong> School Graduates Report<strong>in</strong>g Specialty by Race and Ethnicity, 2011<br />
Table 39: U.S. <strong>Medical</strong> School Graduates Report<strong>in</strong>g Specialty by Race and Ethnicity, 2011<br />
American Native Lat<strong>in</strong>o Asian White Others<br />
Specialties<br />
# % # % # % # % # % # %<br />
Allergy and Immunology 0 0.0% 0 0.0% 1 0.1% 7 0.3% 3 0.0% 2 0.2%<br />
Anesthesiology 61 8.0% 0 0.0% 53 5.7% 173 7.1% 447 5.5% 58 5.1%<br />
Colon and Rectal Surgery 1 0.1% 0 0.0% 0 0.0% 1 0.0% 2 0.0% 1 0.1%<br />
Dermatology 12 1.6% 0 0.0% 13 1.4% 42 1.7% 179 2.2% 21 1.9%<br />
Emergency Medic<strong>in</strong>e 37 4.8% 3 7.5% 59 6.3% 94 3.9% 655 8.0% 67 5.9%<br />
Family Practice 38 5.0% 6 15.0% 61 6.6% 45 1.8% 446 5.5% 47 4.2%<br />
<strong>Medical</strong> Genetics 0 0.0% 0 0.0% 0 0.0% 0 0.0% 3 0.0% 1 0.1%<br />
Internal Medic<strong>in</strong>e 74 9.7% 2 5.0% 111 11.9% 410 16.8% 884 10.8% 144 12.8%<br />
Neurological Surgery 8 1.0% 0 0.0% 13 1.4% 28 1.2% 71 0.9% 13 1.2%<br />
Neurology 14 1.8% 0 0.0% 17 1.8% 71 2.9% 170 2.1% 17 1.5%<br />
Obstetrics and Gynecology 70 9.1% 2 5.0% 57 6.1% 68 2.8% 402 4.9% 55 4.9%<br />
Ophthalmology 7 0.9% 0 0.0% 16 1.7% 85 3.5% 162 2.0% 23 2.0%<br />
Orthopedic Surgery 19 2.5% 5 12.5% 29 3.1% 56 2.3% 410 5.0% 38 3.4%<br />
Otolaryngology 2 0.3% 0 0.0% 12 1.3% 37 1.5% 137 1.7% 21 1.9%<br />
Pathology 6 0.8% 0 0.0% 12 1.3% 30 1.2% 121 1.5% 22 1.9%<br />
Pediatrics 74 9.7% 3 7.5% 76 8.2% 126 5.2% 710 8.7% 78 6.9%<br />
Physical Medic<strong>in</strong>e and Rehabilitation 6 0.8% 0 0.0% 10 1.1% 31 1.3% 63 0.8% 10 0.9%<br />
Plastic Surgery 1 0.1% 1 2.5% 14 1.5% 16 0.7% 67 0.8% 17 1.5%<br />
Preventive Medic<strong>in</strong>e 1 0.1% 0 0.0% 0 0.0% 2 0.1% 4 0.0% 0 0.0%<br />
Psychiatry 28 3.7% 0 0.0% 41 4.4% 59 2.4% 284 3.5% 38 3.4%<br />
Radiology 18 2.3% 1 2.5% 35 3.8% 159 6.5% 390 4.8% 50 4.4%<br />
Radiation Oncology 7 0.9% 0 0.0% 2 0.2% 33 1.4% 60 0.7% 12 1.1%<br />
Surgery 34 4.4% 2 5.0% 53 5.7% 101 4.1% 379 4.6% 51 4.5%<br />
Thoracic Surgery 2 0.3% 0 0.0% 4 0.4% 6 0.2% 23 0.3% 6 0.5%<br />
Urology 8 1.0% 0 0.0% 11 1.2% 28 1.2% 113 1.4% 20 1.8%<br />
Internal Medic<strong>in</strong>e/Pediatrics 10 1.3% 0 0.0% 8 0.9% 16 0.7% 105 1.3% 6 0.5%<br />
Other 5 0.7% 2 5.0% 7 0.8% 32 1.3% 93 1.1% 36 3.2%<br />
Unknown 223 29.1% 13 32.5% 216 23.2% 678 27.9% 1778 21.8% 275 24.4%<br />
Total 766 100.0% 40 100.0% 931 100.0% 2,434 100.0% 8,161 100.0% 1,129 100.0%<br />
Others <strong>in</strong>cludes Unknown race and ethnicity, unduplicated multiple race, and foreign graduates.<br />
Source:<strong>AAMC</strong> Data Warehouse: Graduation Questionnaire 2011 data, as of March 12, <strong>2012</strong><br />
149<br />
Black or<br />
African<br />
American<br />
Indian or<br />
Alaskan<br />
Hispanic or<br />
Association of American <strong>Medical</strong> Colleges
<strong>Diversity</strong> <strong>in</strong> <strong>Medical</strong> <strong>Education</strong>: <strong>Facts</strong> & <strong>Figures</strong> <strong>2012</strong><br />
Table 40: U.S. <strong>Medical</strong> School Faculty by Gender and Race and Ethnicity, 2007–2011<br />
Table 40: U.S. <strong>Medical</strong> School Faculty by Gender and Race and Ethnicity, 2007-2011<br />
Gender<br />
2007 2008<br />
2009 2010<br />
2011<br />
Race Number Percentage Number Percentage Number Percentage Number Percentage Number Percentage<br />
All<br />
Men<br />
Asian 16,560 12.9% 16,668 12.8% 16,950 12.7% 17,141 12.5% 17,131 12.5%<br />
Black 3,748 2.9% 3,839 2.9% 3,897 2.9% 3,938 2.9% 3,945 2.9%<br />
Native American/Alaskan 146 0.1% 158 0.1% 170 0.1% 193 0.1% 189 0.1%<br />
Native Hawaiian/OPI 218 0.2% 199 0.2% 184 0.1% 175 0.1% 177 0.1%<br />
White 85,614 66.9% 84,849 65.1% 84,888 63.4% 84,893 61.8% 84,042 61.2%<br />
Other 451 0.4% 444 0.3% 448 0.3% 408 0.3% 403 0.3%<br />
Unknown 12,989 10.1% 15,893 12.2% 19,107 14.3% 22,473 16.4% 23,390 17.0%<br />
Multiple Race 2,910 2.3% 2,815 2.2% 2,725 2.0% 2,656 1.9% 2,614 1.9%<br />
Cuban 66 0.1% 71 0.1% 71 0.1% 68 0.0% 69 0.1%<br />
Mexican American 629 0.5% 626 0.5% 659 0.5% 681 0.5% 678 0.5%<br />
Puerto Rican 928 0.7% 940 0.7% 951 0.7% 995 0.7% 999 0.7%<br />
Other Hispanic 3,504 2.7% 3,526 2.7% 3,505 2.6% 3,487 2.5% 3,474 2.5%<br />
Multiple Hispanic 234 0.2% 243 0.2% 238 0.2% 246 0.2% 246 0.2%<br />
Total 127,997 100.0% 130,271 100.0% 133,793 100.0% 137,354 100.0% 137,357 100.0%<br />
Asian 10,652 12.7% 10,624 12.6% 10,779 12.5% 10,854 12.3% 10,822 12.3%<br />
Black 1,879 2.2% 1,889 2.2% 1,911 2.2% 1,917 2.2% 1,929 2.2%<br />
Native American/Alaskan 90 0.1% 104 0.1% 109 0.1% 120 0.1% 117 0.1%<br />
Native Hawaiian/OPI 147 0.2% 138 0.2% 127 0.1% 116 0.1% 114 0.1%<br />
White 58,164 69.4% 57,436 67.9% 57,281 66.4% 57,105 65.0% 56,451 64.4%<br />
Other 276 0.3% 273 0.3% 270 0.3% 252 0.3% 247 0.3%<br />
Unknown 7,403 8.8% 8,912 10.5% 10,620 12.3% 12,374 14.1% 12,859 14.7%<br />
Multiple Race 1,879 2.2% 1,824 2.2% 1,763 2.0% 1,709 1.9% 1,680 1.9%<br />
Cuban 42 0.1% 44 0.1% 43 0.0% 40 0.0% 40 0.0%<br />
Mexican American 394 0.5% 399 0.5% 410 0.5% 418 0.5% 415 0.5%<br />
Puerto Rican 518 0.6% 527 0.6% 545 0.6% 574 0.7% 574 0.7%<br />
Other Hispanic 2,285 2.7% 2,290 2.7% 2,277 2.6% 2,266 2.6% 2,260 2.6%<br />
Multiple Hispanic 133 0.2% 138 0.2% 137 0.2% 142 0.2% 143 0.2%<br />
Total 83,862 100.0% 84,598 100.0% 86,272 100.0% 87,887 100.0% 87,651 100.0%<br />
Women<br />
Asian 5,908 13.4% 6,044 13.2% 6,171 13.0% 6,287 12.7% 6,309 12.7%<br />
Black 1,869 4.2% 1,950 4.3% 1,986 4.2% 2,021 4.1% 2,016 4.1%<br />
Native American/Alaskan 56 0.1% 54 0.1% 61 0.1% 73 0.1% 72 0.1%<br />
Native Hawaiian/OPI 71 0.2% 61 0.1% 57 0.1% 59 0.1% 63 0.1%<br />
White 27,450 62.2% 27,413 60.0% 27,607 58.1% 27,788 56.2% 27,591 55.5%<br />
Other 175 0.4% 171 0.4% 178 0.4% 156 0.3% 156 0.3%<br />
Unknown 5,586 12.7% 6,981 15.3% 8,487 17.9% 10,099 20.4% 10,531 21.2%<br />
Multiple Race 1,031 2.3% 991 2.2% 962 2.0% 947 1.9% 934 1.9%<br />
Cuban 24 0.1% 27 0.1% 28 0.1% 28 0.1% 29 0.1%<br />
Mexican American 235 0.5% 227 0.5% 249 0.5% 263 0.5% 263 0.5%<br />
Puerto Rican 410 0.9% 413 0.9% 406 0.9% 421 0.9% 425 0.9%<br />
Other Hispanic 1,219 2.8% 1,236 2.7% 1,228 2.6% 1,221 2.5% 1,214 2.4%<br />
Multiple Hispanic 101 0.2% 105 0.2% 101 0.2% 104 0.2% 103 0.2%<br />
Total 44,135 100.0% 45,673 100.0% 47,521 100.0% 49,467 100.0% 49,706 100.0%<br />
Note: Miss<strong>in</strong>g gender were excluded: year 2007 = 79; year 2008 = 127; year 2009 = 165; year 2010 = 247; year 2011 = 289.<br />
Source: <strong>AAMC</strong> Faculty Roster, as of March 21, <strong>2012</strong>.<br />
150<br />
Association of American <strong>Medical</strong> Colleges
<strong>Diversity</strong> <strong>in</strong> <strong>Medical</strong> <strong>Education</strong>: <strong>Facts</strong> & <strong>Figures</strong> <strong>2012</strong><br />
Table 41: U.S. <strong>Medical</strong> School Faculty by Gender, Race and Ethnicity, and Rank, 2011<br />
All<br />
Associate Assistant<br />
Professor Professor Professor Instructor Other<br />
Total<br />
Race/Ethnicity # % # % # % # % # % # %<br />
Asian 2,725 8.4% 3,530 12.4% 8,929 15.1% 1,633 11.4% 357 10.9% 17,174 12.5%<br />
Black 447 1.4% 738 2.6% 2,275 3.8% 436 3.1% 56 1.7% 3,952 2.9%<br />
Native American/Alaskan 13 0.0% 27 0.1% 117 0.2% 29 0.2% 4 0.1% 190 0.1%<br />
Native Hawaiian/OPI 9 0.0% 20 0.1% 128 0.2% 17 0.1% 2 0.1% 176 0.1%<br />
White 26,112 80.3% 19,922 69.8% 31,042 52.4% 5,891 41.3% 1,228 37.5% 84,195 61.1%<br />
Other 45 0.1% 87 0.3% 235 0.4% 24 0.2% 13 0.4% 404 0.3%<br />
Unknown 1,671 5.1% 2,379 8.3% 12,422 21.0% 5,659 39.6% 1,469 44.9% 23,600 17.1%<br />
Multiple Race 420 1.3% 664 2.3% 1,330 2.2% 157 1.1% 47 1.4% 2,618 1.9%<br />
Cuban 12 0.0% 18 0.1% 33 0.1% 2 0.0% 4 0.1% 69 0.1%<br />
Mexican American 99 0.3% 141 0.5% 359 0.6% 66 0.5% 24 0.7% 689 0.5%<br />
Puerto Rican 187 0.6% 209 0.7% 501 0.8% 92 0.6% 14 0.4% 1,003 0.7%<br />
Other Hispanic 733 2.3% 755 2.6% 1,701 2.9% 237 1.7% 54 1.7% 3,480 2.5%<br />
Multiple Hispanic 29 0.1% 59 0.2% 126 0.2% 34 0.2% 0 0.0% 248 0.2%<br />
Total 32,502 100.0% 28,549 100.0% 59,198 100.0% 14,277 100.0% 3,272 100.0% 137,798 100.0%<br />
Associate Assistant<br />
Men<br />
Professor Professor Professor Instructor Other<br />
Total<br />
Race/Ethnicity # % # % # % # % # % # %<br />
Asian 2,129 8.1% 2,430 12.5% 5,223 15.3% 865 13.0% 206 12.7% 10,853 12.3%<br />
Black 328 1.3% 424 2.2% 995 2.9% 155 2.3% 29 1.8% 1,931 2.2%<br />
Native American/Alaskan 9 0.0% 17 0.1% 72 0.2% 16 0.2% 3 0.2% 117 0.1%<br />
Native Hawaiian/OPI 7 0.0% 18 0.1% 74 0.2% 12 0.2% 2 0.1% 113 0.1%<br />
White 21,128 80.8% 13,608 70.2% 18,421 53.9% 2,788 42.0% 602 37.2% 56,547 64.3%<br />
Other 39 0.1% 62 0.3% 129 0.4% 8 0.1% 10 0.6% 248 0.3%<br />
Unknown 1,325 5.1% 1,585 8.2% 6,914 20.2% 2,473 37.2% 690 42.6% 12,987 14.8%<br />
Multiple Race 346 1.3% 448 2.3% 776 2.3% 85 1.3% 28 1.7% 1,683 1.9%<br />
Cuban 10 0.0% 10 0.1% 16 0.0% 2 0.0% 2 0.1% 40 0.0%<br />
Mexican American 84 0.3% 89 0.5% 198 0.6% 41 0.6% 10 0.6% 422 0.5%<br />
Puerto Rican 118 0.5% 128 0.7% 269 0.8% 56 0.8% 4 0.2% 575 0.7%<br />
Other Hispanic 588 2.3% 516 2.7% 1,003 2.9% 126 1.9% 32 2.0% 2,265 2.6%<br />
Multiple Hispanic 22 0.1% 39 0.2% 66 0.2% 18 0.3% 0 0.0% 145 0.2%<br />
Total Male 26,133 100.0% 19,374 100.0% 34,156 100.0% 6,645 100.0% 1,618 100.0% 87,926 100.0%<br />
Associate Assistant<br />
Women<br />
Professor Professor Professor Instructor Other<br />
Total<br />
Race/Ethnicity # % # % # % # % # % # %<br />
Asian 596 9.4% 1,100 12.0% 3,706 14.8% 768 10.1% 151 9.1% 6,321 12.7%<br />
Black 119 1.9% 314 3.4% 1,280 5.1% 281 3.7% 27 1.6% 2,021 4.1%<br />
Native American/Alaskan 4 0.1% 10 0.1% 45 0.2% 13 0.2% 1 0.1% 73 0.1%<br />
Native Hawaiian/OPI 2 0.0% 2 0.0% 54 0.2% 5 0.1% 0 0.0% 63 0.1%<br />
White 4,984 78.3% 6,314 68.8% 12,621 50.4% 3,103 40.7% 626 37.8% 27,648 55.4%<br />
Other 6 0.1% 25 0.3% 106 0.4% 16 0.2% 3 0.2% 156 0.3%<br />
Unknown 346 5.4% 794 8.7% 5,508 22.0% 3,186 41.7% 779 47.1% 10,613 21.3%<br />
Multiple Race 74 1.2% 216 2.4% 554 2.2% 72 0.9% 19 1.1% 935 1.9%<br />
Cuban 2 0.0% 8 0.1% 17 0.1% 0 0.0% 2 0.1% 29 0.1%<br />
Mexican American 15 0.2% 52 0.6% 161 0.6% 25 0.3% 14 0.8% 267 0.5%<br />
Puerto Rican 69 1.1% 81 0.9% 232 0.9% 36 0.5% 10 0.6% 428 0.9%<br />
Other Hispanic 145 2.3% 239 2.6% 698 2.8% 111 1.5% 22 1.3% 1,215 2.4%<br />
Multiple Hispanic 7 0.1% 20 0.2% 60 0.2% 16 0.2% 0 0.0% 103 0.2%<br />
Total Female 6,369 100.0% 9,175 100.0% 25,042 100.0% 7,632 100.0% 1,654 100.0% 49,872 100.0%<br />
Note: This table excludes 127 faculty with miss<strong>in</strong>g gender data.<br />
Source: <strong>AAMC</strong> Faculty Roster, as of 3/23/<strong>2012</strong>.<br />
Table 41: U.S. <strong>Medical</strong> School Faculty by Gender, Race and Ethnicity, and Rank, 2011<br />
151<br />
Association of American <strong>Medical</strong> Colleges
<strong>Diversity</strong> <strong>in</strong> <strong>Medical</strong> <strong>Education</strong>: <strong>Facts</strong> & <strong>Figures</strong> <strong>2012</strong><br />
Table 42: U.S. <strong>Medical</strong> School Faculty by Gender, Race and Ethnicity, and Degree, 2011<br />
Table 42: U.S. <strong>Medical</strong> School Faculty by Gender, Race and Ethnicity, and Degree, 2011<br />
MD/PhD or Masters or<br />
All<br />
MD only PhD or OHD MD/OHD Other Unknown Total<br />
Race/Hispanic Orig<strong>in</strong> # % # % # % # % # % # %<br />
Asian 4,539 14.7% 3,852 11.7% 1,895 18.6% 123 3.0% 111 6.0% 17,174 12.5%<br />
Black 1,685 5.4% 410 1.2% 186 1.8% 85 2.1% 17 0.9% 3,952 2.9%<br />
Native American/Alaskan 52 0.2% 33 0.1% 7 0.1% 7 0.2% 2 0.1% 190 0.1%<br />
Native Hawaiian/OPI 34 0.1% 60 0.2% 25 0.2% 3 0.1% 3 0.2% 176 0.1%<br />
White 18,165 58.7% 18,323 55.6% 6,273 61.7% 1,915 46.4% 382 20.8% 84,195 61.1%<br />
Other 93 0.3% 108 0.3% 19 0.2% 12 0.3% 5 0.3% 404 0.3%<br />
Unknown 4,016 13.0% 9,192 27.9% 1,165 11.5% 1,873 45.3% 1,286 70.1% 23,600 17.1%<br />
Multiple Race 748 2.4% 305 0.9% 264 2.6% 12 0.3% 3 0.2% 2,618 1.9%<br />
Cuban 21 0.1% 14 0.0% 0 0.0% 3 0.1% 0 0.0% 69 0.1%<br />
Mexican American 214 0.7% 78 0.2% 37 0.4% 21 0.5% 4 0.2% 689 0.5%<br />
Puerto Rican 364 1.2% 86 0.3% 16 0.2% 23 0.6% 8 0.4% 1,003 0.7%<br />
Other Hispanic 907 2.9% 512 1.6% 272 2.7% 54 1.3% 14 0.8% 3,480 2.5%<br />
Multiple Hispanic 97 0.3% 5 0.0% 14 0.1% 0 0.0% 0 0.0% 248 0.2%<br />
Total 30,935 100.0% 32,978 100.0% 10,173 100.0% 4,131 100.0% 1,835 100.0% 137,798 100.0%<br />
MD/PhD or Masters or<br />
Men<br />
MD only PhD or OHD MD/OHD Other Unknown Total<br />
Race/Hispanic Orig<strong>in</strong> # % # % # % # % # % # %<br />
Asian 6,654 11.5% 2,685 13.2% 1,396 18.0% 51 4.5% 67 7.3% 10,853 12.3%<br />
Black 1,569 2.7% 206 1.0% 125 1.6% 22 1.9% 9 1.0% 1,931 2.2%<br />
Native American/Alaskan 89 0.2% 20 0.1% 4 0.1% 2 0.2% 2 0.2% 117 0.1%<br />
Native Hawaiian/OPI 51 0.1% 39 0.2% 20 0.3% 2 0.2% 1 0.1% 113 0.1%<br />
White 39,137 67.8% 11,691 57.4% 4,960 64.0% 577 50.7% 182 19.8% 56,547 64.3%<br />
Other 167 0.3% 59 0.3% 16 0.2% 4 0.4% 2 0.2% 248 0.3%<br />
Unknown 6,068 10.5% 5,049 24.8% 787 10.2% 445 39.1% 638 69.5% 12,987 14.8%<br />
Multiple Race 1,286 2.2% 212 1.0% 182 2.3% 3 0.3% 0 0.0% 1,683 1.9%<br />
Cuban 31 0.1% 8 0.0% 0 0.0% 1 0.1% 0 0.0% 40 0.0%<br />
Mexican American 335 0.6% 45 0.2% 32 0.4% 8 0.7% 2 0.2% 422 0.5%<br />
Puerto Rican 506 0.9% 44 0.2% 12 0.2% 9 0.8% 4 0.4% 575 0.7%<br />
Other Hispanic 1,721 3.0% 309 1.5% 209 2.7% 15 1.3% 11 1.2% 2,265 2.6%<br />
Multiple Hispanic 132 0.2% 3 0.0% 10 0.1% 0 0.0% 0 0.0% 145 0.2%<br />
Total 57,746 100.0% 20,370 100.0% 7,753 100.0% 1,139 100.0% 918 100.0% 87,926 100.0%<br />
MD/PhD or Masters or<br />
Women<br />
MD only PhD or OHD MD/OHD Other Unknown Total<br />
Race/Hispanic Orig<strong>in</strong> # % # % # % # % # % # %<br />
Asian 4,539 14.7% 1,167 9.3% 499 20.6% 72 2.4% 44 4.8% 6,321 12.7%<br />
Black 1,685 5.4% 204 1.6% 61 2.5% 63 2.1% 8 0.9% 2,021 4.1%<br />
Native American/Alaskan 52 0.2% 13 0.1% 3 0.1% 5 0.2% 0 0.0% 73 0.1%<br />
Native Hawaiian/OPI 34 0.1% 21 0.2% 5 0.2% 1 0.0% 2 0.2% 63 0.1%<br />
White 18,165 58.7% 6,632 52.6% 1,313 54.3% 1,338 44.7% 200 21.8% 27,648 55.4%<br />
Other 93 0.3% 49 0.4% 3 0.1% 8 0.3% 3 0.3% 156 0.3%<br />
Unknown 4,016 13.0% 4,143 32.9% 378 15.6% 1,428 47.7% 648 70.7% 10,613 21.3%<br />
Multiple Race 748 2.4% 93 0.7% 82 3.4% 9 0.3% 3 0.3% 935 1.9%<br />
Cuban 21 0.1% 6 0.0% 0 0.0% 2 0.1% 0 0.0% 29 0.1%<br />
Mexican American 214 0.7% 33 0.3% 5 0.2% 13 0.4% 2 0.2% 267 0.5%<br />
Puerto Rican 364 1.2% 42 0.3% 4 0.2% 14 0.5% 4 0.4% 428 0.9%<br />
Other Hispanic 907 2.9% 203 1.6% 63 2.6% 39 1.3% 3 0.3% 1,215 2.4%<br />
Multiple Hispanic 97 0.3% 2 0.0% 4 0.2% 0 0.0% 0 0.0% 103 0.2%<br />
Total 30,935 100.0% 12,608 100.0% 2,420 100.0% 2,992 100.0% 917 100.0% 49,872 100.0%<br />
Note: This table excludes 127 faculty with miss<strong>in</strong>g gender data.<br />
Source: <strong>AAMC</strong> Faculty Roster, as of 3/23/<strong>2012</strong>.<br />
152<br />
Association of American <strong>Medical</strong> Colleges
Table 43: U.S. <strong>Medical</strong> School Faculty by Gender, Race and Ethnicity, and Department, 2011<br />
Table 43: U.S. <strong>Medical</strong> School Faculty by Gender, Race and Ethnicity, and Departments, 2011<br />
Black or American<br />
African Indian or Native<br />
Mexican<br />
Multiple<br />
Department<br />
Asian American Alaska Native Hawaiian / OPI White Other Race Unknown Race Multiple Races Cuban American Puerto Rican Other Hispanic Hispanic<br />
Men Women Men Women Men Women Men Women Men Women Men Women Men Women Men Women Men Women Men Women Men Women Men Women Men Women Total<br />
Basic Sciences<br />
Anatomy 143 54 12 4 1 0 0 0 794 308 2 0 212 143 14 4 0 0 5 2 6 4 26 10 0 0 1,744<br />
Biochemistry 277 119 15 11 0 3 1 0 1,180 393 4 2 434 194 21 1 1 0 1 2 7 5 38 8 0 0 2,717<br />
Microbiology 194 67 20 9 1 0 1 0 845 362 3 0 302 178 17 6 1 2 2 0 9 8 31 17 0 0 2,075<br />
Pathology (Basic) 159 100 9 26 3 0 4 5 693 380 5 3 207 197 20 6 1 1 3 2 4 6 31 17 1 1 1,884<br />
Pharmacology 216 77 14 6 3 0 4 2 850 273 2 2 283 172 18 3 1 0 5 2 4 4 27 15 1 0 1,984<br />
Physiology 146 58 20 10 1 1 4 2 850 255 3 1 268 134 5 1 2 0 7 2 6 3 27 9 0 0 1,815<br />
Other Basic Sciences 416 217 32 18 3 0 7 2 1,846 896 12 7 877 598 32 12 3 1 5 5 4 6 62 35 0 0 5,096<br />
Subtotal 1,551 692 122 84 12 4 21 11 7,058 2,867 31 15 2,583 1,616 127 33 9 4 28 15 40 36 242 111 2 1 17,315<br />
<strong>Diversity</strong> <strong>in</strong> <strong>Medical</strong> <strong>Education</strong>: <strong>Facts</strong> & <strong>Figures</strong> <strong>2012</strong><br />
153<br />
Cl<strong>in</strong>ical Sciences<br />
Anesthesiology 601 346 112 117 6 2 9 0 2,910 1,239 16 6 591 448 107 55 3 3 19 10 24 17 119 52 10 5 6,827<br />
Dermatology 80 83 9 16 1 0 0 0 338 272 0 0 82 81 9 10 1 0 5 6 5 5 11 4 2 2 1,022<br />
Emergency Medic<strong>in</strong>e 186 90 82 71 2 4 0 0 1,604 584 1 1 255 166 43 14 0 0 14 6 24 18 34 21 4 0 3,224<br />
Family Medic<strong>in</strong>e 141 159 81 150 4 5 0 2 1,789 1,158 4 7 310 457 31 31 0 0 31 28 33 32 62 49 6 4 4,574<br />
Internal Medic<strong>in</strong>e 3,040 1,837 493 469 21 20 29 14 13,433 6,186 65 40 3,252 2,301 473 268 12 6 110 53 162 94 603 310 43 29 33,363<br />
Neurology 357 217 27 24 2 1 2 1 1,901 847 4 4 456 337 66 32 1 0 15 8 5 1 82 38 5 2 4,435<br />
Obstetrics & Gynecolog 182 257 125 216 2 9 3 1,547 1,537 6 2 256 380 43 53 1 0 14 18 44 30 70 66 7 4 4,878<br />
Ophthalmology 250 187 21 28 1 0 0 1 1,116 407 4 2 241 166 42 10 2 0 6 3 4 3 29 18 5 2 2,548<br />
Orthopedic Surgery 221 37 65 11 2 2 3 0 1,709 276 6 0 249 89 42 11 2 1 12 1 11 1 40 4 0 2 2,797<br />
Otolaryngology 149 45 21 15 3 0 1 0 841 249 0 3 121 130 26 14 0 0 2 1 5 1 34 8 1 0 1,670<br />
Pathology (Cl<strong>in</strong>ical) 365 232 31 23 1 2 2 2 1,524 802 7 3 320 251 50 43 1 1 8 6 8 8 67 41 2 4 3,804<br />
Pediatrics 973 963 190 381 15 11 6 13 5,714 5,089 32 39 925 1,519 169 191 4 5 44 58 54 100 270 235 16 21 17,037<br />
Physical Medic<strong>in</strong>e 68 77 20 22 0 0 1 3 448 318 3 2 121 118 21 8 0 0 3 1 11 8 11 12 1 1 1,278<br />
Psychiatry 404 293 93 150 10 8 4 0 3,569 2,381 21 16 816 1,163 67 51 1 4 27 21 26 32 145 104 9 10 9,425<br />
Public Health 34 52 21 47 0 1 1 1 272 248 1 0 137 162 4 4 0 1 1 2 0 0 17 12 1 2 1,021<br />
Radiology 980 367 93 79 9 3 11 3 3,650 1,233 17 6 948 431 107 48 1 2 21 10 29 25 129 63 14 5 8,284<br />
Surgery 1,118 307 288 89 22 3 12 4 6,372 1,365 27 7 1,087 468 238 49 1 2 59 16 86 13 266 48 17 9 11,973<br />
Other Cl<strong>in</strong>ical Sciences 103 47 22 8 3 0 1 1 403 223 0 0 93 88 14 4 1 0 3 3 2 1 19 10 0 0 1,049<br />
Subtotal 9,252 5,596 1,794 1,916 104 68 91 48 49,140 24,414 214 138 10,260 8,755 1,552 896 31 25 394 251 533 389 2,008 1,095 143 102 119,209<br />
Other<br />
Dentistry 1 1 2 1 0 0 0 0 20 2 0 0 15 5 0 0 0 0 0 0 0 0 1 1 0 0 49<br />
Other Health Profession 5 4 1 1 0 0 0 3 126 156 1 3 45 111 0 2 0 0 0 1 2 3 5 4 0 0 473<br />
Social Sciences 0 0 0 0 0 0 1 0 7 12 0 0 9 12 0 0 0 0 0 0 0 0 0 1 0 0 42<br />
Veter<strong>in</strong>ary Sciences 1 0 0 2 0 0 0 0 12 8 0 0 3 3 0 0 0 0 0 0 0 0 0 0 0 0 29<br />
All Others 43 28 12 17 1 1 0 1 184 189 2 0 72 111 4 4 0 0 0 0 0 0 9 3 0 0 681<br />
Subtotal 50 33 15 21 1 1 1 4 349 367 3 3 144 242 4 6 0 0 0 1 2 3 15 9 0 0 1,274<br />
Total 10,853 6,321 1,931 2,021 117 73 113 63 56,547 27,648 248 156 12,987 10,613 1,683 935 40 29 422 267 575 428 2,265 1,215 145 103 137,798<br />
Note: This table excludes 127 faculty with miss<strong>in</strong>g gender data.<br />
Source: <strong>AAMC</strong> Faculty Roster System, as of 3/23/<strong>2012</strong>.<br />
Association of American <strong>Medical</strong> Colleges
<strong>Diversity</strong> <strong>in</strong> <strong>Medical</strong> <strong>Education</strong>: <strong>Facts</strong> & <strong>Figures</strong> <strong>2012</strong><br />
Table 44: Total Fall Enrollment <strong>in</strong> Degree-Grant<strong>in</strong>g Institutions by Race and Ethnicity of Student and<br />
Type and Control of Institution: Selected Years, 1980–2009<br />
Table 44: Total Fall Enrollment <strong>in</strong> Degree-Grant<strong>in</strong>g Institutions by Race and Ethnicity of<br />
Student and Type and Control of Institution: Selected Years, 1980-2009<br />
Race/ethnicity of student and type and control of<br />
<strong>in</strong>stitution<br />
1980 1990 2000 2003 2004 2005 2006 2007 2008 2009<br />
All students, total 12,086.8 13,818.6 15,312.3 16,911.5 17,272.0 17,487.5 17,758.9 18,248.1 19,102.8 20,427.7<br />
White 9,833.0 10,722.5 10,462.1 11,280.9 11,422.8 11,495.4 11,572.4 11,756.2 12,088.8 12,730.8<br />
Total M<strong>in</strong>orities 1,948.8 2,704.7 4,321.5 5,032.9 5,259.1 5,407.2 5,590.6 5,867.4 6,353.5 7,012.1<br />
Black 1,106.8 1,247.0 1,730.3 2,068.4 2,164.7 2,214.6 2,279.6 2,383.4 2,584.5 2,919.8<br />
Hispanic 471.7 782.4 1,461.8 1,716.3 1,809.6 1,882.0 1,964.3 2,076.2 2,272.9 2,546.7<br />
Asian/Pacific Islander 286.4 572.4 978.2 1,075.6 1,108.7 1,134.4 1,165.5 1,217.9 1,302.8 1,337.7<br />
American Indian/Alaska Native 83.9 102.8 151.2 172.6 176.1 176.3 181.1 190.0 193.3 207.9<br />
Nonresident alien 305.0 391.5 528.7 597.7 590.2 584.8 595.9 624.5 660.6 684.8<br />
Public 9,456.4 10,844.7 11,752.8 12,858.7 12,980.1 13,021.8 13,180.1 13,490.8 13,972.2 14,810.6<br />
White 7,656.1 8,385.4 7,963.4 8,534.0 8,546.3 8,518.2 8,540.5 8,640.3 8,817.7 9,234.6<br />
Total M<strong>in</strong>orities 1,596.2 2,199.2 3,446.3 3,936.7 4,062.4 4,130.8 4,256.6 4,448.8 4,727.5 5,135.2<br />
Black 876.1 976.4 1,319.2 1,532.7 1,574.6 1,580.4 1,612.6 1,667.6 1,759.2 1,937.2<br />
Hispanic 406.2 671.4 1,229.3 1,414.8 1,477.4 1,525.6 1,594.3 1,685.4 1,832.4 2,017.7<br />
Asian/Pacific Islander 239.7 461.0 770.5 845.0 866.1 881.9 903.8 942.5 982.9 1,018.5<br />
American Indian/Alaska Native 74.2 90.4 127.3 144.3 144.4 143.0 145.9 153.3 153.0 161.8<br />
Nonresident alien 204.2 260.0 343.1 387.9 371.4 372.8 383.1 401.7 427.0 440.8<br />
Private 2,630.4 2,973.9 3,559.5 4,052.8 4,291.9 4,465.6 4,578.7 4,757.3 5,130.7 5,617.1<br />
White 2,176.9 2,337.0 2,498.7 2,746.9 2,876.5 2,977.3 3,032.0 3,116.0 3,271.1 3,496.2<br />
Total M<strong>in</strong>orities 352.7 505.5 875.2 1,096.2 1,196.7 1,276.4 1,333.9 1,418.6 1,625.9 1,876.9<br />
Black 230.7 270.6 411.1 535.7 590.1 634.2 667.0 715.7 825.3 982.7<br />
Hispanic 65.6 111.0 232.5 301.5 332.2 356.4 370.1 390.7 440.5 529.0<br />
Asian/Pacific Islander 46.7 111.5 207.7 230.6 242.6 252.4 261.7 275.4 319.9 319.1<br />
American Indian/Alaska Native 9.7 12.4 23.9 28.4 31.8 33.3 35.2 36.7 40.3 46.1<br />
Nonresident alien 100.8 131.4 185.6 209.7 218.8 212.0 212.8 222.8 233.6 244.0<br />
4-year, total 7,565.4 8,578.6 9,363.9 10,417.2 10,726.2 10,999.4 11,240.3 11,630.2 12,131.4 12,906.3<br />
White 6,274.5 6,768.1 6,658.0 7,202.8 7,359.0 7,496.9 7,603.4 7,781.0 7,987.1 8,357.4<br />
Total M<strong>in</strong>orities 1,049.9 1,486.1 2,266.1 2,713.0 2,868.0 3,009.5 3,134.4 3,320.5 3,588.4 3,964.4<br />
Black 634.3 722.8 995.4 1,188.5 1,258.9 1,313.4 1,361.7 1,441.7 1,565.0 1,767.0<br />
Hispanic 216.6 358.2 617.9 783.7 837.2 900.5 950.0 1,008.7 1,092.2 1,237.7<br />
Asian/Pacific Islander 162.1 357.2 576.3 650.3 678.0 700.0 722.7 761.5 823.4 842.0<br />
American Indian/Alaska Native 36.9 47.9 76.5 90.4 93.9 95.6 100.0 108.6 107.8 117.7<br />
Nonresident alien 240.9 324.3 439.7 501.5 499.2 493.1 502.5 528.7 555.9 584.6<br />
Public 5,127.6 5,848.2 6,055.4 6,649.4 6,736.5 6,837.6 6,955.0 7,166.7 7,331.8 7,709.2<br />
White 4,243.0 4,605.6 4,311.2 4,611.0 4,642.9 4,678.1 4,720.8 4,813.6 4,879.2 5,057.8<br />
Total M<strong>in</strong>orities 740.8 1,046.2 1,486.4 1,744.7 1,811.5 1,876.9 1,942.8 2,045.3 2,128.2 2,307.6<br />
Black 438.2 495.1 627.8 717.9 741.2 754.0 770.1 801.7 827.3 896.7<br />
Hispanic 156.4 262.5 420.0 528.4 555.8 595.6 629.8 668.6 709.9 794.1<br />
Asian/Pacific Islander 117.2 250.6 381.3 432.0 447.4 460.1 473.2 498.5 518.3 540.1<br />
American Indian/Alaska Native 29.0 38.0 57.2 66.4 67.0 67.2 69.7 76.5 72.6 76.7<br />
Nonresident alien 143.8 196.4 257.8 293.8 282.2 282.6 291.4 307.8 324.4 343.7<br />
Private 2,437.8 2,730.3 3,308.5 3,767.8 3,989.6 4,161.8 4,285.3 4,463.5 4,799.6 5,197.1<br />
White 2,031.5 2,162.5 2,346.9 2,591.8 2,716.1 2,818.8 2,882.6 2,967.5 3,107.9 3,299.5<br />
Total M<strong>in</strong>orities 309.2 439.8 779.7 968.3 1,056.5 1,132.5 1,191.6 1,275.3 1,460.2 1,656.7<br />
Black 196.1 227.7 367.6 470.7 517.7 559.4 591.6 640.0 737.6 870.3<br />
Hispanic 60.2 95.7 197.9 255.3 281.3 304.9 320.2 340.1 382.3 443.6<br />
Asian/Pacific Islander 44.9 106.6 195.0 218.3 230.6 239.8 249.5 263.1 305.1 301.8<br />
American Indian/Alaska Native 7.9 9.9 19.3 23.9 26.9 28.4 30.3 32.1 35.2 41.0<br />
Nonresident alien 97.1 127.9 181.9 207.7 217.0 210.4 211.1 220.8 231.5 240.8<br />
2-year, total 4,521.4 5,240.1 5,948.4 6,494.2 6,545.9 6,488.1 6,518.5 6,617.9 6,971.4 7,521.4<br />
White 3,558.5 3,954.3 3,804.1 4,078.1 4,063.8 3,998.6 3,969.1 3,975.2 4,101.6 4,373.4<br />
Total M<strong>in</strong>orities 898.9 1,218.6 2,055.4 2,319.9 2,391.2 2,397.7 2,456.1 2,546.9 2,765.0 3,047.8<br />
Black 472.5 524.3 734.9 879.8 905.8 901.1 917.9 941.7 1,019.5 1,152.8<br />
Hispanic 255.1 424.2 843.9 932.5 972.4 981.5 1,014.3 1,067.4 1,180.7 1,309.0<br />
Asian/Pacific Islander 124.3 215.2 401.9 425.3 430.7 434.4 442.8 456.4 479.4 495.7<br />
American Indian/Alaska Native 47.0 54.9 74.7 82.3 82.2 80.7 81.1 81.4 85.5 90.3<br />
Nonresident alien 64.1 67.1 89.0 96.2 90.9 91.8 93.4 95.8 104.7 100.2<br />
Public 4,328.8 4,996.5 5,697.4 6,209.3 6,243.6 6,184.2 6,225.1 6,324.1 6,640.3 7,101.4<br />
White 3,413.1 3,779.8 3,652.2 3,923.1 3,903.4 3,840.1 3,819.7 3,826.7 3,938.5 4,176.8<br />
Total M<strong>in</strong>orities 855.4 1,153.0 1,959.9 2,192.0 2,251.0 2,253.9 2,313.8 2,403.6 2,599.3 2,827.6<br />
Black 437.9 481.4 691.4 814.8 833.4 826.3 842.5 865.9 931.9 1,040.4<br />
Hispanic 249.8 408.9 809.2 886.4 921.6 930.0 964.4 1,016.8 1,122.5 1,223.6<br />
Asian/Pacific Islander 122.5 210.3 389.2 413.0 418.6 421.8 430.6 444.1 464.5 478.4<br />
American Indian/Alaska Native 45.2 52.4 70.1 77.8 77.4 75.7 76.2 76.8 80.4 85.1<br />
Nonresident alien 60.3 63.6 85.2 94.1 89.2 90.2 91.6 93.9 102.6 97.1<br />
Private 192.6 243.6 251.0 285.0 302.3 303.8 293.4 293.8 331.0 420.0<br />
White 145.4 174.5 151.8 155.1 160.4 158.4 149.4 148.5 163.2 196.6<br />
Total M<strong>in</strong>orities 43.5 65.6 95.5 127.9 140.2 143.8 142.3 143.3 165.7 220.2<br />
Black 34.6 42.9 43.5 65.0 72.5 74.8 75.4 75.7 87.7 112.4<br />
Hispanic 5.3 15.3 34.7 46.2 50.8 51.4 49.8 50.6 58.2 85.4<br />
Asian/Pacific Islander 1.8 4.9 12.7 12.3 12.1 12.6 12.2 12.3 14.8 17.3<br />
American Indian/Alaska Native 1.8 2.5 4.5 4.4 4.9 5.0 4.9 4.6 5.0 5.1<br />
Nonresident alien 3.7 3.5 3.8 2.0 1.7 1.6 1.7 2.0 2.1 3.2<br />
NOTE: Race categories exclude persons of Hispanic ethnicity. Because of underreport<strong>in</strong>g and nonreport<strong>in</strong>g of racial/ethnic data, some figures are slightly lower than correspond<strong>in</strong>g data <strong>in</strong><br />
other tables. Data through 1990 are for <strong>in</strong>stitutions of higher education, while later data are for degree-grant<strong>in</strong>g <strong>in</strong>stitutions. Degree-grant<strong>in</strong>g <strong>in</strong>stitutions grant associate’s or higher degrees<br />
and participate <strong>in</strong> Title IV federal f<strong>in</strong>ancial aid programs. The degree-grant<strong>in</strong>g classification is very similar to the earlier higher education classification, but it <strong>in</strong>cludes more 2-year colleges<br />
and excludes a few higher education <strong>in</strong>stitutions that did not grant degrees. Detail may not sum to totals because of round<strong>in</strong>g.<br />
SOURCE: U.S. Department of <strong>Education</strong>, National Center for <strong>Education</strong> Statistics, Higher <strong>Education</strong> General Information Survey (HEGIS), "Fall Enrollment <strong>in</strong> Colleges and Universities"<br />
surveys, 1976 and 1980; and 1990 through 2009 Integrated Postsecondary <strong>Education</strong> Data System (IPEDS), "Fall Enrollment Survey" (IPEDS-EF:90), and Spr<strong>in</strong>g 2001 through Spr<strong>in</strong>g<br />
2010. (This table was prepared October 2010.)<br />
154<br />
Association of American <strong>Medical</strong> Colleges
<strong>Diversity</strong> <strong>in</strong> <strong>Medical</strong> <strong>Education</strong>: <strong>Facts</strong> & <strong>Figures</strong> <strong>2012</strong><br />
Table 45: Fall Enrollment <strong>in</strong> Degree-Grant<strong>in</strong>g Institutions by Race and Ethnicity of Students and<br />
State of Jurisdiction: 2009<br />
Table 45: Fall Enrollment <strong>in</strong> Degree-Grant<strong>in</strong>g Institutions by Race and Ethnicity of<br />
Students and State of Jurisdiction: 2009<br />
155<br />
Total White Black Hispanic<br />
Asian/ Pacific American Indian/<br />
Islander Alaska Native<br />
Non-resident<br />
alien<br />
United States 20,427,711 12,730,780 2,919,826 2,546,710 1,337,671 207,917 684,807<br />
Alabama 311,740 196,790 94,302 6,492 5,235 2,601 6,320<br />
Alaska 32,406 23,628 1,091 1,149 1,757 4,184 597<br />
Arizona 828,631 497,461 133,415 124,983 29,623 22,669 20,480<br />
Arkansas 168,352 121,219 33,147 5,117 3,052 1,781 4,036<br />
California 2,735,579 1,077,169 223,827 829,598 492,564 22,791 89,630<br />
Colorado 352,034 253,720 28,175 43,281 14,192 5,461 7,205<br />
Connecticut 191,806 131,675 22,213 20,141 9,269 695 7,813<br />
Delaware 55,174 36,835 11,530 2,637 2,186 188 1,798<br />
District of Columbia 136,851 58,897 55,399 7,200 8,355 706 6,294<br />
Florida 1,053,221 556,680 202,182 220,610 38,517 5,019 30,213<br />
Georgia 532,493 292,413 182,151 19,435 21,816 1,949 14,729<br />
Hawaii 74,809 18,090 1,722 3,322 46,313 446 4,916<br />
Idaho 84,450 73,353 948 5,072 1,888 1,219 1,970<br />
Ill<strong>in</strong>ois 900,824 559,591 140,536 114,735 53,343 3,280 29,339<br />
Indiana 441,294 351,369 45,791 15,703 9,952 1,762 16,717<br />
Iowa 350,631 268,332 36,150 21,342 10,749 2,583 11,475<br />
Kansas 210,843 163,525 14,837 11,685 5,656 3,506 11,634<br />
Kentucky 277,907 236,229 28,598 4,281 3,609 982 4,208<br />
Louisiana 251,853 151,097 78,669 7,299 5,829 1,833 7,126<br />
Ma<strong>in</strong>e 70,170 63,464 1,687 1,233 1,407 1,036 1,343<br />
Maryland 358,941 196,157 104,938 16,267 25,396 1,560 14,623<br />
Massachusetts 497,290 342,550 43,248 39,038 37,418 2,061 32,975<br />
Michigan 686,049 509,320 101,671 20,952 23,008 6,385 24,713<br />
M<strong>in</strong>nesota 442,281 340,261 51,991 12,717 19,967 5,281 12,064<br />
Mississippi 173,136 96,574 70,040 1,859 1,699 701 2,263<br />
Missouri 424,944 324,124 59,770 13,725 11,997 2,723 12,605<br />
Montana 51,588 42,883 566 1,214 736 5,045 1,144<br />
Nebraska 138,645 115,365 7,747 6,581 3,567 1,370 4,015<br />
Nevada 125,320 71,516 10,969 24,251 14,449 1,526 2,609<br />
New Hampshire 74,234 64,366 2,038 2,953 2,192 568 2,117<br />
New Jersey 432,127 245,433 62,825 67,690 37,488 1,370 17,321<br />
New Mexico 152,752 62,147 5,098 64,839 3,165 13,993 3,510<br />
New York 1,289,604 749,077 183,482 161,351 109,992 5,640 80,062<br />
North Carol<strong>in</strong>a 568,865 368,984 142,866 20,991 15,646 6,901 13,477<br />
North Dakota 54,433 45,579 1,130 697 646 3,540 2,841<br />
Ohio 711,095 555,596 99,094 17,026 15,899 2,980 20,500<br />
Oklahoma 220,650 150,872 22,078 10,177 5,951 22,632 8,940<br />
Oregon 243,412 191,978 6,900 16,940 15,978 4,514 7,102<br />
Pennsylvania 778,123 590,734 87,946 33,913 35,095 2,478 27,957<br />
Rhode Island 84,673 64,528 5,403 6,785 3,898 397 3,662<br />
South Carol<strong>in</strong>a 246,667 162,776 69,554 5,725 4,108 934 3,570<br />
South Dakota 53,342 45,689 1,099 863 607 3,839 1,245<br />
Tennessee 332,918 241,043 69,274 8,422 6,702 1,247 6,230<br />
Texas 1,447,868 682,891 193,287 430,457 80,169 7,998 53,066<br />
Utah 236,590 199,608 4,656 14,413 8,657 2,717 6,539<br />
Vermont 44,975 40,514 1,068 1,184 1,106 240 863<br />
Virg<strong>in</strong>ia 545,036 346,927 119,457 27,956 33,028 2,707 14,961<br />
Wash<strong>in</strong>gton 382,532 277,383 18,098 29,390 37,984 6,201 13,476<br />
West Virg<strong>in</strong>ia 142,484 119,069 12,136 5,406 2,379 726 2,768<br />
Wiscons<strong>in</strong> 373,228 310,658 23,744 14,058 12,124 4,097 8,547<br />
Wyom<strong>in</strong>g 37,093 32,480 463 2,044 396 722 988<br />
US Service Academies 15,748 12,161 820 1,511 912 133 211<br />
Other jurisdictions 243,792 563 2,215 226,800 13,128 24 1,062<br />
American Samoa<br />
Federated States of<br />
2,189 6 0 2 2,003 1 177<br />
Micronesia 3,401 3 0 0 3,398 0 0<br />
Guam 5,755 200 32 44 5,420 10 49<br />
Marshall Islands 847 0 0 0 842 0 5<br />
Northern Marianas 989 0 1 1 748 0 239<br />
Palau 651 0 0 0 651 0 0<br />
Puerto Rico 227,358 238 82 226,569 53 9 407<br />
US Virg<strong>in</strong> Islands 2,602 116 2,100 184 13 4 185<br />
NOTE: Race categories exclude persons of Hispanic ethnicity. Degree-grant<strong>in</strong>g <strong>in</strong>stitutions grant associate's or higher degrees and participate <strong>in</strong> Title<br />
IV federal f<strong>in</strong>ancial aid programs. Detail may not sum to totals because of round<strong>in</strong>g.<br />
SOURCE: US Department of <strong>Education</strong>, National Center for <strong>Education</strong> Statistics, 2009 Integrated Postsecondary <strong>Education</strong> Data System (IPEDS),<br />
Spr<strong>in</strong>g 2010 (This table was prepared October 2010).<br />
Association of American <strong>Medical</strong> Colleges
<strong>Diversity</strong> <strong>in</strong> <strong>Medical</strong> <strong>Education</strong>: <strong>Facts</strong> & <strong>Figures</strong> <strong>2012</strong><br />
Table 46: First Professional Degrees Conferred by Degree-Grant<strong>in</strong>g Institutions <strong>in</strong> Dentistry,<br />
Medic<strong>in</strong>e, and Law by Number of Institutions Conferr<strong>in</strong>g Degrees and Gender of Student: Selected<br />
Years, 1949–2008<br />
Table 46: First Professional Degrees Conferred by Degree-Grant<strong>in</strong>g Institutions <strong>in</strong> Dentistry, Medic<strong>in</strong>e,<br />
and Law by Number of Institutions Conferr<strong>in</strong>g Degrees and Gender of Student: Selected Years 1949-2008<br />
Dentistry (DDS or DMD)<br />
Medic<strong>in</strong>e (MD)<br />
Law (LLB or JD)<br />
Degrees conferred<br />
Degrees conferred<br />
Degrees conferred<br />
Number of<br />
Number of<br />
Number of<br />
Year<br />
Schools<br />
Total Men Women Schools<br />
Total Men Women Schools<br />
Total Men Women<br />
1949-50 40 2,579 2,561 18 72 5,612 5,028 584 --- --- --- ---<br />
1951-52 41 2,918 2,895 23 72 6,201 5,871 330 --- --- --- ---<br />
1953-54 42 3,102 3,063 39 73 6,712 6,377 335 --- --- --- ---<br />
1955-56 42 3,009 2,975 34 73 6,810 6,464 346 131 8,262 7,974 288<br />
1957-58 43 3,065 3,031 34 75 6,816 6,469 347 131 9,394 9,122 272<br />
1959-60 45 3,247 3,221 26 79 7,032 6,645 387 134 9,240 9,010 230<br />
1961-62 46 3,183 3,166 17 81 7,138 6,749 389 134 9,364 9,091 273<br />
1963-64 46 3,180 3,168 12 82 7,303 6,878 425 133 10,679 10,372 307<br />
1964-65 46 3,108 3,086 22 81 7,304 6,832 472 137 11,583 11,216 367<br />
1965-66 47 3,178 3,146 32 84 7,673 7,170 503 136 13,246 12,776 470<br />
1967-68 48 3,422 3,375 47 85 7,944 7,318 626 138 16,454 15,805 649<br />
1968-69 --- 3,408 3,376 32 --- 8,025 7,415 610 --- 17,053 16,373 680<br />
1969-70 48 3,718 3,684 34 86 8,314 7,615 699 145 14,916 14,115 801<br />
1970-71 48 3,745 3,703 42 89 8,919 8,110 809 147 17,421 16,181 1,240<br />
1971-72 48 3,862 3,819 43 92 9,253 8,423 830 147 21,764 20,266 1,498<br />
1972-73 51 4,047 3,992 55 97 10,307 9,388 919 152 27,205 25,037 2,168<br />
1973-74 52 4,440 4,355 85 99 11,356 10,093 1,263 151 29,326 25,986 3,340<br />
1974-75 52 4,773 4,627 146 104 12,447 10,818 1,629 154 29,296 24,881 4,415<br />
1975-76 56 5,425 5,187 238 107 13,426 11,252 2,174 166 32,293 26,085 6,208<br />
1976-77 57 5,138 4,764 374 109 13,461 10,891 2,570 169 34,104 26,447 7,657<br />
1977-78 57 5,189 4,623 566 109 14,279 11,210 3,069 169 34,402 25,457 8,945<br />
1978-79 58 5,434 4,794 640 109 14,786 11,381 3,405 175 35,206 25,180 10,026<br />
1979-80 58 5,258 4,558 700 112 14,902 11,416 3,486 179 35,647 24,893 10,754<br />
1980-81 58 5,460 4,672 788 116 15,505 11,672 3,833 176 36,331 24,563 11,768<br />
1981-82 59 5,282 4,467 815 119 15,814 11,867 3,947 180 35,991 23,965 12,026<br />
1982-83 59 5,585 4,631 954 118 15,484 11,350 4,134 177 36,853 23,550 13,303<br />
1983-84 60 5,353 4,302 1,051 119 15,813 11,359 4,454 179 37,012 23,382 13,630<br />
1984-85 59 5,339 4,233 1,106 120 16,041 11,167 4,874 181 37,491 23,070 14,421<br />
1985-86 59 5,046 3,907 1,139 120 15,938 11,022 4,916 181 35,844 21,874 13,970<br />
1986-87 58 4,741 3,603 1,138 121 15,428 10,431 4,997 179 36,056 21,561 14,495<br />
1987-88 57 4,477 3,300 1,177 122 15,358 10,278 5,080 180 35,397 21,067 14,330<br />
1988-89 58 4,265 3,124 1,141 124 15,460 10,310 5,150 182 35,634 21,069 14,565<br />
1989-90 57 4,100 2,834 1,266 124 15,075 9,923 5,152 182 36,485 21,079 15,406<br />
1990-91 55 3,699 2,510 1,189 121 15,043 9,629 5,414 179 37,945 21,643 16,302<br />
1991-92 52 3,593 2,431 1,162 120 15,243 9,796 5,447 177 38,848 22,260 16,588<br />
1992-93 55 3,605 2,383 1,222 122 15,531 9,679 5,852 184 40,302 23,182 17,120<br />
1994-95 53 3,897 2,480 1,417 119 15,537 9,507 6,030 183 39,349 22,592 16,757<br />
1995-96 53 3,697 2,374 1,323 119 15,341 9,061 6,280 183 39,828 22,508 17,320<br />
1996-97 52 3,784 2,387 1,397 118 15,571 9,121 6,450 184 40,079 22,548 17,531<br />
1997-98 53 4,032 2,490 1,542 117 15,424 9,006 6,418 185 39,331 21,876 17,455<br />
1998-99 53 4,144 2,674 1,470 118 15,562 8,954 6,608 188 39,167 21,628 17,539<br />
1999-2000 54 4,250 2,547 1,703 118 15,286 8,761 6,525 190 38,152 20,638 17,514<br />
2000-01 54 4,391 2,696 1,695 118 15,403 8,728 6,675 192 37,904 19,981 17,923<br />
2001-02 53 4,239 2,608 1,631 118 15,237 8,469 6,768 192 38,981 20,254 18,727<br />
2002-03 53 4,345 2,654 1,691 118 15,034 8,221 6,813 194 39,067 19,916 19,151<br />
2003-04 53 4,335 2,532 1,803 118 15,442 8,273 7,169 195 40,209 20,332 19,877<br />
2004-05 53 4,454 2,505 1,949 120 15,461 8,151 7,310 198 43,423 22,297 21,126<br />
2005-06 54 4,389 2,435 1,954 119 15,455 7,900 7,555 197 43,440 22,597 20,843<br />
2006-07 55 4,596 2,548 2,048 120 15,730 7,987 7,743 200 43,486 22,777 20,709<br />
2007-08 55 4,795 2,661 2,134 120 15,646 7,935 7,711 201 43,769 23,197 20,572<br />
2008-09<br />
---Not available<br />
55 4,918 2,637 2,281 120 15,987 8,164 7,823 203 44,045 23,860 20,185<br />
NOTE: Degree-grant<strong>in</strong>g <strong>in</strong>stitutions grant associate’s or higher degrees and participate <strong>in</strong> Title IV federal f<strong>in</strong>ancial aid programs.<br />
SOURCE: US Department of <strong>Education</strong>, National Center for <strong>Education</strong> Statistics, Earned Degrees Conferred, 1949-50 through 1964-65; Higher <strong>Education</strong> General<br />
Information Survey (HEGIS), "Degrees and Other Formal Awards Conferred" surveys, 1965-66 through 1985-86; and 1986-87 through 2008-09 Integrated Postsecondary<br />
<strong>Education</strong> Data System, "Completions Survey" (IPEDS-C:87-99), and Fall 2000 through Fall 2009 (This table was prepared September 2010<br />
156<br />
Association of American <strong>Medical</strong> Colleges
Control of <strong>in</strong>stitution and field of study<br />
<strong>Diversity</strong> <strong>in</strong> <strong>Medical</strong> <strong>Education</strong>: <strong>Facts</strong> & <strong>Figures</strong> <strong>2012</strong><br />
Table 47: First Professional Degrees Conferred by Control of Degree-Grant<strong>in</strong>g Institution and Field<br />
of Study: Selected Years, 1985–2008<br />
Table 47: First Professional Degrees Conferred by Control of Degree-Grant<strong>in</strong>g Institution and Field of Study: Selected Years, 1985-2009<br />
1985-<br />
1986<br />
1990-<br />
1991<br />
Total, all <strong>in</strong>stitutions 73,910 71,948 76,734 80,057 79,707 80,698 80,897 83,041 87,289 87,655 90,064 91,309 92,004<br />
Dentistry (D.D.S. or D.M.D.) 5,046 3,699 3,697 4,250 4,391 4,239 4,345 4,335 4,454 4,389 4,596 4,795 4,918<br />
Medic<strong>in</strong>e (M.D.) 15,938 15,043 15,341 15,286 15,403 15,237 15,034 15,442 15,461 15,455 15,730 15,646 15,987<br />
Optometry (O.D.) 1,029 1,115 1,231 1,293 1,289 1,280 1,281 1,275 1,252 1,198 1,311 1,304 1,338<br />
Osteopathic medic<strong>in</strong>e (D.O.) 1,547 1,459 1,895 2,236 2,450 2,416 2,596 2,722 2,762 2,718 2,992 3,232 3,665<br />
Pharmacy (Pharm.D.) 903 1,244 2,555 5,669 6,324 7,076 7,474 8,221 8,885 9,292 10,439 10,932 11,291<br />
Podiatry (Pod.D. or D.P.) or<br />
podiatric medic<strong>in</strong>e (D.P.M.) 612 589 650 569 528 474 439 382 343 347 331 555 431<br />
Veter<strong>in</strong>ary medic<strong>in</strong>e (D.V.M.) 2,270 2,032 2,109 2,251 2,248 2,289 2,354 2,228 2,354 2,370 2,443 2,504 2,377<br />
Chiropractic (D.C. or D.C.M.) 3,395 2,640 3,379 3,809 3,796 3,284 2,718 2,730 2,560 2,564 2,525 2,639 2,512<br />
Law (LL.B. or J.D.) 35,844 37,945 39,828 38,152 37,904 38,981 39,067 40,209 43,423 43,440 43,486 43,769 44,045<br />
Theology (M. Div., M.H.L., B.D.,<br />
or Ord. and M.H.L./Rav.) 7,283 5,695 5,879 6,129 5,026 5,195 5,360 5,332 5,533 5,666 5,990 5,751 5,362<br />
Other 43 487 170 413 348 227 229 165 262 216 221 182 78<br />
Total, public <strong>in</strong>stitutions 29,568 29,554 29,882 32,247 32,633 33,439 33,549 34,499 35,768 36,269 36,855 37,278 37,357<br />
Dentistry (D.D.S. or D.M.D.) 2,827 2,308 2,198 2,512 2,477 2,525 2,493 2,498 2,577 2,669 2,769 2,760 2,870<br />
Medic<strong>in</strong>e (M.D.) 9,991 9,364 9,370 9,389 9,408 9,390 9,276 9,418 9,536 9,650 9,733 9,646 9,795<br />
Optometry (O.D.) 441 477 499 493 497 503 481 476 477 462 518 492 517<br />
Osteopathic medic<strong>in</strong>e (D.O.) 486 493 528 535 562 538 571 586 568 585 637 634 679<br />
Pharmacy (Pharm.D.)<br />
Podiatry (Pod.D. or D.P.) or<br />
473 808 1,557 3,485 3,876 4,382 4,558 4,930 5,352 5,523 5,903 6,218 6,395<br />
podiatric medic<strong>in</strong>e (D.P.M.) 0 0 0 84 84 75 81 64 64 65 66 73 68<br />
Veter<strong>in</strong>ary medic<strong>in</strong>e (D.V.M.) 1,931 1,814 1,889 2,021 2,017 2,052 2,023 1,912 2,033 2,048 2,116 2,123 1,968<br />
Chiropractic (D.C. or D.C.M.) 0 0 0 0 0 0 0 0 0 0 0 0 0<br />
Law (LL.B. or J.D.)<br />
Theology (M. Div., M.H.L., B.D.,<br />
13,419 14,290 13,841 13,728 13,712 13,974 14,066 14,615 15,161 15,267 15,113 15,332 15,065<br />
or Ord. and M.H.L./Rav.) 0 0 0 0 0 0 0 0 0 0 0 0 0<br />
Other 0 0 0 0 0 0 0 0 0 0 0 0 0<br />
Total, private <strong>in</strong>stitutions 44,342 42,394 46,852 47,810 47,074 47,259 47,348 48,542 51,521 51,386 53,209 54,031 54,647<br />
Dentistry (D.D.S. or D.M.D.) 2,219 1,391 1,499 1,738 1,914 1,714 1,852 1,837 1,877 1,720 1,827 2,035 2,048<br />
Medic<strong>in</strong>e (M.D.) 5,947 5,679 5,971 5,897 5,995 5,847 5,758 6,024 5,925 5,805 5,997 6,000 6,192<br />
Optometry (O.D.) 588 638 732 800 792 777 800 799 775 736 793 812 821<br />
Osteopathic medic<strong>in</strong>e (D.O.) 1,061 966 1,367 1,701 1,888 1,878 2,025 2,136 2,194 2,133 2,355 2,598 2,986<br />
Pharmacy (Pharm.D.)<br />
Podiatry (Pod.D. or D.P.) or<br />
430 436 998 2,184 2,448 2,694 2,916 3,291 3,533 3,769 4,536 4,714 4,896<br />
podiatric medic<strong>in</strong>e (D.P.M.) 612 589 650 485 444 399 358 318 279 282 265 482 363<br />
Veter<strong>in</strong>ary medic<strong>in</strong>e (D.V.M.) 339 218 220 230 231 237 331 316 321 322 327 381 409<br />
Chiropractic (D.C. or D.C.M.) 3,395 2,640 3,379 3,809 3,796 3,284 2,718 2,730 2,560 2,564 2,525 2,639 2,512<br />
Law (LL.B. or J.D.)<br />
Theology (M. Div., M.H.L., B.D.,<br />
22,425 23,655 25,987 24,424 24,192 25,007 25,001 25,594 28,262 28,173 28,373 28,437 28,980<br />
or Ord. and M.H.L./Rav.) 7,283 5,695 5,879 6,129 5,026 5,195 5,360 5,332 5,533 5,666 5,990 5,751 5,362<br />
Other 43 487 170 413 348 227 229 165 262 216 221 182 78<br />
NOTE: Degree-grant<strong>in</strong>g <strong>in</strong>stitutions grant associate’s or higher degrees and participate <strong>in</strong> Title IV federal f<strong>in</strong>ancial aid programs. Includes degrees that require at least six years of college work<br />
for completion (<strong>in</strong>clud<strong>in</strong>g at least two years of preprofessional tra<strong>in</strong><strong>in</strong>g).<br />
SOURCE: U.S. Department of <strong>Education</strong>, National Center for <strong>Education</strong> Statistics, Higher <strong>Education</strong> General Information Survey (HEGIS), "Degrees and Other Formal Awards Conferred,"<br />
1985-86; and 1990-91 through 2008-09 Integrated Postsecondary <strong>Education</strong> Data System, "Completions Survey" (IPEDS-C:91-99), and Fall 2000 through Fall 2009. (This table was prepared<br />
September 2010.)<br />
157<br />
1995-<br />
1996<br />
1999-<br />
2000<br />
2000-<br />
2001<br />
2001-<br />
2002<br />
2002-<br />
2003<br />
2003-<br />
2004<br />
2004-<br />
2005<br />
2005-<br />
2006<br />
2006-<br />
2007<br />
2007-<br />
2008<br />
2008-<br />
2009<br />
Association of American <strong>Medical</strong> Colleges
<strong>Diversity</strong> <strong>in</strong> <strong>Medical</strong> <strong>Education</strong>: <strong>Facts</strong> & <strong>Figures</strong> <strong>2012</strong><br />
Table 48: Bachelor’s Degrees Conferred by Degree-Grant<strong>in</strong>g Institutions, Race and Ethnicity, and<br />
Gender of Student: Table 48: Selected Bachelor's Years, Degrees 1976–2008<br />
Conferred by Degree-Grant<strong>in</strong>g Institutions, Race and Ethnicity,<br />
and Gender of Student: Selected Years, 1976-2008<br />
Year and Gender<br />
Total<br />
Total<br />
1976-77\1\ 917,900 807,688 58,636 18,743 13,793 3,326 15,714<br />
1980-81\2\ 934,800 807,319 60,673 21,832 18,794 3,593 22,589<br />
1989-90 1,051,344 887,151 61,046 32,829 39,230 4,390 26,698<br />
1990-91 1,094,538 914,093 66,375 37,342 42,529 4,583 29,616<br />
1993-94 1,169,275 939,008 83,909 50,299 55,689 6,192 34,178<br />
1994-95 1,160,134 914,610 87,236 54,230 60,502 6,610 36,946<br />
1995-96 1,164,792 905,846 91,496 58,351 64,433 6,976 37,690<br />
1996-97 1,172,879 900,809 94,349 62,509 68,859 7,425 38,928<br />
1997-98 1,184,406 901,344 98,251 66,005 71,678 7,903 39,225<br />
1998-99 1,200,303 907,245 102,214 70,085 74,197 8,423 38,139<br />
1999-2000 1,237,875 929,106 108,013 75,059 77,912 8,719 39,066<br />
2000-01 1,244,171 927,357 111,307 77,745 78,902 9,049 39,811<br />
2001-02 1,291,900 958,597 116,623 82,966 83,093 9,165 41,456<br />
2002-03 1,348,811 994,616 124,253 89,029 87,964 9,875 43,074<br />
2003-04 1,399,542 1,026,114 131,241 94,644 92,073 10,638 44,832<br />
2004-05 1,439,264 1,049,141 136,122 101,124 97,209 10,307 45,361<br />
2005-06 1,485,242 1,075,561 142,420 107,588 102,376 10,940 46,357<br />
2006-07 1,524,092 1,099,850 146,653 114,936 105,297 11,455 45,901<br />
2007-08 1,563,069 1,122,675 152,457 123,048 109,058 11,509 44,322<br />
2008-09 1,601,368 1,144,612 156,615 129,526 112,510 12,222 45,883<br />
Men<br />
1976-77\1\ 494,424 438,161 25,147 10,318 7,638 1,804 11,356<br />
1980-81\2\ 469,625 406,173 24,511 10,810 10,107 1,700 16,324<br />
1989-90 491,696 414,982 23,257 14,932 19,711 1,860 16,954<br />
1990-91 504,045 421,290 24,800 16,598 21,203 1,938 18,216<br />
1993-94 532,422 430,526 30,766 21,834 26,952 2,620 19,724<br />
1994-95 526,131 417,878 31,793 23,626 28,992 2,739 21,103<br />
1995-96 522,454 409,565 32,974 25,029 30,669 2,885 21,332<br />
1996-97 520,515 403,366 33,616 26,318 32,521 2,996 21,698<br />
1997-98 519,956 399,553 34,510 27,677 33,445 3,151 21,620<br />
1998-99 518,746 396,996 34,876 28,662 34,225 3,323 20,664<br />
1999-2000 530,367 402,961 37,024 30,301 35,853 3,464 20,764<br />
2000-01 531,840 401,780 38,103 31,368 35,865 3,700 21,024<br />
2001-02 549,816 414,892 39,196 32,951 37,660 3,624 21,493<br />
2002-03 573,258 430,248 41,494 35,101 40,230 3,870 22,315<br />
2003-04 595,425 445,483 43,851 37,288 41,360 4,244 23,199<br />
2004-05 613,000 456,592 45,810 39,490 43,711 4,143 23,254<br />
2005-06 630,600 467,467 48,079 41,814 45,809 4,203 23,228<br />
2006-07 649,570 480,558 49,685 44,750 47,582 4,505 22,490<br />
2007-08 667,928 492,137 52,247 47,884 49,485 4,523 21,652<br />
2008-09 685,382 503,356 53,473 50,628 50,743 4,849 22,333<br />
158<br />
White<br />
Number of degrees conferred<br />
Black<br />
Hispanic<br />
American<br />
Asian/ Pacific Indian/<br />
Islander Alaska Native<br />
Non-resident<br />
Alien<br />
Association of American <strong>Medical</strong> Colleges
<strong>Diversity</strong> <strong>in</strong> <strong>Medical</strong> <strong>Education</strong>: <strong>Facts</strong> & <strong>Figures</strong> <strong>2012</strong><br />
Table 48: Bachelor’s Degrees Conferred by Degree-Grant<strong>in</strong>g Institutions, Race and Ethnicity, and<br />
Table 48: Bachelor's Degrees Conferred by Degree-Grant<strong>in</strong>g Gender of Student: Institutions, Selected Race Years, and Ethnicity, 1976–2008 (cont<strong>in</strong>ued)<br />
and Gender of Student: Selected Years, 1976-2008 (cont<strong>in</strong>ued)<br />
Year and Gender<br />
Women<br />
1976-77\1\ 423,476 369,527 33,489 8,425 6,155 1,522 4,358<br />
1980-81\2\ 465,175 401,146 36,162 11,022 8,687 1,893 6,265<br />
1989-90 559,648 472,169 37,789 17,897 19,519 2,530 9,744<br />
1990-91 590,493 492,803 41,575 20,744 21,326 2,645 11,400<br />
1993-94 636,853 508,482 53,143 28,465 28,737 3,572 14,454<br />
1994-95 634,003 496,732 55,443 30,604 31,510 3,871 15,843<br />
1995-96 642,338 496,281 58,522 33,322 33,764 4,091 16,358<br />
1996-97 652,364 497,443 60,733 36,191 36,338 4,429 17,230<br />
1997-98 664,450 501,791 63,741 38,328 38,233 4,752 17,605<br />
1998-99 681,557 510,249 67,338 41,423 39,972 5,100 17,475<br />
1999-2000 707,508 526,145 70,989 44,758 42,059 5,255 18,302<br />
2000-01 712,331 525,577 73,204 46,377 43,037 5,349 18,787<br />
2001-02 742,084 543,705 77,427 50,015 45,433 5,541 19,963<br />
2002-03 775,553 564,368 82,759 53,928 47,734 6,005 20,759<br />
2003-04 804,117 580,631 87,390 57,356 50,713 6,394 21,633<br />
2004-05 826,264 592,549 90,312 61,634 53,498 6,164 22,107<br />
2005-06 854,642 608,094 94,341 65,774 56,567 6,737 23,129<br />
2006-07 .........… 874,522 619,292 96,968 70,186 57,715 6,950 23,411<br />
2007-08 .........… 895,141 630,538 100,210 75,164 59,573 6,986 22,670<br />
2008-09 .........… 915,986 641,256 103,142 78,898 61,767 7,373 23,550<br />
\1\Excludes 1,121 males and 528 females whose racial/ethnic group was not available.<br />
\2\Excludes 258 males and 82 females whose racial/ethnic group was not available.<br />
NOTE: Degree-grant<strong>in</strong>g <strong>in</strong>stitutions grant associate’s or higher degrees and participate <strong>in</strong> Title IV federal f<strong>in</strong>ancial aid<br />
programs. Race categories exclude persons of Hispanic ethnicity. For 1989-90 and later years, reported racial/ethnic<br />
distributions of students by level of degree, field of degree, and gender were used to estimate race/ethnicity for students<br />
whose race/ethnicity was not reported. Detail may not sum to totals because of round<strong>in</strong>g.<br />
SOURCE: U.S. Department of <strong>Education</strong>, National Center for <strong>Education</strong> Statistics, Higher <strong>Education</strong> General Information<br />
Survey (HEGIS), "Degrees and Other Formal Awards Conferred" surveys, 1976-77 and 1980-81; and 1989-90 through<br />
2008-09 Integrated Postsecondary <strong>Education</strong> Data System, "Completions Survey" (IPEDS-C:90-99), and Fall 2000 through<br />
Fall 2009. (This table was prepared September 2010.)<br />
159<br />
Number of degrees conferred<br />
Total White Black Hispanic<br />
American<br />
Asian/ Pacific Indian/<br />
Islander Alaska Native<br />
Non-resident<br />
alien<br />
Association of American <strong>Medical</strong> Colleges
<strong>Diversity</strong> <strong>in</strong> <strong>Medical</strong> <strong>Education</strong>: <strong>Facts</strong> & <strong>Figures</strong> <strong>2012</strong><br />
Table 49: Bachelor’s Degrees Conferred by Gender, Race and Ethnicity, and Selected Major Field of<br />
Study, 2006–2009<br />
Table 49: Bachelor's Degrees Conferred by Gender, Race and Ethnicity, and Selected Major Field of Study,<br />
2006-2009<br />
Black or African<br />
American Indian<br />
Major<br />
All Graduates American Hispanic / Lat<strong>in</strong>o or Alaska Native Asian<br />
Year Fields Gender # % # % # % # % # %<br />
Men 630,600 42.5% 48,079 33.8% 41,814 38.9% 4,203 38.4% 45,809 44.7%<br />
All Fields Women 854,642 57.5% 94,341 66.2% 65,774 61.1% 6,737 61.6% 56,567 55.3%<br />
Total 1,485,242 100.0% 142,420 100.0% 107,588 100.0% 10,940 100.0% 102,376 100.0%<br />
2006<br />
2007<br />
2008<br />
2009<br />
Biology<br />
/Biomedical<br />
Sciences<br />
Physical<br />
Sciences<br />
Health<br />
Professions<br />
All Fields<br />
Biology<br />
/Biomedical<br />
Sciences<br />
Physical<br />
Sciences<br />
Health<br />
Professions<br />
All Fields<br />
Biology<br />
/Biomedical<br />
Sciences<br />
Physical<br />
Sciences<br />
Health<br />
Professions<br />
All Fields<br />
Biology<br />
/Biomedical<br />
Sciences<br />
Physical<br />
Sciences<br />
Health<br />
Professions<br />
Men 26,651 38.5% 1,398 25.8% 1,573 37.4% 164 33.5% 3,957 38.9%<br />
Women 42,527 61.5% 4,011 74.2% 2,630 62.6% 325 66.5% 6,208 61.1%<br />
Total 69,178 100.0% 5,409 100.0% 4,203 100.0% 489 100.0% 10,165 100.0%<br />
Men 11,831 58.2% 477 40.5% 494 54.7% 83 53.5% 884 48.6%<br />
Women 8,487 41.8% 701 59.5% 409 45.3% 72 46.5% 934 51.4%<br />
Total 20,318 100.0% 1,178 100.0% 903 100.0% 155 100.0% 1,818 100.0%<br />
Men 12,914 14.0% 1,339 13.0% 920 17.6% 100 14.9% 1,001 19.6%<br />
Women 79,059 86.0% 8,929 87.0% 4,310 82.4% 573 85.1% 4,101 80.4%<br />
Total 91,973 100.0% 10,268 100.0% 5,230 100.0% 673 100.0% 5,102 100.0%<br />
Men 649,570 42.6% 49,685 33.9% 44,750 38.9% 4,505 39.3% 47,582 45.2%<br />
Women 874,522 57.4% 96,968 66.1% 70,186 61.1% 6,950 60.7% 57,715 54.8%<br />
Total 1,524,092 100.0% 146,653 100.0% 114,936 100.0% 11,455 100.0% 105,297 100.0%<br />
Men 29,951 39.9% 1,577 26.5% 1,807 38.9% 209 38.8% 4,727 40.5%<br />
Women 45,200 60.1% 4,373 73.5% 2,844 61.1% 330 61.2% 6,938 59.5%<br />
Total 75,151 100.0% 5,950 100.0% 4,651 100.0% 539 100.0% 11,665 100.0%<br />
Men 12,455 59.1% 522 43.2% 548 57.5% 78 49.7% 1,018 50.1%<br />
Women 8,618 40.9% 686 56.8% 405 42.5% 79 50.3% 1,013 49.9%<br />
Total 21,073 100.0% 1,208 100.0% 953 100.0% 157 100.0% 2,031 100.0%<br />
Men 14,325 14.1% 1,483 13.0% 1,043 17.2% 120 15.4% 1,182 19.7%<br />
Women 87,485 85.9% 9,930 87.0% 5,026 82.8% 657 84.6% 4,811 80.3%<br />
Total 101,810 100.0% 11,413 100.0% 6,069 100.0% 777 100.0% 5,993 100.0%<br />
Men 667,928 42.7% 52,247 34.3% 47,884 38.9% 4,523 39.3% 49,485 45.4%<br />
Women 895,141 57.3% 100,210 65.7% 75,164 61.1% 6,986 60.7% 59,573 54.6%<br />
Total 1,563,069 100.0% 152,457 100.0% 123,048 100.0% 11,509 100.0% 109,058 100.0%<br />
Men 31,637 40.6% 1,639 26.8% 2,031 39.2% 223 42.7% 5,520 42.6%<br />
Women 46,217 59.4% 4,474 73.2% 3,149 60.8% 299 57.3% 7,441 57.4%<br />
Total 77,854 100.0% 6,113 100.0% 5,180 100.0% 522 100.0% 12,961 100.0%<br />
Men 12,959 59.1% 536 42.4% 636 55.9% 70 47.0% 1,163 52.3%<br />
Women 8,975 40.9% 728 57.6% 502 44.1% 79 53.0% 1,062 47.7%<br />
Total 21,934 100.0% 1,264 100.0% 1,138 100.0% 149 100.0% 2,225 100.0%<br />
Men 16,286 14.6% 1,807 14.1% 1,173 17.4% 126 15.1% 1,494 21.2%<br />
Women 95,192 85.4% 11,035 85.9% 5,576 82.6% 708 84.9% 5,547 78.8%<br />
Total 111,478 100.0% 12,842 100.0% 6,749 100.0% 834 100.0% 7,041 100.0%<br />
Men 685,382 42.8% 53,473 34.1% 50,628 39.1% 4,849 39.7% 50,743 45.1%<br />
Women 915,986 57.2% 103,142 65.9% 78,898 60.9% 7,373 60.3% 61,767 54.9%<br />
Total 1,601,368 100.0% 156,615 100.0% 129,526 100.0% 12,222 100.0% 112,510 100.0%<br />
Men 32,925 40.8% 1,755 27.5% 2,199 39.7% 232 39.3% 5,754 42.1%<br />
Women 47,831 59.2% 4,624 72.5% 3,340 60.3% 358 60.7% 7,912 57.9%<br />
Total 80,756 100.0% 6,379 100.0% 5,539 100.0% 590 100.0% 13,666 100.0%<br />
Men 13,299 59.2% 567 43.1% 642 54.9% 104 57.8% 1,192 51.2%<br />
Women 9,167 40.8% 748 56.9% 528 45.1% 76 42.2% 1,138 48.8%<br />
Total 22,466 100.0% 1,315 100.0% 1,170 100.0% 180 100.0% 2,330 100.0%<br />
Men 17,792 14.8% 1,987 14.4% 1,255 16.9% 135 14.5% 1,726 21.0%<br />
Women 102,696 85.2% 11,840 85.6% 6,175 83.1% 793 85.5% 6,511 79.0%<br />
Total 120,488 100.0% 13,827 100.0% 7,430 100.0% 928 100.0% 8,237 100.0%<br />
Source: U.S. Department of <strong>Education</strong>, National Center for <strong>Education</strong> Statistics,<br />
Integrated Postsecondary <strong>Education</strong> Data System (IPEDS), Spr<strong>in</strong>g 2010. The data were recompiled.<br />
160<br />
Association of American <strong>Medical</strong> Colleges
Table 50: Intercensal Estimates of the Population by Gender, Race, and Hispanic Orig<strong>in</strong> for the<br />
United States: April 1, 2000 to July 1, 2010<br />
Table 50: Intercensal Estimates of the Resident Population by Gender, Race, and Hispanic Orig<strong>in</strong> for the United States: April 1, 2000 to July 1, 2010<br />
Gender, Race, and April 1,<br />
Hispanic Orig<strong>in</strong> 2000 2000 2001 2002 2003 2004 2005 2006 2007 2008 2009<br />
Both Men & Women 281,424,600 282,162,411 284,968,955 287,625,193 290,107,933 292,805,298 295,516,599 298,379,912 301,231,207 304,093,966 306,771,529 308,745,538 309,349,689<br />
1<br />
Intercensal Estimates (as of July 1) April 1,<br />
2010 2<br />
July 1,<br />
2010 3<br />
One Race 277,526,878 278,202,854 280,751,836 283,145,208 285,356,777 287,765,603 290,177,504 292,723,217 295,238,527 297,748,279 300,065,151 301,761,343 302,323,458<br />
White 228,106,498 228,530,479 230,049,196 231,446,915 232,717,191 234,120,447 235,491,577 236,954,818 238,378,087 239,783,014 241,034,399 241,937,061 242,295,420<br />
Black 35,704,871 35,814,706 36,263,029 36,684,650 37,066,096 37,510,582 37,961,688 38,443,048 38,935,533 39,429,414 39,902,270 40,250,635 40,357,516<br />
AIAN 2,663,851 2,684,491 2,769,731 2,857,113 2,947,575 3,044,517 3,147,772 3,258,666 3,377,213 3,504,878 3,636,766 3,739,506 3,753,858<br />
<strong>Diversity</strong> <strong>in</strong> <strong>Medical</strong> <strong>Education</strong>: <strong>Facts</strong> & <strong>Figures</strong> <strong>2012</strong><br />
Asian 10,589,122 10,705,839 11,182,404 11,649,265 12,099,525 12,542,740 13,007,663 13,475,846 13,934,641 14,395,296 14,833,733 15,159,516 15,239,011<br />
NHPI 462,536 467,339 487,476 507,265 526,390 547,317 568,804 590,839 613,053 635,677 657,983 674,625 677,653<br />
161<br />
Two or More Races 3,897,722 3,959,557 4,217,119 4,479,985 4,751,156 5,039,695 5,339,095 5,656,695 5,992,680 6,345,687 6,706,378 6,984,195 7,026,231<br />
Not Hispanic 246,118,224 246,500,526 247,824,859 249,007,573 250,058,504 251,303,923 252,492,985 253,773,607 255,034,354 256,300,181 257,444,040 258,267,944 258,539,476<br />
One Race 242,711,940 243,048,504 244,184,157 245,176,106 246,032,211 247,069,890 248,046,478 249,102,115 250,125,106 251,141,985 252,032,611 252,663,468 252,901,195<br />
White 195,576,996 195,701,752 195,974,813 196,140,540 196,232,760 196,461,761 196,620,983 196,832,697 197,011,394 197,183,535 197,274,549 197,318,956 197,380,184<br />
Black 34,313,716 34,405,800 34,780,280 35,130,061 35,438,251 35,797,599 36,147,348 36,520,961 36,905,758 37,290,709 37,656,592 37,922,522 38,012,830<br />
AIAN 2,097,464 2,101,969 2,119,929 2,136,918 2,152,127 2,169,359 2,186,123 2,203,091 2,220,301 2,237,304 2,252,408 2,263,258 2,270,371<br />
Asian 10,356,661 10,468,759 10,925,853 11,372,498 11,801,041 12,219,990 12,657,844 13,097,737 13,526,680 13,955,911 14,361,474 14,661,516 14,738,414<br />
NHPI 367,103 370,224 383,282 396,089 408,032 421,181 434,180 447,629 460,973 474,526 487,588 497,216 499,396<br />
Two or More Races 3,406,284 3,452,022 3,640,702 3,831,467 4,026,293 4,234,033 4,446,507 4,671,492 4,909,248 5,158,196 5,411,429 5,604,476 5,638,281<br />
Hispanic 35,306,376 35,661,885 37,144,096 38,617,620 40,049,429 41,501,375 43,023,614 44,606,305 46,196,853 47,793,785 49,327,489 50,477,594 50,810,213<br />
One Race 34,814,938 35,154,350 36,567,679 37,969,102 39,324,566 40,695,713 42,131,026 43,621,102 45,113,421 46,606,294 48,032,540 49,097,875 49,422,263<br />
White 32,529,502 32,828,727 34,074,383 35,306,375 36,484,431 37,658,686 38,870,594 40,122,121 41,366,693 42,599,479 43,759,850 44,618,105 44,915,236<br />
Black 1,391,155 1,408,906 1,482,749 1,554,589 1,627,845 1,712,983 1,814,340 1,922,087 2,029,775 2,138,705 2,245,678 2,328,113 2,344,686<br />
AIAN 566,387 582,522 649,802 720,195 795,448 875,158 961,649 1,055,575 1,156,912 1,267,574 1,384,358 1,476,248 1,483,487<br />
Asian 232,461 237,080 256,551 276,767 298,484 322,750 349,819 378,109 407,961 439,385 472,259 498,000 500,597<br />
NHPI 95,433 97,115 104,194 111,176 118,358 126,136 134,624 143,210 152,080 161,151 170,395 177,409 178,257<br />
Two or More Races 491,438 507,535 576,417 648,518 724,863 805,662 892,588 985,203 1,083,432 1,187,491 1,294,949 1,379,719 1,387,950<br />
Cont<strong>in</strong>ues on next page<br />
Association of American <strong>Medical</strong> Colleges
Table 50: Intercensal Estimates of the Population by Gender, Race, and Hispanic Orig<strong>in</strong> for the<br />
United States: April 1, 2000 to July 1, 2010 (cont<strong>in</strong>ued)<br />
July 1,<br />
2010 3<br />
Table 50: Intercensal Estimates of the Resident Population by Gender, Race, and Hispanic Orig<strong>in</strong> for the United States: April 1, 2000 to July 1, 2010<br />
(cont<strong>in</strong>ued)<br />
Gender, Race, and April 1,<br />
Hispanic Orig<strong>in</strong> 2000 2000 2001 2002 2003 2004 2005 2006 2007 2008 2009<br />
1<br />
Intercensal Estimates (as of July 1) April 1,<br />
2010 2<br />
Men 138,056,128 138,443,407 139,891,492 141,230,559 142,428,897 143,828,012 145,197,078 146,647,265 148,064,854 149,489,951 150,807,454 151,781,326 152,107,993<br />
One Race 136,145,830 136,502,222 137,823,151 139,032,956 140,099,073 141,355,568 142,577,716 143,871,466 145,124,083 146,375,906 147,517,315 148,355,036 148,660,198<br />
White 112,478,128 112,710,885 113,534,140 114,269,447 114,897,973 115,664,854 116,388,486 117,160,246 117,889,727 118,611,132 119,242,290 119,698,920 119,900,452<br />
Black 16,971,838 17,027,514 17,249,678 17,454,795 17,631,747 17,856,753 18,079,607 18,319,259 18,560,639 18,803,371 19,033,988 19,205,040 19,261,272<br />
AIAN 1,332,962 1,343,592 1,386,766 1,431,081 1,476,657 1,526,559 1,579,417 1,637,319 1,699,452 1,766,088 1,835,413 1,889,695 1,897,163<br />
Asian 5,127,697 5,182,557 5,404,575 5,619,624 5,825,262 6,029,141 6,241,041 6,454,207 6,662,593 6,872,141 7,071,165 7,218,477 7,256,825<br />
<strong>Diversity</strong> <strong>in</strong> <strong>Medical</strong> <strong>Education</strong>: <strong>Facts</strong> & <strong>Figures</strong> <strong>2012</strong><br />
NHPI 235,205 237,674 247,992 258,009 267,434 278,261 289,165 300,435 311,672 323,174 334,459 342,904 344,486<br />
Two or More Races 1,910,298 1,941,185 2,068,341 2,197,603 2,329,824 2,472,444 2,619,362 2,775,799 2,940,771 3,114,045 3,290,139 3,426,290 3,447,795<br />
162<br />
Not Hispanic 119,894,001 120,101,363 120,806,379 121,412,514 121,910,556 122,592,198 123,209,018 123,880,397 124,520,814 125,167,045 125,743,410 126,162,526 126,313,918<br />
One Race 118,225,817 118,410,427 119,022,976 119,536,377 119,940,182 120,519,619 121,033,029 121,594,427 122,118,869 122,643,958 123,097,400 123,422,809 123,556,920<br />
White 95,697,274 95,778,530 95,977,450 96,101,267 96,155,748 96,345,151 96,473,133 96,634,152 96,761,624 96,888,612 96,967,512 97,017,621 97,062,393<br />
Black 16,293,733 16,340,639 16,526,760 16,697,032 16,839,027 17,022,156 17,195,036 17,381,618 17,570,226 17,759,656 17,938,016 18,068,911 18,116,542<br />
AIAN 1,036,267 1,038,554 1,047,311 1,055,340 1,062,183 1,070,779 1,078,657 1,086,919 1,095,236 1,103,404 1,110,569 1,115,756 1,119,358<br />
Asian 5,012,924 5,065,475 5,277,648 5,482,580 5,677,382 5,868,951 6,067,137 6,265,903 6,459,261 6,652,963 6,835,430 6,969,823 7,006,807<br />
NHPI 185,619 187,229 193,807 200,158 205,842 212,582 219,066 225,835 232,522 239,323 245,873 250,698 251,820<br />
Two or More Races 1,668,184 1,690,936 1,783,403 1,876,137 1,970,374 2,072,579 2,175,989 2,285,970 2,401,945 2,523,087 2,646,010 2,739,717 2,756,998<br />
Hispanic 18,162,127 18,342,044 19,085,113 19,818,045 20,518,341 21,235,814 21,988,060 22,766,868 23,544,040 24,322,906 25,064,044 25,618,800 25,794,075<br />
One Race 17,920,013 18,091,795 18,800,175 19,496,579 20,158,891 20,835,949 21,544,687 22,277,039 23,005,214 23,731,948 24,419,915 24,932,227 25,103,278<br />
White 16,780,854 16,932,355 17,556,690 18,168,180 18,742,225 19,319,703 19,915,353 20,526,094 21,128,103 21,722,520 22,274,778 22,681,299 22,838,059<br />
Black 678,105 686,875 722,918 757,763 792,720 834,597 884,571 937,641 990,413 1,043,715 1,095,972 1,136,129 1,144,730<br />
AIAN 296,695 305,038 339,455 375,741 414,474 455,780 500,760 550,400 604,216 662,684 724,844 773,939 777,805<br />
Asian 114,773 117,082 126,927 137,044 147,880 160,190 173,904 188,304 203,332 219,178 235,735 248,654 250,018<br />
NHPI 49,586 50,445 54,185 57,851 61,592 65,679 70,099 74,600 79,150 83,851 88,586 92,206 92,666<br />
Two or More Races 242,114 250,249 284,938 321,466 359,450 399,865 443,373 489,829 538,826 590,958 644,129 686,573 690,797<br />
Association of American <strong>Medical</strong> Colleges<br />
Cont<strong>in</strong>ues on next page
Table 50: Intercensal Estimates of the Population by Gender, Race, and Hispanic Orig<strong>in</strong> for the<br />
United States: April 1, 2000 to July 1, 2010 (cont<strong>in</strong>ued)<br />
<strong>Diversity</strong> <strong>in</strong> <strong>Medical</strong> <strong>Education</strong>: <strong>Facts</strong> & <strong>Figures</strong> <strong>2012</strong><br />
Table 50: Intercensal Estimates of the Resident Population by Gender, Race, and Hispanic Orig<strong>in</strong> for the United States: April 1, 2000 to July 1, 2010<br />
(cont<strong>in</strong>ued)<br />
Gender, Race, and April 1,<br />
Hispanic Orig<strong>in</strong> 2000 2000 2001 2002 2003 2004 2005 2006 2007 2008 2009<br />
Women 143,368,472 143,719,004 145,077,463 146,394,634 147,679,036 148,977,286 150,319,521 151,732,647 153,166,353 154,604,015 155,964,075 156,964,212 157,241,696<br />
One Race 141,381,048 141,700,632 142,928,685 144,112,252 145,257,704 146,410,035 147,599,788 148,851,751 150,114,444 151,372,373 152,547,836 153,406,307 153,663,260<br />
White 115,628,370 115,819,594 116,515,056 117,177,468 117,819,218 118,455,593 119,103,091 119,794,572 120,488,360 121,171,882 121,792,109 122,238,141 122,394,968<br />
Black 18,733,033 18,787,192 19,013,351 19,229,855 19,434,349 19,653,829 19,882,081 20,123,789 20,374,894 20,626,043 20,868,282 21,045,595 21,096,244<br />
AIAN 1,330,889 1,340,899 1,382,965 1,426,032 1,470,918 1,517,958 1,568,355 1,621,347 1,677,761 1,738,790 1,801,353 1,849,811 1,856,695<br />
Asian 5,461,425 5,523,282 5,777,829 6,029,641 6,274,263 6,513,599 6,766,622 7,021,639 7,272,048 7,523,155 7,762,568 7,941,039 7,982,186<br />
NHPI 227,331 229,665 239,484 249,256 258,956 269,056 279,639 290,404 301,381 312,503 323,524 331,721 333,167<br />
Two or More Races 1,987,424 2,018,372 2,148,778 2,282,382 2,421,332 2,567,251 2,719,733 2,880,896 3,051,909 3,231,642 3,416,239 3,557,905 3,578,436<br />
Not Hispanic 126,224,223 126,399,163 127,018,480 127,595,059 128,147,948 128,711,725 129,283,967 129,893,210 130,513,540 131,133,136 131,700,630 132,105,418 132,225,558<br />
One Race 124,486,123 124,638,077 125,161,181 125,639,729 126,092,029 126,550,271 127,013,449 127,507,688 128,006,237 128,498,027 128,935,211 129,240,659 129,344,275<br />
White 99,879,722 99,923,222 99,997,363 100,039,273 100,077,012 100,116,610 100,147,850 100,198,545 100,249,770 100,294,923 100,307,037 100,301,335 100,317,791<br />
Black 18,019,983 18,065,161 18,253,520 18,433,029 18,599,224 18,775,443 18,952,312 19,139,343 19,335,532 19,531,053 19,718,576 19,853,611 19,896,288<br />
AIAN 1,061,197 1,063,415 1,072,618 1,081,578 1,089,944 1,098,580 1,107,466 1,116,172 1,125,065 1,133,900 1,141,839 1,147,502 1,151,013<br />
Asian 5,343,737 5,403,284 5,648,205 5,889,918 6,123,659 6,351,039 6,590,707 6,831,834 7,067,419 7,302,948 7,526,044 7,691,693 7,731,607<br />
NHPI 181,484 182,995 189,475 195,931 202,190 208,599 215,114 221,794 228,451 235,203 241,715 246,518 247,576<br />
Two or More Races 1,738,100 1,761,086 1,857,299 1,955,330 2,055,919 2,161,454 2,270,518 2,385,522 2,507,303 2,635,109 2,765,419 2,864,759 2,881,283<br />
Hispanic 17,144,249 17,319,841 18,058,983 18,799,575 19,531,088 20,265,561 21,035,554 21,839,437 22,652,813 23,470,879 24,263,445 24,858,794 25,016,138<br />
One Race 16,894,925 17,062,555 17,767,504 18,472,523 19,165,675 19,859,764 20,586,339 21,344,063 22,108,207 22,874,346 23,612,625 24,165,648 24,318,985<br />
White 15,748,648 15,896,372 16,517,693 17,138,195 17,742,206 18,338,983 18,955,241 19,596,027 20,238,590 20,876,959 21,485,072 21,936,806 22,077,177<br />
Black 713,050 722,031 759,831 796,826 835,125 878,386 929,769 984,446 1,039,362 1,094,990 1,149,706 1,191,984 1,199,956<br />
AIAN 269,692 277,484 310,347 344,454 380,974 419,378 460,889 505,175 552,696 604,890 659,514 702,309 705,682<br />
Asian 117,688 119,998 129,624 139,723 150,604 162,560 175,915 189,805 204,629 220,207 236,524 249,346 250,579<br />
NHPI 45,847 46,670 50,009 53,325 56,766 60,457 64,525 68,610 72,930 77,300 81,809 85,203 85,591<br />
Two or More Races 249,324 257,286 291,479 327,052 365,413 405,797 449,215 495,374 544,606 596,533 650,820 693,146 697,153<br />
1<br />
The April 1, 2000 Population Estimates base reflects changes to the Census 2000 population from the Count Question Resolution program and geographic program revisions. The orig<strong>in</strong>al race data from<br />
Census 2000 are modified to reclassify the Some Other Race category. For more <strong>in</strong>formation see http://www.census.gov/popest/archives/files/MRSF-01-US1.html.<br />
2<br />
The data source for April 1, 2010 is the 2010 Census count. The orig<strong>in</strong>al race data from the 2010 Census are modified to reclassify the Some Other Race category. For more <strong>in</strong>formation see<br />
http://www.census.gov/popest/methodology/<strong>in</strong>tercensal_nat_meth.pdf.<br />
3<br />
The values for July 1, 2010 were produced by apply<strong>in</strong>g estimates of change <strong>in</strong> the population between April 1 and July 1 of 2010 to the 2010 Census counts. Further details on this methodology are available at<br />
http://www.census.gov/popest/methodology/<strong>in</strong>tercensal_nat_meth.pdf.<br />
Note: Hispanic orig<strong>in</strong> is considered an ethnicity, not a race. Hispanics may be of any race. Abbreviations: Black = Black or African American; AIAN = American Indian and Alaska Native; NHPI = Native<br />
Hawaiian and Other Pacific Islander.<br />
1<br />
Intercensal Estimates (as of July 1) April 1,<br />
2010 2<br />
July 1,<br />
2010 3<br />
163<br />
Source: U.S. Census Bureau, Population Division<br />
Release Date:September 2011<br />
Association of American <strong>Medical</strong> Colleges