A Comparative Analysis of Student Motivation in ... - Anitacrawley.net
A Comparative Analysis of Student Motivation in ... - Anitacrawley.net
A Comparative Analysis of Student Motivation in ... - Anitacrawley.net

You also want an ePaper? Increase the reach of your titles
YUMPU automatically turns print PDFs into web optimized ePapers that Google loves.
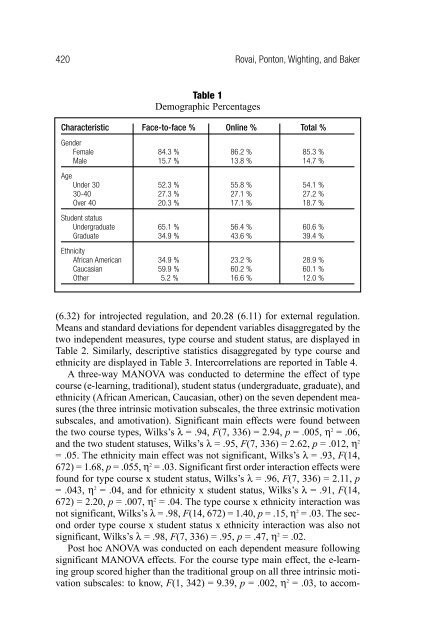
420 Rovai, Ponton, Wight<strong>in</strong>g, and BakerTable 1Demographic PercentagesCharacteristic Face-to-face % Onl<strong>in</strong>e % Total %GenderFemale 84.3 % 86.2 % 85.3 %Male 15.7 % 13.8 % 14.7 %AgeUnder 30 52.3 % 55.8 % 54.1 %30-40 27.3 % 27.1 % 27.2 %Over 40 20.3 % 17.1 % 18.7 %<strong>Student</strong> statusUndergraduate 65.1 % 56.4 % 60.6 %Graduate 34.9 % 43.6 % 39.4 %EthnicityAfrican American 34.9 % 23.2 % 28.9 %Caucasian 59.9 % 60.2 % 60.1 %Other 5.2 % 16.6 % 12.0 %(6.32) for <strong>in</strong>trojected regulation, and 20.28 (6.11) for external regulation.Means and standard deviations for dependent variables disaggregated by thetwo <strong>in</strong>dependent measures, type course and student status, are displayed <strong>in</strong>Table 2. Similarly, descriptive statistics disaggregated by type course andethnicity are displayed <strong>in</strong> Table 3. Intercorrelations are reported <strong>in</strong> Table 4.A three-way MANOVA was conducted to determ<strong>in</strong>e the effect <strong>of</strong> typecourse (e-learn<strong>in</strong>g, traditional), student status (undergraduate, graduate), andethnicity (African American, Caucasian, other) on the seven dependent measures(the three <strong>in</strong>tr<strong>in</strong>sic motivation subscales, the three extr<strong>in</strong>sic motivationsubscales, and amotivation). Significant ma<strong>in</strong> effects were found betweenthe two course types, Wilks’s λ = .94, F(7, 336) = 2.94, p = .005, η 2 = .06,and the two student statuses, Wilks’s λ = .95, F(7, 336) = 2.62, p = .012, η 2= .05. The ethnicity ma<strong>in</strong> effect was not significant, Wilks’s λ = .93, F(14,672) = 1.68, p = .055, η 2 = .03. Significant first order <strong>in</strong>teraction effects werefound for type course x student status, Wilks’s λ = .96, F(7, 336) = 2.11, p= .043, η 2 = .04, and for ethnicity x student status, Wilks’s λ = .91, F(14,672) = 2.20, p = .007, η 2 = .04. The type course x ethnicity <strong>in</strong>teraction wasnot significant, Wilks’s λ = .98, F(14, 672) = 1.40, p = .15, η 2 = .03. The secondorder type course x student status x ethnicity <strong>in</strong>teraction was also notsignificant, Wilks’s λ = .98, F(7, 336) = .95, p = .47, η 2 = .02.Post hoc ANOVA was conducted on each dependent measure follow<strong>in</strong>gsignificant MANOVA effects. For the course type ma<strong>in</strong> effect, the e-learn<strong>in</strong>ggroup scored higher than the traditional group on all three <strong>in</strong>tr<strong>in</strong>sic motivationsubscales: to know, F(1, 342) = 9.39, p = .002, η 2 = .03, to accom-