

Non-rigid registration between 3D ultrasound and CT ... - isl, ee, kaist
Non-rigid registration between 3D ultrasound and CT ... - isl, ee, kaist
Non-rigid registration between 3D ultrasound and CT ... - isl, ee, kaist

Create successful ePaper yourself
Turn your PDF publications into a flip-book with our unique Google optimized e-Paper software.
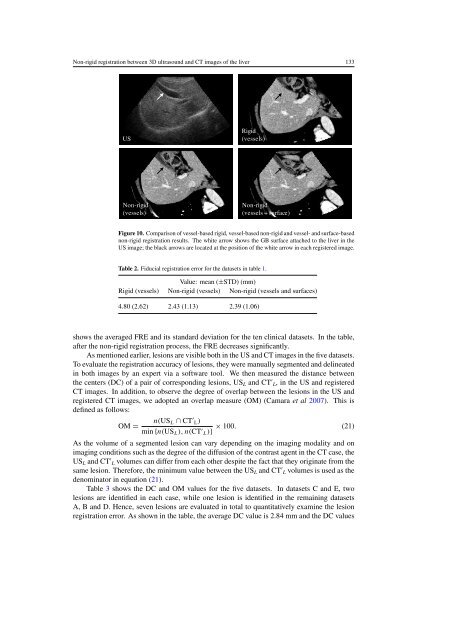
<strong>Non</strong>-<strong>rigid</strong> <strong>registration</strong> <strong>betw<strong>ee</strong>n</strong> <strong>3D</strong> <strong>ultrasound</strong> <strong>and</strong> <strong>CT</strong> images of the liver 133USRigid(vessels)<strong>Non</strong>-<strong>rigid</strong>(vessels)<strong>Non</strong>-<strong>rigid</strong>(vessels + surface)Figure 10. Comparison of vessel-based <strong>rigid</strong>, vessel-based non-<strong>rigid</strong> <strong>and</strong> vessel- <strong>and</strong> surface-basednon-<strong>rigid</strong> <strong>registration</strong> results. The white arrow shows the GB surface attached to the liver in theUS image; the black arrows are located at the position of the white arrow in each registered image.Table 2. Fiducial <strong>registration</strong> error for the datasets in table 1.Value: mean (±STD) (mm)Rigid (vessels) <strong>Non</strong>-<strong>rigid</strong> (vessels) <strong>Non</strong>-<strong>rigid</strong> (vessels <strong>and</strong> surfaces)4.80 (2.62) 2.43 (1.13) 2.39 (1.06)shows the averaged FRE <strong>and</strong> its st<strong>and</strong>ard deviation for the ten clinical datasets. In the table,after the non-<strong>rigid</strong> <strong>registration</strong> process, the FRE decreases significantly.As mentioned earlier, lesions are visible both in the US <strong>and</strong> <strong>CT</strong> images in the five datasets.To evaluate the <strong>registration</strong> accuracy of lesions, they were manually segmented <strong>and</strong> delineatedin both images by an expert via a software tool. We then measured the distance <strong>betw<strong>ee</strong>n</strong>the centers (DC) of a pair of corresponding lesions, US L <strong>and</strong> <strong>CT</strong> ′ L, in the US <strong>and</strong> registered<strong>CT</strong> images. In addition, to observe the degr<strong>ee</strong> of overlap <strong>betw<strong>ee</strong>n</strong> the lesions in the US <strong>and</strong>registered <strong>CT</strong> images, we adopted an overlap measure (OM) (Camara et al 2007). This isdefined as follows:n(US L ∩ <strong>CT</strong> ′ L)OM =× 100. (21)min {n(US L ), n(<strong>CT</strong> ′ L)}As the volume of a segmented lesion can vary depending on the imaging modality <strong>and</strong> onimaging conditions such as the degr<strong>ee</strong> of the diffusion of the contrast agent in the <strong>CT</strong> case, theUS L <strong>and</strong> <strong>CT</strong> ′ L volumes can differ from each other despite the fact that they originate from thesame lesion. Therefore, the minimum value <strong>betw<strong>ee</strong>n</strong> the US L <strong>and</strong> <strong>CT</strong> ′ L volumes is used as thedenominator in equation (21).Table 3 shows the DC <strong>and</strong> OM values for the five datasets. In datasets C <strong>and</strong> E, twolesions are identified in each case, while one lesion is identified in the remaining datasetsA, B <strong>and</strong> D. Hence, seven lesions are evaluated in total to quantitatively examine the lesion<strong>registration</strong> error. As shown in the table, the average DC value is 2.84 mm <strong>and</strong> the DC values