Final Report - Vulnerability Committee
Final Report - Vulnerability Committee
Final Report - Vulnerability Committee
Create successful ePaper yourself
Turn your PDF publications into a flip-book with our unique Google optimized e-Paper software.
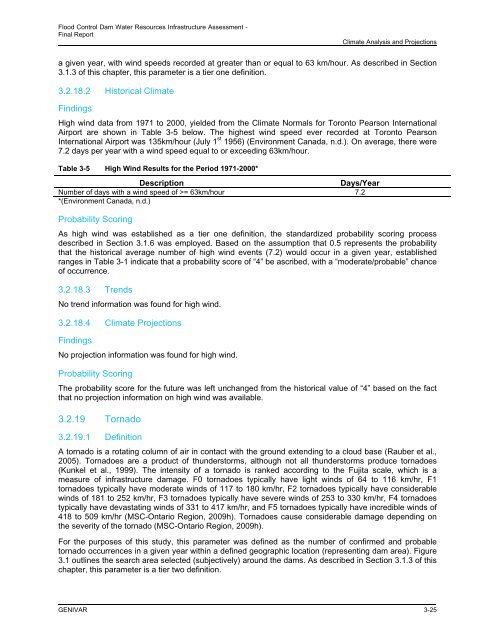
Flood Control Dam Water Resources Infrastructure Assessment -<strong>Final</strong> <strong>Report</strong>Climate Analysis and Projectionsa given year, with wind speeds recorded at greater than or equal to 63 km/hour. As described in Section3.1.3 of this chapter, this parameter is a tier one definition.3.2.18.2 Historical ClimateFindingsHigh wind data from 1971 to 2000, yielded from the Climate Normals for Toronto Pearson InternationalAirport are shown in Table 3-5 below. The highest wind speed ever recorded at Toronto PearsonInternational Airport was 135km/hour (July 1 st 1956) (Environment Canada, n.d.). On average, there were7.2 days per year with a wind speed equal to or exceeding 63km/hour.Table 3-5 High Wind Results for the Period 1971-2000*DescriptionDays/YearNumber of days with a wind speed of >= 63km/hour 7.2*(Environment Canada, n.d.)Probability ScoringAs high wind was established as a tier one definition, the standardized probability scoring processdescribed in Section 3.1.6 was employed. Based on the assumption that 0.5 represents the probabilitythat the historical average number of high wind events (7.2) would occur in a given year, establishedranges in Table 3-1 indicate that a probability score of “4” be ascribed, with a “moderate/probable” chanceof occurrence.3.2.18.3 TrendsNo trend information was found for high wind.3.2.18.4 Climate ProjectionsFindingsNo projection information was found for high wind.Probability ScoringThe probability score for the future was left unchanged from the historical value of “4” based on the factthat no projection information on high wind was available.3.2.19 Tornado3.2.19.1 DefinitionA tornado is a rotating column of air in contact with the ground extending to a cloud base (Rauber et al.,2005). Tornadoes are a product of thunderstorms, although not all thunderstorms produce tornadoes(Kunkel et al., 1999). The intensity of a tornado is ranked according to the Fujita scale, which is ameasure of infrastructure damage. F0 tornadoes typically have light winds of 64 to 116 km/hr, F1tornadoes typically have moderate winds of 117 to 180 km/hr, F2 tornadoes typically have considerablewinds of 181 to 252 km/hr, F3 tornadoes typically have severe winds of 253 to 330 km/hr, F4 tornadoestypically have devastating winds of 331 to 417 km/hr, and F5 tornadoes typically have incredible winds of418 to 509 km/hr (MSC-Ontario Region, 2009h). Tornadoes cause considerable damage depending onthe severity of the tornado (MSC-Ontario Region, 2009h).For the purposes of this study, this parameter was defined as the number of confirmed and probabletornado occurrences in a given year within a defined geographic location (representing dam area). Figure3.1 outlines the search area selected (subjectively) around the dams. As described in Section 3.1.3 of thischapter, this parameter is a tier two definition.GENIVAR 3-25


