Final Report - Vulnerability Committee
Final Report - Vulnerability Committee
Final Report - Vulnerability Committee

Create successful ePaper yourself
Turn your PDF publications into a flip-book with our unique Google optimized e-Paper software.
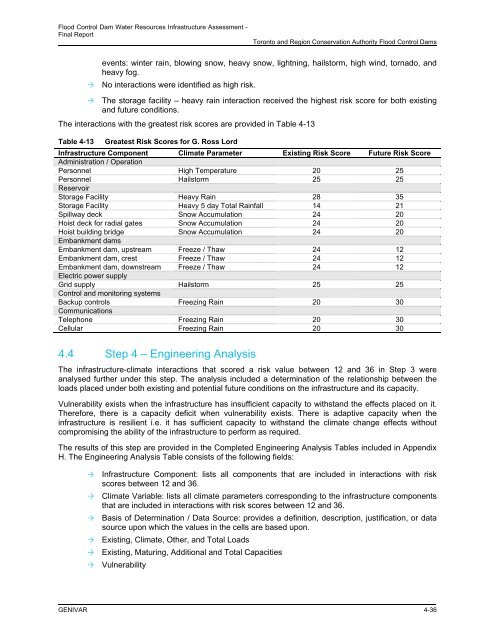
Flood Control Dam Water Resources Infrastructure Assessment -<strong>Final</strong> <strong>Report</strong>Toronto and Region Conservation Authority Flood Control Damsevents: winter rain, blowing snow, heavy snow, lightning, hailstorm, high wind, tornado, andheavy fog.No interactions were identified as high risk. The storage facility – heavy rain interaction received the highest risk score for both existingand future conditions.The interactions with the greatest risk scores are provided in Table 4-13Table 4-13 Greatest Risk Scores for G. Ross LordInfrastructure Component Climate Parameter Existing Risk Score Future Risk ScoreAdministration / OperationPersonnel High Temperature 20 25Personnel Hailstorm 25 25ReservoirStorage Facility Heavy Rain 28 35Storage Facility Heavy 5 day Total Rainfall 14 21Spillway deck Snow Accumulation 24 20Hoist deck for radial gates Snow Accumulation 24 20Hoist building bridge Snow Accumulation 24 20Embankment damsEmbankment dam, upstream Freeze / Thaw 24 12Embankment dam, crest Freeze / Thaw 24 12Embankment dam, downstream Freeze / Thaw 24 12Electric power supplyGrid supply Hailstorm 25 25Control and monitoring systemsBackup controls Freezing Rain 20 30CommunicationsTelephone Freezing Rain 20 30Cellular Freezing Rain 20 304.4 Step 4 – Engineering AnalysisThe infrastructure-climate interactions that scored a risk value between 12 and 36 in Step 3 wereanalysed further under this step. The analysis included a determination of the relationship between theloads placed under both existing and potential future conditions on the infrastructure and its capacity.<strong>Vulnerability</strong> exists when the infrastructure has insufficient capacity to withstand the effects placed on it.Therefore, there is a capacity deficit when vulnerability exists. There is adaptive capacity when theinfrastructure is resilient i.e. it has sufficient capacity to withstand the climate change effects withoutcompromising the ability of the infrastructure to perform as required.The results of this step are provided in the Completed Engineering Analysis Tables included in AppendixH. The Engineering Analysis Table consists of the following fields:Infrastructure Component: lists all components that are included in interactions with riskscores between 12 and 36.Climate Variable: lists all climate parameters corresponding to the infrastructure componentsthat are included in interactions with risk scores between 12 and 36.Basis of Determination / Data Source: provides a definition, description, justification, or datasource upon which the values in the cells are based upon.Existing, Climate, Other, and Total LoadsExisting, Maturing, Additional and Total Capacities<strong>Vulnerability</strong>GENIVAR 4-36