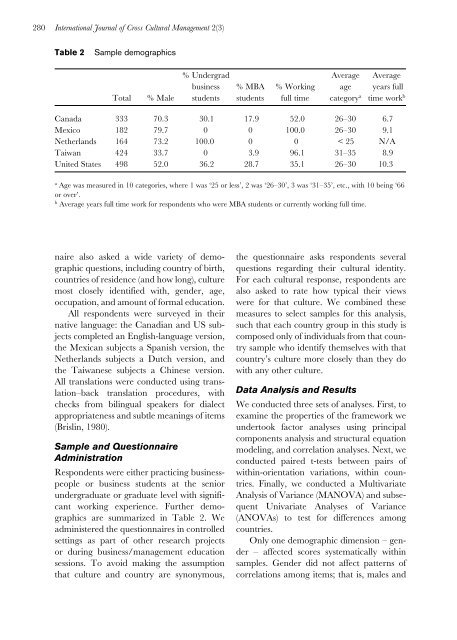
280International Journal of Cross <strong>Cultural</strong> Management 2(3)Table 2Sample demographics% Undergrad Average Averagebusiness % MBA % Working age years fullTotal % Male students students full time category a time work bCanada 333 70.3 30.1 17.9 52.0 26–30 6.7Mexico 182 79.7 0 0 100.0 26–30 9.1Netherlands 164 73.2 100.0 0 0 < 25 N/ATaiwan 424 33.7 0 3.9 96.1 31–35 8.9United States 498 52.0 36.2 28.7 35.1 26–30 10.3aAge was measured in 10 categories, where 1 was ‘25 or less’, 2 was ‘26–30’, 3 was ‘31–35’, etc., with 10 being ‘66or over’.bAverage years full time work for respondents who were MBA students or currently working full time.naire also asked a wide variety of demographicquestions, including country of birth,countries of residence (and how long), culturemost closely identified with, gender, age,occupation, and amount of formal education.All respondents were surveyed in theirnative language: the Canadian and US subjectscompleted an English-language version,the Mexican subjects a Spanish version, theNetherlands subjects a Dutch version, andthe Taiwanese subjects a Chinese version.All translations were conducted using translation–backtranslation procedures, withchecks from bilingual speakers for dialectappropriateness and subtle meanings of items(Brislin, 1980).Sample and QuestionnaireAdministrationRespondents were either practicing businesspeopleor business students at the seniorundergraduate or graduate level with significantworking experience. Further demographicsare summarized in Table 2. Weadministered the questionnaires in controlledsettings as part of other research projectsor during business/management educationsessions. To avoid making the assumptionthat culture and country are synonymous,the questionnaire asks respondents severalquestions regarding their cultural identity.For each cultural response, respondents arealso asked to rate how typical their viewswere for that culture. We combined thesemeasures to select samples for this analysis,such that each country group in this study iscomposed only of individuals from that countrysample who identify themselves with thatcountry’s culture more closely than they dowith any other culture.Data Analysis and ResultsWe conducted three sets of analyses. First, toexamine the properties of the framework weundertook factor analyses using principalcomponents analysis and structural equationmodeling, and correlation analyses. Next, weconducted paired t-tests between pairs ofwithin-orientation variations, within countries.Finally, we conducted a MultivariateAnalysis of Variance (MANOVA) and subsequentUnivariate Analyses of Variance(ANOVAs) to test for differences amongcountries.Only one demographic dimension – gender– affected scores systematically withinsamples. Gender did not affect patterns ofcorrelations among items; that is, males and
Maznevski et al.: <strong>Cultural</strong> Dimensions at the Individual Level of Analysis 281females from each sample had the same patternof correlations between items. Thereforewe did not control for gender when conductinganalyses regarding within-personrelationships among the items. Gender wasrelated, though, to differences in mean scoreson some of the variations in some samples. 2When comparing mean scores within andacross countries we controlled for the gendereffect by using subsamples with the samenumber of male and female respondents.Factor Analysis and InternalConsistency of MeasuresTo examine the structure of the data andcompare it to the model, we separately testedeach orientation with its respective variations(e.g. all Relationships items together). 3 We firstconducted a principal components analysisin each individual country and in an aggregatedsample with the same number ofrespondents from each country. We exploredthe factor structure within each orientation,and eliminated a total of 13 items (no morethan two from any variation) that did notload clearly on the intended factor. To assessthe theoretical framework, we conductedconfirmatory factor analysis with the revisedset of items for each orientation usingLISREL8 (Jöreskog and Sörbom, 1993). Weevaluated the model in the aggregated balancedsample, then within each countrysample. The results of the LISREL analysesare presented in Table 3, with results for thefull model in the first half of the table andresults for the revised model (reduced set ofitems) in the second half of the table. Eachanalysis reports the χ 2 statistic for the full andnull models, the root mean square residual,and goodness of fit and adjusted goodness offit indices.The standard for acceptable goodness offit and adjusted goodness of fit indices forestablished research is .95 or higher, while.90 is acceptable for early or exploratoryresearch (Hair et al., 1992). The models hadbetter psychometric properties when testedwith the aggregated sample than within theindividual countries. This is probably due tothe increased overall variance and samplesize when all countries are included, and thefact that items loaded with different strengthsin the various country samples. The goodnessof fit indices (GFI) for the aggregated dataset ranged from .91 to .93. In our withincountryanalyses, the 20 GFI ranged from.84 to .94. We concluded that the resultsmet or approximated the standards for earlyresearch although they did not reach thestandards for established research. We proceededto check for patterns in the data, recognizingthat for some variations the amountof measurement error may attenuate theresults.To examine relationships among variations,we calculated correlations for theaggregated sample and each of the fivecountry samples, using the revised set ofitems for each variation. The correlations arereported in Table 4, which highlights withinorientationcorrelations.The relationships among variations differwidely among the five samples. Even wherethe direction and significance of correlationsare the same, such as a positive correlationbetween Activity–doing and thinking andbetween Environment–mastery and harmony in allsamples, the magnitude of the correlationsvaries greatly. This observation reinforcesthe importance of adopting a more multidimensionaland individual-level approach tocross cultural analysis to obtain a more comprehensivepicture of culture.Analyses of VarianceCalculation of scores for means comparisonsPrevious research has demonstrateda significant country effect on respondents’tendency to use different parts of the scale(Leung and Bond, 1989; Mullen, 1995; Singh,1995). The established procedure for removingbias associated with scale response iswithin-person standardization (Leung andBond, 1989). We standardized the data with-