Cultural dimensions - IMD
Cultural dimensions - IMD
Cultural dimensions - IMD

You also want an ePaper? Increase the reach of your titles
YUMPU automatically turns print PDFs into web optimized ePapers that Google loves.
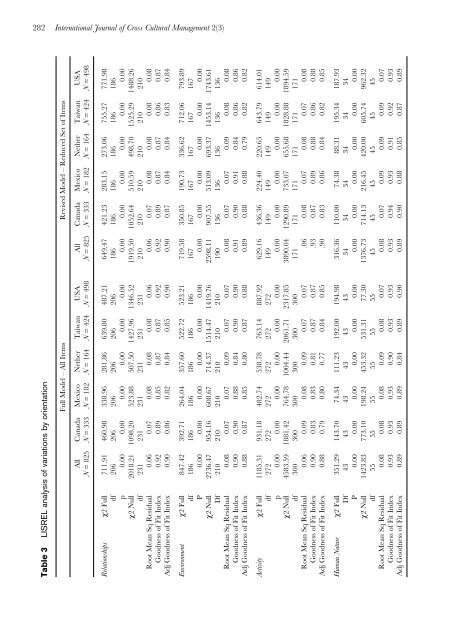
282International Journal of Cross <strong>Cultural</strong> Management 2(3)Table 3 LISREL analysis of variations by orientationFull Model – All Items Revised Model – Reduced Set of ItemsAll Canada Mexico Nether Taiwan USA All Canada Mexico Nether Taiwan USAN = 825 N = 333 N = 182 N = 164 N = 424 N = 498 N = 825 N = 333 N = 182 N = 164 N = 424 N = 498Relationships χ2 Full 711.91 460.98 338.96 281.86 639.80 487.21 649.47 421.23 283.15 273.06 755.27 771.98df 206 206 206 206 206 206 186 186 186 186 186 186p 0.00 0.00 0.00 0.00 0.00 0.00 0.00 0.00 0.00 0.00 0.00 0.00χ2 Null 2018.21 1098.20 523.88 507.50 1427.96 1346.52 1919.50 1052.64 510.59 498.70 1525.29 1488.26df 231 231 231 231 231 231 210 210 210 210 210 210Root Mean Sq Residual 0.06 0.07 0.08 0.08 0.08 0.06 0.06 0.07 0.08 0.08 0.08 0.08Goodness of Fit Index 0.92 0.89 0.85 0.87 0.87 0.92 0.92 0.89 0.87 0.87 0.86 0.87Adj Goodness of Fit Index 0.90 0.86 0.82 0.84 0.85 0.90 0.90 0.87 0.84 0.84 0.83 0.84Environment χ2 Full 847.42 392.71 264.04 357.60 522.72 523.21 719.58 350.85 190.73 336.62 712.06 793.89df 186 186 186 186 186 186 167 167 167 167 167 167P 0.00 0.00 0.00 0.00 0.00 0.00 0.00 0.00 0.00 0.00 0.00 0.00χ2 Null 2736.47 954.16 608.67 714.37 1514.47 1419.76 2598.11 907.55 513.09 693.37 1453.14 1743.61Df 210 210 210 210 210 210 190 136 136 136 136 136Root Mean Sq Residual 0.08 0.07 0.07 0.09 0.07 0.07 0.08 0.07 0.07 0.09 0.08 0.08Goodness of Fit Index 0.90 0.90 0.88 0.84 0.90 0.90 0.91 0.90 0.91 0.84 0.86 0.86Adj Goodness of Fit Index 0.88 0.87 0.85 0.80 0.87 0.88 0.89 0.88 0.88 0.79 0.82 0.82Activity χ2 Full 1185.31 931.18 482.74 538.78 763.14 887.92 629.16 436.36 224.40 220.65 643.79 614.01df 272 272 272 272 272 272 149 149 149 149 149 149p 0.00 0.00 0.00 0.00 0.00 0.00 0.00 0.00 0.00 0.00 0.00 0.00χ2 Null 4583.59 1881.42 764.78 1004.44 2061.71 2317.85 3890.04 1290.89 733.07 655.68 1828.88 1894.59df 300 300 300 300 300 300 171 171 171 171 171 171Root Mean Sq Residual 0.06 0.09 0.08 0.09 0.07 0.07 .06 0.08 0.07 0.08 0.07 0.08Goodness of Fit Index 0.90 0.83 0.83 0.81 0.87 0.87 .93 0.87 0.89 0.88 0.86 0.88Adj Goodness of Fit Index 0.88 0.79 0.80 0.77 0.84 0.85 .90 0.83 0.86 0.84 0.82 0.85Human Nature χ2 Full 351.29 143.70 74.34 111.23 192.00 194.98 316.36 110.00 74.38 88.31 195.34 187.93Df 43 43 43 43 43 43 34 34 34 34 34 34P 0.00 0.00 0.00 0.00 0.00 0.00 0.00 0.00 0.00 0.00 0.00 0.00χ2 Null 1423.83 773.10 198.24 453.32 531.31 77.30 1376.73 714.13 216.45 420.00 605.74 962.32df 55 55 55 55 55 55 45 45 45 45 45 45Root Mean Sq Residual 0.08 0.08 0.08 0.09 0.08 0.07 0.08 0.07 0.09 0.09 0.09 0.07Goodness of Fit Index 0.93 0.93 0.93 0.90 0.93 0.93 0.93 0.94 0.93 0.91 0.92 0.93Adj Goodness of Fit Index 0.89 0.89 0.89 0.84 0.89 0.90 0.89 0.90 0.88 0.85 0.87 0.89