September 2004 - bcps
September 2004 - bcps
September 2004 - bcps

You also want an ePaper? Increase the reach of your titles
YUMPU automatically turns print PDFs into web optimized ePapers that Google loves.
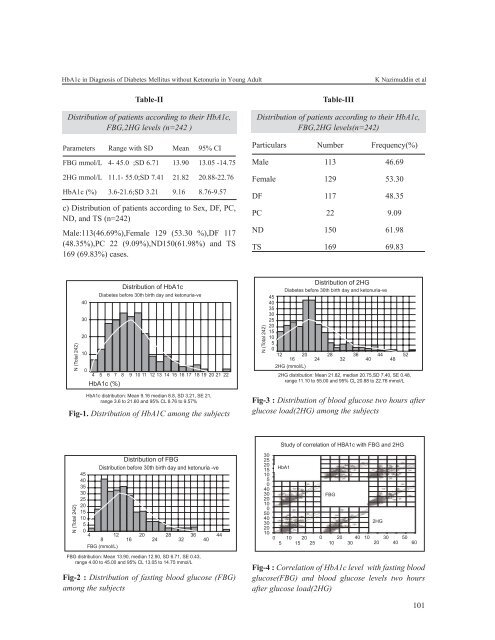
HbA1c in Diagnosis of Diabetes Mellitus without Ketonuria in Young AdultK Nazimuddin et alTable-IIDistribution of patients according to their HbA1c,FBG,2HG levels (n=242 )Parameters Range with SD Mean 95% CIFBG mmol/L 4- 45.0 ;SD 6.71 13.90 13.05 -14.752HG mmol/L 11.1- 55.0;SD 7.41 21.82 20.88-22.76HbA1c (%) 3.6-21.6;SD 3.21 9.16 8.76-9.57c) Distribution of patients according to Sex, DF, PC,ND, and TS (n=242)Male:113(46.69%),Female 129 (53.30 %),DF 117(48.35%),PC 22 (9.09%),ND150(61.98%) and TS169 (69.83%) cases.Table-IIIDistribution of patients according to their HbA1c,FBG,2HG levels(n=242)Particulars Number Frequency(%)Male 113 46.69Female 129 53.30DF 117 48.35PC 22 9.09ND 150 61.98TS 169 69.83N (Total 242)Distribution of 2HGDiabetes before 30th birth day and ketonuria-ve45403530252015105012 20 28 36 44 5216 24 32 40 482HG (mmol/L)2HG distribution: Mean 21.82, median 20.75,SD 7.40, SE 0.48,range 11.10 to 55.00 and 95% CL 20.88 to 22.76 mmol/LFig-1. Distribution of HbA1C among the subjectsFig-3 : Distribution of blood glucose two hours afterglucose load(2HG) among the subjectsFig-2 : Distribution of fasting blood glucose (FBG)among the subjectsFig-4 : Correlation of HbA1c level with fasting bloodglucose(FBG) and blood glucose levels two hoursafter glucose load(2HG)101